Estimated zip code population in 2022: 5,099 Zip code population in 2010: 5,283 Zip code population in 2000: 5,307
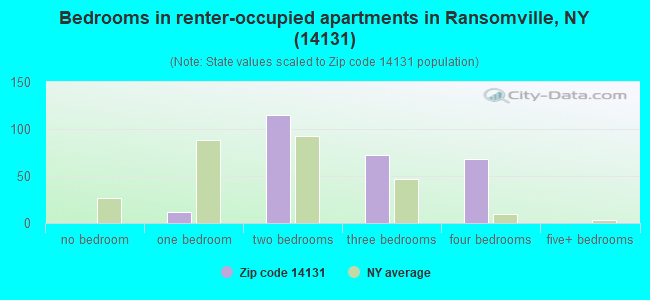
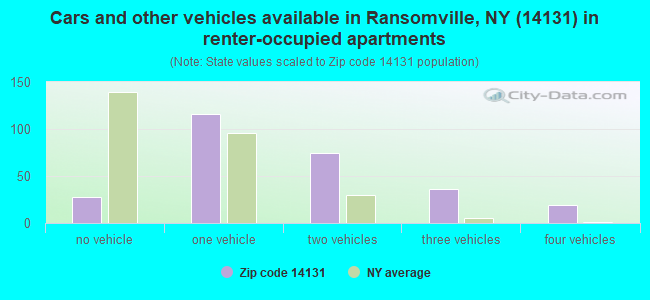
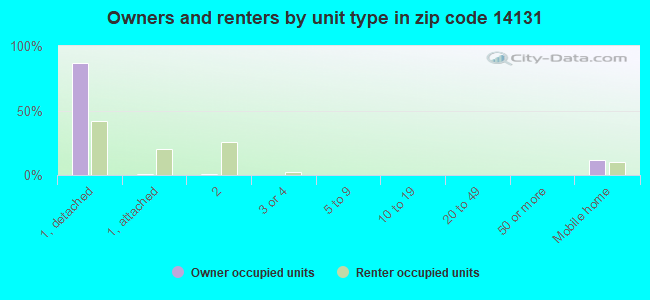
Houses and condos: 2,317 Renter-occupied apartments: 272
% of renters here:
13%
State:
46%
March 2022 cost of living index in zip code 14131: 94.5 (less than average, U.S. average is 100)
Land area: 42.3 sq. mi. Water area: 0.7 sq. mi.
Population density: 121 people per square mile
(very low).
OSM Map
General Map
Google Map
MSN Map
OSM Map
General Map
Google Map
MSN Map
OSM Map
General Map
Google Map
MSN Map
OSM Map
General Map
Google Map
MSN Map
Please wait while loading the map...
Real estate property taxes paid for housing units in 2022:
This zip code:
2.1% ($4,005)
New York:
1.5% ($6,180)
Median real estate property taxes paid for housing units with mortgages in 2022: $4,320 (1.9%) Median real estate property taxes paid for housing units with no mortgage in 2022: $3,533 (2.1%)
Business Search- 14 Million verified businesses
Males: 2,497
(49.0%)
Females: 2,602
(51.0%)
For population 25 years and over in 14131:
High school or higher: 92.2%
Bachelor's degree or higher: 18.9%
Graduate or professional degree: 8.8%
Unemployed: 3.0%
Mean travel time to work (commute): 26.1 minutes
For population 15 years and over in 14131:
Never married: 20.5%
Now married: 62.0%
Separated: 2.0%
Widowed: 8.2%
Divorced: 7.3%
Zip code 14131 compared to state average:
Median house value below state average.
Unemployed percentage below state average.
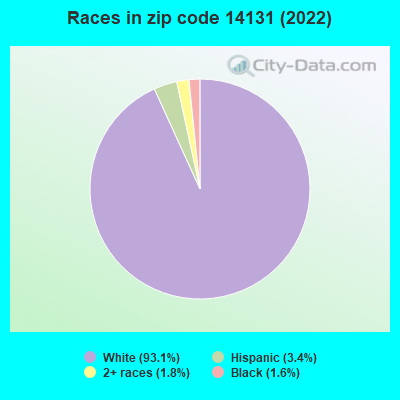
Black race population percentage significantly below state average.
Hispanic race population percentage significantly below state average.
Median age significantly above state average.
Foreign-born population percentage significantly below state average.
Renting percentage significantly below state average.
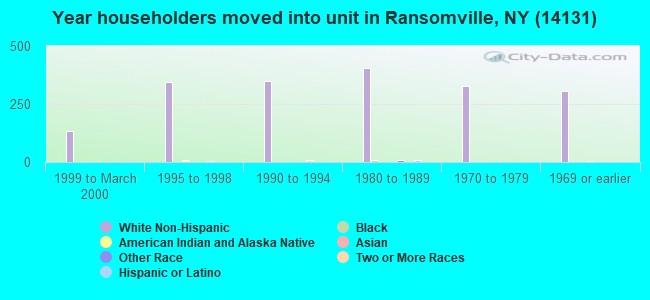
Length of stay since moving in significantly above state average.
Number of rooms per house above state average.
Percentage of population with a bachelor's degree or higher below state average.
Estimated median house/condo value in 2022: $192,330
14131:
$192,330
New York:
$400,400
According to our research of New York and other state lists, there were 6 registered sex offenders living in 14131 zip code as of June 19, 2024. The ratio of all residents to sex offenders in zip code 14131 is 910 to 1. The ratio of registered sex offenders to all residents in this zip code is near the state average.
Median resident age:
This zip code:
53.0 years
New York median age:
40.0 years
Average household size:
This zip code:
2.4 people
New York:
2.5 people
Averages for the 2020 tax year for zip code 14131, filed in 2021:
Average Adjusted Gross Income (AGI) in 2020: $62,935 (Individual Income Tax Returns)
Here:
$62,935
State:
$90,930
Salary/wage: $53,365 (reported on 78.1% of returns)
Here:
$53,365
State:
$72,104
(% of AGI for various income ranges: 1166.0% for AGIs below $25k, 3207.3% for AGIs $25k-50k, 5614.1% for AGIs $50k-75k, 8940.0% for AGIs $75k-100k, 15672.3% for AGIs $100k-200k, 40083.3% for AGIs over 200k)
Taxable interest for individuals: $833 (reported on 38.9% of returns)
This zip code:
$833
New York:
$3,075
(% of AGI for various income ranges: 15.2% for AGIs below $25k, 27.1% for AGIs $25k-50k, 40.9% for AGIs $50k-75k, 75.3% for AGIs $75k-100k, 71.5% for AGIs $100k-200k, 593.3% for AGIs over 200k)
Ordinary dividends: $3,160 (reported on 19.6% of returns)
Here:
$3,160
State:
$11,095
(% of AGI for various income ranges: 28.5% for AGIs below $25k, 24.6% for AGIs $25k-50k, 45.9% for AGIs $50k-75k, 43.7% for AGIs $75k-100k, 132.7% for AGIs $100k-200k, 2640.0% for AGIs over 200k)
Net capital gain/loss in AGI: +$8,633 (reported on 15.8% of returns)
Here:
+$8,633
State:
+$44,925
(% of AGI for various income ranges: 11.5% for AGIs below $25k, 32.1% for AGIs $25k-50k, 81.2% for AGIs $50k-75k, 108.4% for AGIs $75k-100k, 383.5% for AGIs $100k-200k, 6453.3% for AGIs over 200k)
Profit/loss from business: +$8,152 (reported on 10.2% of returns)
Here:
+$8,152
State:
+$14,940
(% of AGI for various income ranges: 54.6% for AGIs below $25k, 79.0% for AGIs $25k-50k, 199.1% for AGIs $50k-75k, 66.3% for AGIs $75k-100k, 285.8% for AGIs $100k-200k)
Taxable individual retirement arrangement distribution: $18,697 (reported on 11.3% of returns)
14131:
$18,697
New York:
$19,609
(% of AGI for various income ranges: 112.7% for AGIs below $25k, 91.7% for AGIs $25k-50k, 269.7% for AGIs $50k-75k, 403.2% for AGIs $75k-100k, 1121.9% for AGIs $100k-200k)
Total itemized deductions: $28,882 (reported on 4.2% of returns)
Here:
$28,882
State:
$39,326
(% of AGI for various income ranges: 156.0% for AGIs below $25k, 213.4% for AGIs $50k-75k, 647.3% for AGIs $100k-200k)
Charity contributions: $6,088 (reported on 3.0% of returns)
Here:
$6,088
State:
$15,420
(% of AGI for various income ranges: 16.9% for AGIs $50k-75k, 166.5% for AGIs $100k-200k)
Taxes paid: $7,427 (reported on 4.2% of returns)
14131:
$7,427
State:
$9,183
(% of AGI for various income ranges: 30.2% for AGIs below $25k, 85.9% for AGIs $50k-75k, 148.1% for AGIs $100k-200k)
Earned income credit: $1,900 (reported on 11.7% of returns)
Here:
$1,900
State:
$2,138
(% of AGI for various income ranges: 61.3% for AGIs below $25k, 51.9% for AGIs $25k-50k)
Percentage of individuals using paid preparers for their 2020 taxes: 95.5%
Here:
95%
State:
95%
(% for various income ranges: 93.7% for AGIs below $25k, 95.5% for AGIs $25k-50k, 97.7% for AGIs $50k-75k, 96.6% for AGIs $75k-100k, 97.5% for AGIs $100k-200k, 85.7% for AGIs over 200k)
Averages for the 2012 tax year for zip code 14131, filed in 2013:
Average Adjusted Gross Income (AGI) in 2012: $50,977 (Individual Income Tax Returns)
Here:
$50,977
State:
$77,088
Salary/wage: $44,515 (reported on 84.6% of returns)
Here:
$44,515
State:
$60,593
(% of AGI for various income ranges: 68.0% for AGIs below $25k, 74.4% for AGIs $25k-50k, 76.3% for AGIs $50k-75k, 81.4% for AGIs $75k-100k, 80.1% for AGIs $100k-200k, 41.4% for AGIs over 200k)
Taxable interest for individuals: $526 (reported on 46.5% of returns)
This zip code:
$526
New York:
$3,125
(% of AGI for various income ranges: 1.1% for AGIs below $25k, 0.6% for AGIs $25k-50k, 0.4% for AGIs $50k-75k, 0.4% for AGIs $75k-100k, 0.3% for AGIs $100k-200k, 0.5% for AGIs over 200k)
Ordinary dividends: $3,373 (reported on 23.1% of returns)
Here:
$3,373
State:
$10,299
(% of AGI for various income ranges: 1.0% for AGIs below $25k, 0.6% for AGIs $25k-50k, 0.7% for AGIs $50k-75k, 0.6% for AGIs $75k-100k, 0.9% for AGIs $100k-200k, 9.0% for AGIs over 200k)
Net capital gain/loss in AGI: +$3,747 (reported on 13.8% of returns)
Here:
+$3,747
State:
+$42,474
(% of AGI for various income ranges: 0.2% for AGIs $25k-50k, 0.2% for AGIs $50k-75k, 0.6% for AGIs $75k-100k, 3.0% for AGIs $100k-200k)
Profit/loss from business: +$8,557 (reported on 8.8% of returns)
Here:
+$8,557
State:
+$16,168
(% of AGI for various income ranges: 3.5% for AGIs below $25k, 1.0% for AGIs $25k-50k, 1.1% for AGIs $50k-75k, 0.4% for AGIs $75k-100k, 2.6% for AGIs $100k-200k)
Taxable individual retirement arrangement distribution: $9,763 (reported on 10.4% of returns)
14131:
$9,763
New York:
$17,621
(% of AGI for various income ranges: 3.4% for AGIs below $25k, 2.1% for AGIs $25k-50k, 2.1% for AGIs $50k-75k, 2.0% for AGIs $75k-100k, 2.1% for AGIs $100k-200k)
Total itemized deductions: $19,562 (20% of AGI, reported on 28.5% of returns)
Here:
$19,562
State:
$34,985
Here:
20.1% of AGI
State:
21.3% of AGI
(% of AGI for various income ranges: 7.6% for AGIs below $25k, 7.8% for AGIs $25k-50k, 9.2% for AGIs $50k-75k, 11.7% for AGIs $75k-100k, 14.1% for AGIs $100k-200k, 12.7% for AGIs over 200k)
Charity contributions: $2,660 (reported on 23.1% of returns)
Here:
$2,660
State:
$5,572
(% of AGI for various income ranges: 0.3% for AGIs below $25k, 0.7% for AGIs $25k-50k, 0.9% for AGIs $50k-75k, 1.2% for AGIs $75k-100k, 2.0% for AGIs $100k-200k, 1.1% for AGIs over 200k)
Taxes paid: $9,932 (reported on 28.5% of returns)
14131:
$9,932
State:
$18,656
(% of AGI for various income ranges: 2.1% for AGIs below $25k, 2.9% for AGIs $25k-50k, 4.2% for AGIs $50k-75k, 5.6% for AGIs $75k-100k, 7.8% for AGIs $100k-200k, 9.8% for AGIs over 200k)
Earned income credit: $1,909 (reported on 13.5% of returns)
Here:
$1,909
State:
$2,230
(% of AGI for various income ranges: 4.1% for AGIs below $25k, 0.9% for AGIs $25k-50k)
Percentage of individuals using paid preparers for their 2012 taxes: 62.3%
Here:
62%
State:
66%
(% for various income ranges: 58.3% for AGIs below $25k, 59.4% for AGIs $25k-50k, 69.0% for AGIs $50k-75k, 69.2% for AGIs $75k-100k, 72.4% for AGIs $100k-200k)
Averages for the 2004 tax year for zip code 14131, filed in 2005:
Average Adjusted Gross Income (AGI) in 2004: $39,696 (Individual Income Tax Returns)
Here:
$39,696
State:
$59,519
Salary/wage: $37,336 (reported on 86.7% of returns)
Here:
$37,336
State:
$50,673
(% of AGI for various income ranges: 125.6% for AGIs below $10k, 71.1% for AGIs $10k-25k, 76.3% for AGIs $25k-50k, 85.4% for AGIs $50k-75k, 85.4% for AGIs $75k-100k, 80.5% for AGIs over 100k)
Taxable interest for individuals: $724 (reported on 60.7% of returns)
This zip code:
$724
New York:
$2,377
(% of AGI for various income ranges: 3.8% for AGIs below $10k, 2.1% for AGIs $10k-25k, 1.0% for AGIs $25k-50k, 1.0% for AGIs $50k-75k, 0.4% for AGIs $75k-100k, 1.4% for AGIs over 100k)
Taxable dividends: $914 (reported on 28.3% of returns)
Here:
$914
State:
$5,394
(% of AGI for various income ranges: 2.7% for AGIs below $10k, 1.0% for AGIs $10k-25k, 0.8% for AGIs $25k-50k, 0.4% for AGIs $50k-75k, 0.3% for AGIs $75k-100k, 0.8% for AGIs over 100k)
Net capital gain/loss: +$979 (reported on 16.8% of returns)
Here:
+$979
State:
+$23,581
(% of AGI for various income ranges: -1.5% for AGIs below $10k, -0.1% for AGIs $10k-25k, 0.3% for AGIs $25k-50k, 0.2% for AGIs $50k-75k, 0.5% for AGIs $75k-100k, 1.1% for AGIs over 100k)
Profit/loss from business: +$6,293 (reported on 9.6% of returns)
Here:
+$6,293
State:
+$13,809
(% of AGI for various income ranges: 3.6% for AGIs below $10k, 2.9% for AGIs $10k-25k, 2.1% for AGIs $25k-50k, 1.3% for AGIs $50k-75k, 0.9% for AGIs $75k-100k, 0.7% for AGIs over 100k)
IRA payment deduction: $3,061 (reported on 3.3% of returns)
14131:
$3,061
New York:
$3,115
(% of AGI for various income ranges: 0.4% for AGIs $10k-25k, 0.4% for AGIs $25k-50k, 0.3% for AGIs $50k-75k, 0.2% for AGIs $75k-100k)
Total itemized deductions: $14,976 (21% of AGI, reported on 31.9% of returns)
Here:
$14,976
State:
$25,864
Here:
21.2% of AGI
State:
21.9% of AGI
(% of AGI for various income ranges: 6.2% for AGIs $10k-25k, 9.6% for AGIs $25k-50k, 13.1% for AGIs $50k-75k, 14.6% for AGIs $75k-100k, 15.3% for AGIs over 100k)
Charity contributions deductions: $1,907 (3% of AGI, reported on 29.4% of returns)
Here:
$1,907
State:
$4,439
Here:
2.6% of AGI
State:
3.6% of AGI
(% of AGI for various income ranges: 0.6% for AGIs $10k-25k, 1.1% for AGIs $25k-50k, 1.5% for AGIs $50k-75k, 2.0% for AGIs $75k-100k, 1.8% for AGIs over 100k)
Total tax: $4,633 (reported on 76.2% of returns)
14131:
$4,633
State:
$11,730
(% of AGI for various income ranges: 3.5% for AGIs below $10k, 4.1% for AGIs $10k-25k, 6.6% for AGIs $25k-50k, 8.1% for AGIs $50k-75k, 10.1% for AGIs $75k-100k, 14.9% for AGIs over 100k)
Earned income credit: $1,565 (reported on 12.2% of returns)
Here:
$1,565
State:
$1,757
Percentage of individuals using paid preparers for their 2004 taxes: 62.3%
Here:
62%
State:
67%
(% for various income ranges: 49.0% for AGIs below $10k, 62.3% for AGIs $10k-25k, 65.5% for AGIs $25k-50k, 67.1% for AGIs $50k-75k, 67.3% for AGIs $75k-100k, 70.6% for AGIs over 100k)
Household received Food Stamps/SNAP in the past 12 months: 127 Household did not receive Food Stamps/SNAP in the past 12 months: 1,970
Women who had a birth in the past 12 months: 20 (20 now married, 0 unmarried) Women who did not have a birth in the past 12 months: 825 (387 now married, 433 unmarried)
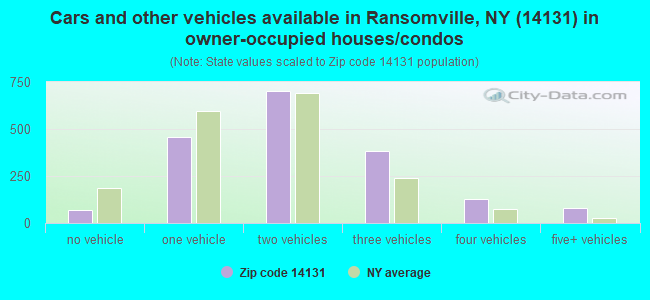
Housing units in zip code 14131 with a mortgage: 879 (79 second mortgage, 14 home equity loan, 67 both second mortgage and home equity loan) Houses without a mortgage: 23
Median monthly owner costs for units with a mortgage: $1,511 Median monthly owner costs for units without a mortgage: $684
Residents with income below the poverty level in 2022:
This zip code:
6.6%
Whole state:
14.3%
Residents with income below 50% of the poverty level in 2022:
This zip code:
5.6%
Whole state:
6.8%
Median number of rooms in houses and condos:
Here:
6.5
State:
6.3
Median number of rooms in apartments:
Here:
5.4
State:
3.8
Notable locations in this zip code not listed on our city pages
Notable locations in zip code 14131: Niagara Woodland Campground (A), Baker Farms (B), Hurtgam Farms (C), Koeppen Farms (D), Camp Stonehaven (E), Ransomville Fire Company (F), Ransomville Free Library (G), Heritage Manor of Ransomville (H). Display/hide their locations on the map
Churches in zip code 14131 include: Filmore Chapel (A), Baptist Church of Ransomville (B), Dickersonville United Methodist Church (C), Immaculate Conception Church (D), Ransomville Free Methodist Church (E), Ransomville United Methodist Church (F). Display/hide their locations on the map
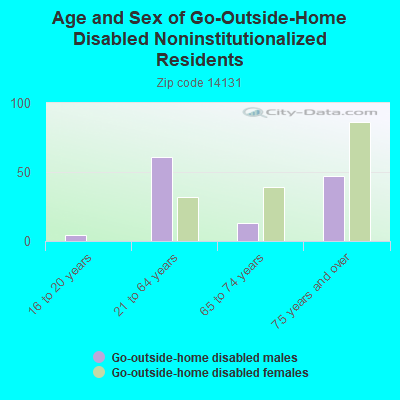
In group quarters: 62 (-1 institutionalized population)
Size of family households: 800 2-persons, 340 3-persons, 217 4-persons, 136 5-persons, 17 6-persons, 14 7-or-more-persons
Size of nonfamily households: 504 1-person, 86 2-persons
544 married couples with children.
178 single-parent households (178 women).
97.8% of residents of 14131 zip code speak English at home.
1.6% of residents speak Spanish at home (68% very well, 5% well, 28% not well).
0.3% of residents speak other Indo-European language at home (100% very well).
0.2% of residents speak Asian or Pacific Island language at home (100% well).
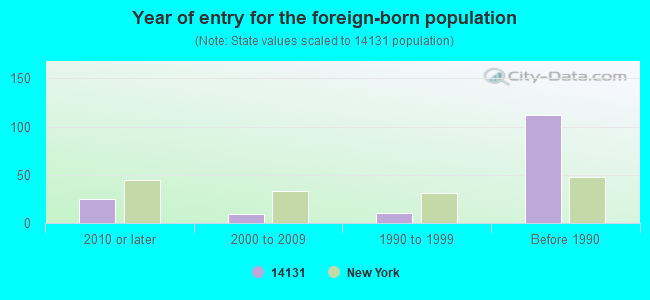
Foreign born population: 103 (2.0%) (64.7% of them are naturalized citizens)
This zip code:
2.0%
Whole state:
22.7%
41%Sweden
25%United Kingdom, excluding England and Scotland
10%France
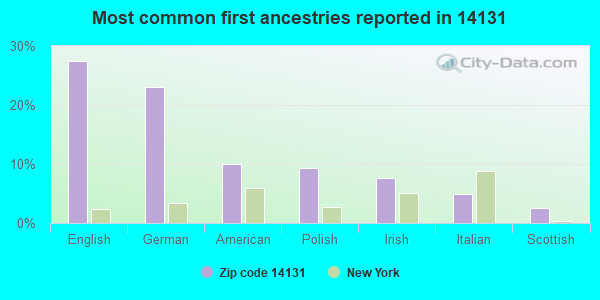
27%English
23%German
10%American
9%Polish
8%Irish
5%Italian
3%Scottish
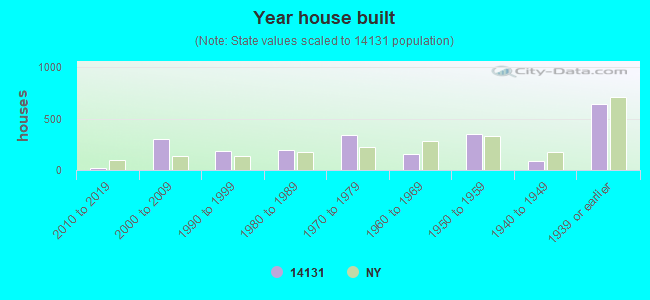
Year of entry for the foreign-born population
252010 or later
92000 to 2009
101990 to 1999
112Before 1990
Facilities with environmental interests located in this zip code:
A G FARM SUPPLY (3678 RANSOMVILLE RD in RANSOMVILLE, NY)
(Resource Conservation and Recovery Act (tracking hazardous waste))
Housing units lacking complete plumbing facilities: 1.4% Housing units lacking complete kitchen facilities: 3.0%
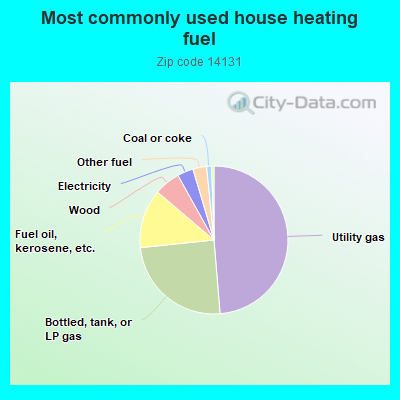
48.8%Utility gas
24.7%Bottled, tank, or LP gas
12.9%Fuel oil, kerosene, etc.
5.7%Wood
3.5%Electricity
3.0%Other fuel
1.1%Coal or coke
0.5%No fuel used
Population in 1990: 5,836.
Place of birth for U.S.-born residents:
This state: 4,453
Northeast: 87
Midwest: 10
South: 277
West: 91
79% of the 14131 zip code residents lived in the same house 5 years ago. Out of people who lived in different houses, 83% lived in this county. Out of people who lived in different counties, 50% lived in New York.
99% of the 14131 zip code residents lived in the same house 1 year ago. Out of people who lived in different houses, 35% moved from this county. Out of people who lived in different houses, 43% moved from different county within same state.
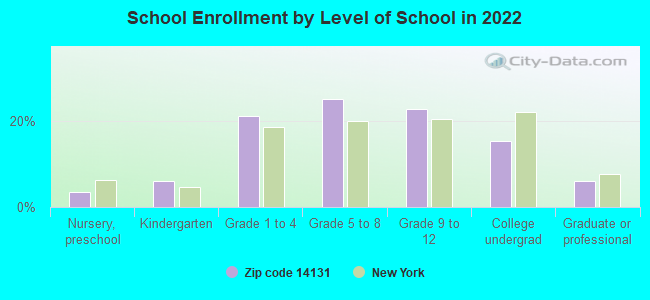
Private vs. public school enrollment:
Students in private schools in grades 1 to 8 (elementary and middle school): 12
Here:
3.0%
New York:
15.6%
Students in private schools in grades 9 to 12 (high school): 33
Here:
16.7%
New York:
15.0%
Students in private undergraduate colleges: 23
Here:
17.3%
New York:
39.2%
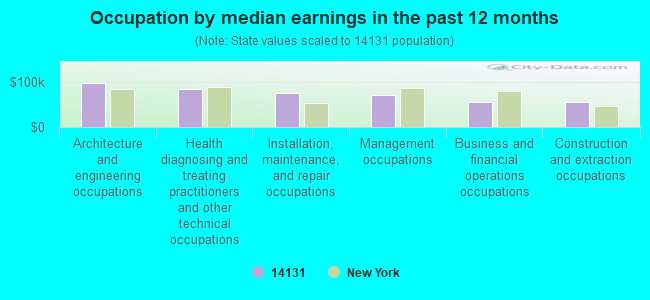
Occupation by median earnings in the past 12 months ($)
97,649Architecture and engineering occupations
84,912Health diagnosing and treating practitioners and other technical occupations
76,252Installation, maintenance, and repair occupations
70,247Management occupations
55,972Business and financial operations occupations
54,469Construction and extraction occupations
Top industries in this zip code by the number of employees in 2005:
Administrative and Support and Waste Management and Remediation Services: Office Administrative Services (50-99 employees: 1 establishment)
Professional, Scientific, and Technical Services: Administrative Management and General Management Consulting Services (50-99: 1)
Accommodation and Food Services: Snack and Nonalcoholic Beverage Bars (20-49: 1)
Wholesale Trade: Other Miscellaneous Nondurable Goods Merchant Wholesalers (20-49: 1)
Health Care and Social Assistance: Nursing Care Facilities (20-49: 1)
Other Services (except Public Administration): Religious Organizations (10-19: 1, 5-9: 1, 1-4: 1)
Administrative and Support and Waste Management and Remediation Services: Landscaping Services (5-9: 2, 1-4: 3)
People in group quarters in 2010:
6 people in group homes intended for adults
People in group quarters in 2000:
113 people in agriculture workers' dormitories on farms
10 people in other group homes
Fatal accident statistics in 2011:
Fatal accident count: 1
Vehicles involved in fatal accidents: 2
Fatal accidents caused by drunken drivers: 0
Fatalities: 1
Persons involved in fatal accidents: 2
Pedestrians involved in fatal accidents: 0
Fatal accident statistics in 2010:
Fatal accident count: 1
Vehicles involved in fatal accidents: 1
Fatal accidents caused by drunken drivers: 0
Fatalities: 2
Persons involved in fatal accidents: 5
Pedestrians involved in fatal accidents: 0
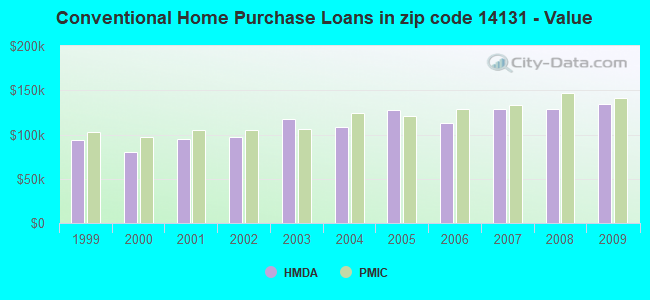
Home Mortgage Disclosure Act Aggregated Statistics For Year 2009 (Based on 8 partial tracts)
A) FHA, FSA/RHS & VA Home Purchase Loans
B) Conventional Home Purchase Loans
C) Refinancings
D) Home Improvement Loans
E) Loans on Dwellings For 5+ Families
F) Non-occupant Loans on < 5 Family Dwellings (A B C & D)
G) Loans On Manufactured Home Dwelling (A B C & D)
Number
Average Value
Number
Average Value
Number
Average Value
Number
Average Value
Number
Average Value
Number
Average Value
Number
Average Value
LOANS ORIGINATED
41
$129,488
48
$134,465
137
$130,412
11
$47,779
1
$113,210
6
$125,297
1
$99,320
APPLICATIONS APPROVED, NOT ACCEPTED
1
$127,000
3
$256,310
19
$125,499
2
$11,570
0
$0
1
$108,350
0
$0
APPLICATIONS DENIED
9
$132,449
10
$85,891
58
$147,799
12
$29,961
0
$0
5
$80,852
2
$33,900
APPLICATIONS WITHDRAWN
2
$105,225
8
$133,756
45
$130,074
1
$58,510
0
$0
1
$312,650
0
$0
FILES CLOSED FOR INCOMPLETENESS
0
$0
0
$0
9
$143,873
2
$45,020
0
$0
0
$0
0
$0
Aggregated Statistics For Year 2008 (Based on 8 partial tracts)
A) FHA, FSA/RHS & VA Home Purchase Loans
B) Conventional Home Purchase Loans
C) Refinancings
D) Home Improvement Loans
F) Non-occupant Loans on < 5 Family Dwellings (A B C & D)
G) Loans On Manufactured Home Dwelling (A B C & D)
Number
Average Value
Number
Average Value
Number
Average Value
Number
Average Value
Number
Average Value
Number
Average Value
LOANS ORIGINATED
32
$125,398
77
$129,371
70
$137,876
15
$56,750
17
$120,071
1
$43,880
APPLICATIONS APPROVED, NOT ACCEPTED
1
$63,850
5
$180,606
13
$134,324
4
$12,425
3
$87,030
0
$0
APPLICATIONS DENIED
9
$140,549
10
$125,279
76
$123,297
27
$28,545
4
$93,902
5
$42,498
APPLICATIONS WITHDRAWN
1
$61,250
2
$249,695
29
$131,949
3
$111,937
0
$0
1
$22,290
FILES CLOSED FOR INCOMPLETENESS
1
$117,470
3
$147,533
10
$146,968
1
$81,620
2
$82,065
0
$0
Aggregated Statistics For Year 2007 (Based on 8 partial tracts)
A) FHA, FSA/RHS & VA Home Purchase Loans
B) Conventional Home Purchase Loans
C) Refinancings
D) Home Improvement Loans
E) Loans on Dwellings For 5+ Families
F) Non-occupant Loans on < 5 Family Dwellings (A B C & D)
G) Loans On Manufactured Home Dwelling (A B C & D)
Number
Average Value
Number
Average Value
Number
Average Value
Number
Average Value
Number
Average Value
Number
Average Value
Number
Average Value
LOANS ORIGINATED
23
$114,695
95
$129,153
97
$94,305
32
$46,297
2
$231,070
13
$114,552
0
$0
APPLICATIONS APPROVED, NOT ACCEPTED
0
$0
8
$161,802
19
$87,657
8
$40,741
0
$0
2
$160,765
1
$25,340
APPLICATIONS DENIED
1
$37,350
14
$78,704
91
$108,381
31
$44,313
0
$0
5
$134,266
2
$35,365
APPLICATIONS WITHDRAWN
4
$119,158
3
$187,150
68
$123,558
3
$83,993
0
$0
2
$116,660
0
$0
FILES CLOSED FOR INCOMPLETENESS
0
$0
5
$160,722
10
$128,396
1
$156,840
0
$0
0
$0
0
$0
Aggregated Statistics For Year 2006 (Based on 8 partial tracts)
A) FHA, FSA/RHS & VA Home Purchase Loans
B) Conventional Home Purchase Loans
C) Refinancings
D) Home Improvement Loans
E) Loans on Dwellings For 5+ Families
F) Non-occupant Loans on < 5 Family Dwellings (A B C & D)
G) Loans On Manufactured Home Dwelling (A B C & D)
Number
Average Value
Number
Average Value
Number
Average Value
Number
Average Value
Number
Average Value
Number
Average Value
Number
Average Value
LOANS ORIGINATED
18
$126,038
109
$113,169
130
$100,852
52
$32,698
0
$0
25
$102,986
2
$23,695
APPLICATIONS APPROVED, NOT ACCEPTED
0
$0
14
$106,941
31
$91,491
6
$33,752
0
$0
2
$103,685
1
$54,220
APPLICATIONS DENIED
1
$76,680
29
$73,238
127
$107,073
47
$36,747
0
$0
5
$90,160
6
$29,683
APPLICATIONS WITHDRAWN
0
$0
17
$81,292
90
$106,136
11
$65,078
0
$0
4
$55,062
1
$60,240
FILES CLOSED FOR INCOMPLETENESS
1
$167,400
5
$104,374
27
$128,752
4
$75,462
1
$42,170
1
$53,010
0
$0
Aggregated Statistics For Year 2005 (Based on 8 partial tracts)
A) FHA, FSA/RHS & VA Home Purchase Loans
B) Conventional Home Purchase Loans
C) Refinancings
D) Home Improvement Loans
F) Non-occupant Loans on < 5 Family Dwellings (A B C & D)
G) Loans On Manufactured Home Dwelling (A B C & D)
Number
Average Value
Number
Average Value
Number
Average Value
Number
Average Value
Number
Average Value
Number
Average Value
LOANS ORIGINATED
23
$114,806
134
$127,402
164
$102,658
35
$40,633
17
$152,915
0
$0
APPLICATIONS APPROVED, NOT ACCEPTED
2
$107,430
8
$102,281
28
$83,939
16
$29,783
1
$25,850
1
$3,950
APPLICATIONS DENIED
0
$0
24
$89,856
123
$100,733
29
$45,412
8
$49,564
1
$113,250
APPLICATIONS WITHDRAWN
1
$87,460
7
$139,314
98
$109,078
14
$73,040
5
$64,378
2
$65,820
FILES CLOSED FOR INCOMPLETENESS
0
$0
7
$133,716
28
$112,913
2
$63,830
1
$79,770
0
$0
Aggregated Statistics For Year 2004 (Based on 8 partial tracts)
A) FHA, FSA/RHS & VA Home Purchase Loans
B) Conventional Home Purchase Loans
C) Refinancings
D) Home Improvement Loans
F) Non-occupant Loans on < 5 Family Dwellings (A B C & D)
G) Loans On Manufactured Home Dwelling (A B C & D)
Number
Average Value
Number
Average Value
Number
Average Value
Number
Average Value
Number
Average Value
Number
Average Value
LOANS ORIGINATED
20
$112,499
98
$108,287
143
$96,911
30
$34,009
20
$94,092
1
$61,300
APPLICATIONS APPROVED, NOT ACCEPTED
0
$0
7
$112,010
49
$93,619
12
$33,495
1
$68,460
1
$32,710
APPLICATIONS DENIED
4
$78,592
14
$94,359
105
$95,397
42
$34,319
5
$89,516
5
$46,358
APPLICATIONS WITHDRAWN
1
$156,470
11
$115,855
86
$100,635
11
$55,113
3
$83,583
0
$0
FILES CLOSED FOR INCOMPLETENESS
1
$69,880
8
$90,140
21
$101,842
2
$56,905
0
$0
0
$0
Aggregated Statistics For Year 2003 (Based on 8 partial tracts)
A) FHA, FSA/RHS & VA Home Purchase Loans
B) Conventional Home Purchase Loans
C) Refinancings
D) Home Improvement Loans
E) Loans on Dwellings For 5+ Families
F) Non-occupant Loans on < 5 Family Dwellings (A B C & D)
Number
Average Value
Number
Average Value
Number
Average Value
Number
Average Value
Number
Average Value
Number
Average Value
LOANS ORIGINATED
29
$94,546
118
$117,828
301
$95,514
28
$28,773
2
$1,519,140
19
$87,369
APPLICATIONS APPROVED, NOT ACCEPTED
1
$120,910
9
$149,576
45
$96,913
3
$31,113
0
$0
1
$39,490
APPLICATIONS DENIED
1
$83,830
16
$78,732
119
$98,131
20
$20,103
0
$0
3
$58,960
APPLICATIONS WITHDRAWN
1
$44,160
6
$156,780
64
$98,572
3
$33,887
0
$0
1
$273,810
FILES CLOSED FOR INCOMPLETENESS
1
$84,250
2
$154,025
13
$111,622
1
$21,940
0
$0
1
$92,690
Aggregated Statistics For Year 2002 (Based on 6 partial tracts)
A) FHA, FSA/RHS & VA Home Purchase Loans
B) Conventional Home Purchase Loans
C) Refinancings
D) Home Improvement Loans
F) Non-occupant Loans on < 5 Family Dwellings (A B C & D)
Number
Average Value
Number
Average Value
Number
Average Value
Number
Average Value
Number
Average Value
LOANS ORIGINATED
17
$89,139
70
$96,804
141
$79,066
11
$14,754
9
$75,334
APPLICATIONS APPROVED, NOT ACCEPTED
0
$0
8
$150,529
35
$78,287
7
$25,851
1
$17,550
APPLICATIONS DENIED
2
$92,800
11
$72,020
79
$83,298
12
$22,125
3
$85,593
APPLICATIONS WITHDRAWN
1
$96,640
3
$94,777
69
$88,157
1
$41,070
1
$36,750
FILES CLOSED FOR INCOMPLETENESS
0
$0
1
$34,940
11
$85,859
0
$0
2
$53,535
Aggregated Statistics For Year 2001 (Based on 6 partial tracts)
A) FHA, FSA/RHS & VA Home Purchase Loans
B) Conventional Home Purchase Loans
C) Refinancings
D) Home Improvement Loans
F) Non-occupant Loans on < 5 Family Dwellings (A B C & D)
Number
Average Value
Number
Average Value
Number
Average Value
Number
Average Value
Number
Average Value
LOANS ORIGINATED
15
$89,736
73
$95,401
114
$86,816
25
$17,924
5
$50,436
APPLICATIONS APPROVED, NOT ACCEPTED
1
$71,090
7
$71,803
24
$67,247
9
$30,862
2
$93,010
APPLICATIONS DENIED
2
$79,520
15
$97,516
99
$74,001
17
$21,632
4
$88,712
APPLICATIONS WITHDRAWN
1
$39,160
5
$95,746
61
$76,727
5
$14,064
0
$0
FILES CLOSED FOR INCOMPLETENESS
0
$0
0
$0
8
$66,794
1
$18,430
0
$0
Aggregated Statistics For Year 2000 (Based on 6 partial tracts)
A) FHA, FSA/RHS & VA Home Purchase Loans
B) Conventional Home Purchase Loans
C) Refinancings
D) Home Improvement Loans
F) Non-occupant Loans on < 5 Family Dwellings (A B C & D)
Number
Average Value
Number
Average Value
Number
Average Value
Number
Average Value
Number
Average Value
LOANS ORIGINATED
11
$78,611
65
$80,695
58
$70,004
21
$14,270
4
$41,765
APPLICATIONS APPROVED, NOT ACCEPTED
1
$68,670
8
$53,062
16
$68,311
5
$17,222
1
$72,890
APPLICATIONS DENIED
2
$77,670
20
$40,550
74
$68,785
19
$20,688
3
$27,763
APPLICATIONS WITHDRAWN
1
$119,300
3
$95,537
25
$62,818
3
$16,917
1
$34,340
FILES CLOSED FOR INCOMPLETENESS
1
$61,430
2
$254,560
3
$56,937
0
$0
1
$30,120
Aggregated Statistics For Year 1999 (Based on 4 partial tracts)
A) FHA, FSA/RHS & VA Home Purchase Loans
B) Conventional Home Purchase Loans
C) Refinancings
D) Home Improvement Loans
F) Non-occupant Loans on < 5 Family Dwellings (A B C & D)

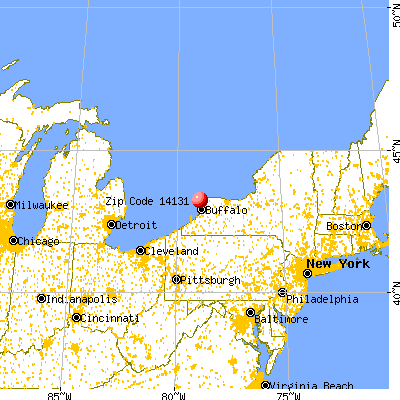


 Nearest zip codes: 14132, 14172, 14174, 14092, 14304, 14109.