Estimated zip code population in 2022: 6,248 Zip code population in 2010: 6,048 Zip code population in 2000: 5,874
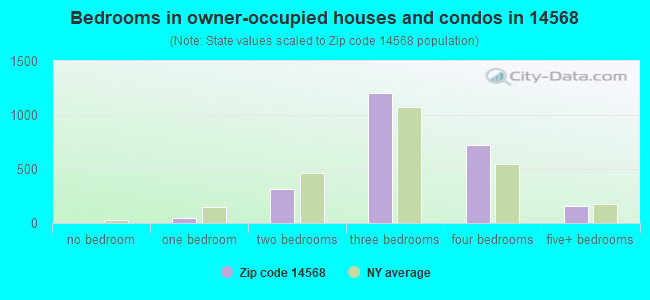
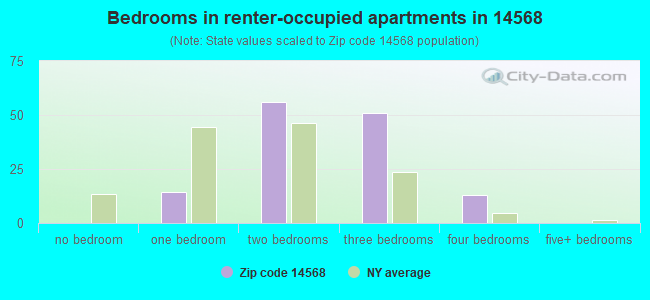
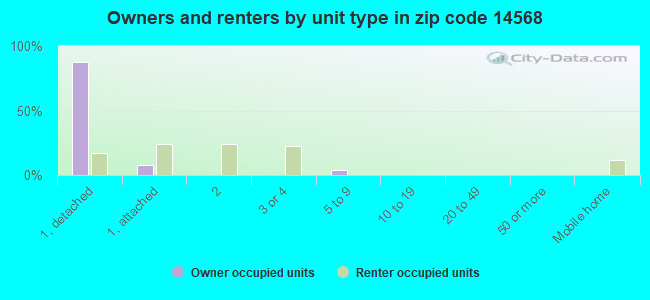
Houses and condos: 2,605 Renter-occupied apartments: 135
% of renters here:
5%
State:
46%
March 2022 cost of living index in zip code 14568: 100.8 (near average, U.S. average is 100)
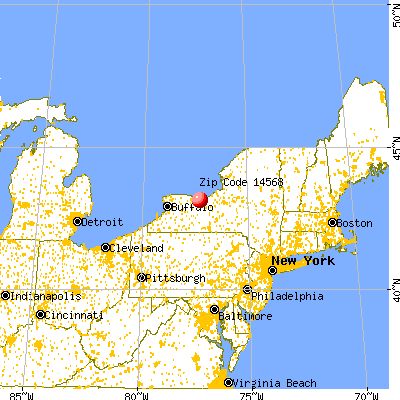
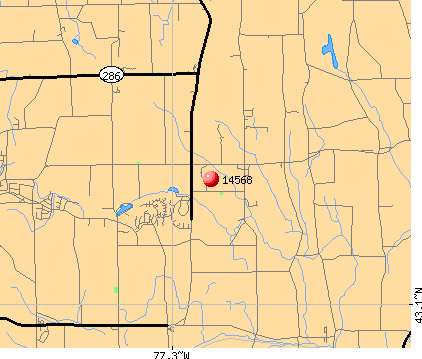
Land area: 23.7 sq. mi. Water area: 0.0 sq. mi.
Population density: 263 people per square mile
(very low).
OSM Map
General Map
Google Map
MSN Map
OSM Map
General Map
Google Map
MSN Map
OSM Map
General Map
Google Map
MSN Map
OSM Map
General Map
Google Map
MSN Map
Please wait while loading the map...
Real estate property taxes paid for housing units in 2022:
This zip code:
2.8% ($4,923)
New York:
1.5% ($6,180)
Median real estate property taxes paid for housing units with mortgages in 2022: $5,015 (2.8%) Median real estate property taxes paid for housing units with no mortgage in 2022: $4,765 (2.8%)
Business Search- 14 Million verified businesses
Males: 3,036
(48.6%)
Females: 3,211
(51.4%)
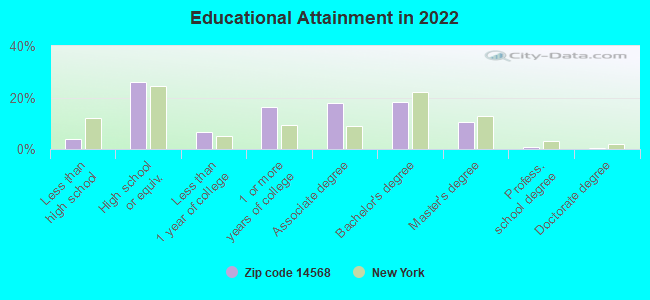
For population 25 years and over in 14568:
High school or higher: 95.8%
Bachelor's degree or higher: 29.4%
Graduate or professional degree: 11.3%
Unemployed: 1.5%
Mean travel time to work (commute): 27.3 minutes
For population 15 years and over in 14568:
Never married: 21.3%
Now married: 57.8%
Separated: 0.6%
Widowed: 4.4%
Divorced: 16.0%
Zip code 14568 compared to state average:
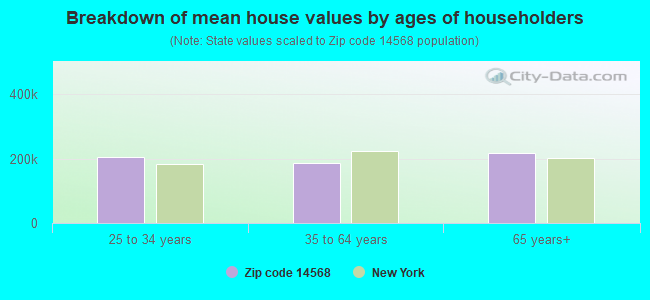
Median house value significantly below state average.
Unemployed percentage significantly below state average.
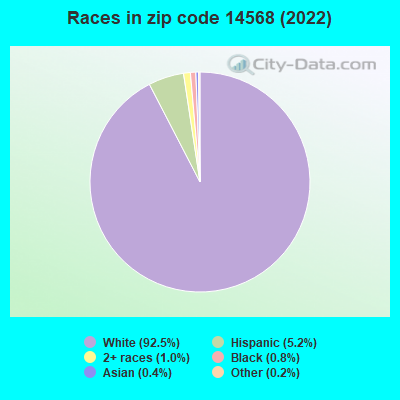
Black race population percentage significantly below state average.
Hispanic race population percentage significantly below state average.
Median age above state average.
Foreign-born population percentage significantly below state average.
Renting percentage significantly below state average.
Length of stay since moving in significantly above state average.
Estimated median house/condo value in 2022: $177,423
14568:
$177,423
New York:
$400,400
According to our research of New York and other state lists, there were 4 registered sex offenders living in 14568 zip code as of June 15, 2024. The ratio of all residents to sex offenders in zip code 14568 is 1,543 to 1. The ratio of registered sex offenders to all residents in this zip code is lower than the state average.
Median resident age:
This zip code:
46.2 years
New York median age:
40.0 years
Average household size:
This zip code:
2.4 people
New York:
2.5 people
Averages for the 2020 tax year for zip code 14568, filed in 2021:
Average Adjusted Gross Income (AGI) in 2020: $68,555 (Individual Income Tax Returns)
Here:
$68,555
State:
$90,930
Salary/wage: $61,244 (reported on 82.1% of returns)
Here:
$61,244
State:
$72,104
(% of AGI for various income ranges: 1057.6% for AGIs below $25k, 3486.6% for AGIs $25k-50k, 6304.1% for AGIs $50k-75k, 8786.8% for AGIs $75k-100k, 16130.5% for AGIs $100k-200k, 56016.7% for AGIs over 200k)
Taxable interest for individuals: $477 (reported on 49.5% of returns)
This zip code:
$477
New York:
$3,075
(% of AGI for various income ranges: 19.0% for AGIs below $25k, 18.1% for AGIs $25k-50k, 18.7% for AGIs $50k-75k, 42.6% for AGIs $75k-100k, 69.5% for AGIs $100k-200k, 206.7% for AGIs over 200k)
Ordinary dividends: $2,604 (reported on 22.7% of returns)
Here:
$2,604
State:
$11,095
(% of AGI for various income ranges: 17.8% for AGIs below $25k, 31.5% for AGIs $25k-50k, 57.4% for AGIs $50k-75k, 135.8% for AGIs $75k-100k, 189.2% for AGIs $100k-200k, 636.7% for AGIs over 200k)
Net capital gain/loss in AGI: +$5,603 (reported on 18.5% of returns)
Here:
+$5,603
State:
+$44,925
(% of AGI for various income ranges: 23.4% for AGIs below $25k, 29.5% for AGIs $25k-50k, 40.3% for AGIs $50k-75k, 133.2% for AGIs $75k-100k, 409.7% for AGIs $100k-200k, 2636.7% for AGIs over 200k)
Profit/loss from business: +$7,962 (reported on 12.5% of returns)
Here:
+$7,962
State:
+$14,940
(% of AGI for various income ranges: 75.4% for AGIs below $25k, 106.9% for AGIs $25k-50k, 81.8% for AGIs $50k-75k, 208.7% for AGIs $75k-100k, 290.0% for AGIs $100k-200k)
Taxable individual retirement arrangement distribution: $24,517 (reported on 15.3% of returns)
14568:
$24,517
New York:
$19,609
(% of AGI for various income ranges: 144.0% for AGIs below $25k, 214.1% for AGIs $25k-50k, 373.8% for AGIs $50k-75k, 688.1% for AGIs $75k-100k, 1086.7% for AGIs $100k-200k, 6520.0% for AGIs over 200k)
Total itemized deductions: $25,476 (reported on 6.7% of returns)
Here:
$25,476
State:
$39,326
(% of AGI for various income ranges: 194.2% for AGIs $25k-50k, 242.1% for AGIs $50k-75k, 240.6% for AGIs $75k-100k, 644.6% for AGIs $100k-200k)
Charity contributions: $7,129 (reported on 4.5% of returns)
Here:
$7,129
State:
$15,420
(% of AGI for various income ranges: 10.8% for AGIs $25k-50k, 18.7% for AGIs $50k-75k, 29.7% for AGIs $75k-100k, 197.2% for AGIs $100k-200k)
Taxes paid: $8,205 (reported on 6.7% of returns)
14568:
$8,205
State:
$9,183
(% of AGI for various income ranges: 40.8% for AGIs $25k-50k, 121.8% for AGIs $50k-75k, 99.0% for AGIs $75k-100k, 179.5% for AGIs $100k-200k)
Earned income credit: $1,777 (reported on 7.0% of returns)
Here:
$1,777
State:
$2,138
(% of AGI for various income ranges: 43.6% for AGIs below $25k, 29.3% for AGIs $25k-50k)
Percentage of individuals using paid preparers for their 2020 taxes: 96.2%
Here:
96%
State:
95%
(% for various income ranges: 94.4% for AGIs below $25k, 95.9% for AGIs $25k-50k, 98.1% for AGIs $50k-75k, 95.5% for AGIs $75k-100k, 96.8% for AGIs $100k-200k, 100.0% for AGIs over 200k)
Averages for the 2012 tax year for zip code 14568, filed in 2013:
Average Adjusted Gross Income (AGI) in 2012: $57,185 (Individual Income Tax Returns)
Here:
$57,185
State:
$77,088
Salary/wage: $51,186 (reported on 88.0% of returns)
Here:
$51,186
State:
$60,593
(% of AGI for various income ranges: 75.1% for AGIs below $25k, 80.4% for AGIs $25k-50k, 79.7% for AGIs $50k-75k, 84.2% for AGIs $75k-100k, 79.5% for AGIs $100k-200k, 57.0% for AGIs over 200k)
Taxable interest for individuals: $434 (reported on 51.8% of returns)
This zip code:
$434
New York:
$3,125
(% of AGI for various income ranges: 1.2% for AGIs below $25k, 0.4% for AGIs $25k-50k, 0.3% for AGIs $50k-75k, 0.4% for AGIs $75k-100k, 0.3% for AGIs $100k-200k, 0.6% for AGIs over 200k)
Ordinary dividends: $2,035 (reported on 24.7% of returns)
Here:
$2,035
State:
$10,299
(% of AGI for various income ranges: 1.8% for AGIs below $25k, 0.8% for AGIs $25k-50k, 1.0% for AGIs $50k-75k, 0.7% for AGIs $75k-100k, 0.7% for AGIs $100k-200k, 1.2% for AGIs over 200k)
Net capital gain/loss in AGI: +$2,068 (reported on 15.7% of returns)
Here:
+$2,068
State:
+$42,474
(% of AGI for various income ranges: 0.4% for AGIs below $25k, 0.4% for AGIs $25k-50k, 0.4% for AGIs $75k-100k, 0.6% for AGIs $100k-200k, 2.9% for AGIs over 200k)
Profit/loss from business: +$7,419 (reported on 12.0% of returns)
Here:
+$7,419
State:
+$16,168
(% of AGI for various income ranges: 7.0% for AGIs below $25k, 2.2% for AGIs $25k-50k, 1.7% for AGIs $50k-75k, 0.4% for AGIs $75k-100k, 1.3% for AGIs $100k-200k)
Taxable individual retirement arrangement distribution: $19,829 (reported on 12.7% of returns)
14568:
$19,829
New York:
$17,621
(% of AGI for various income ranges: 5.5% for AGIs below $25k, 5.5% for AGIs $25k-50k, 4.9% for AGIs $50k-75k, 4.0% for AGIs $75k-100k, 4.7% for AGIs $100k-200k)
Total itemized deductions: $19,865 (22% of AGI, reported on 43.5% of returns)
Here:
$19,865
State:
$34,985
Here:
22.1% of AGI
State:
21.3% of AGI
(% of AGI for various income ranges: 14.9% for AGIs below $25k, 12.0% for AGIs $25k-50k, 15.1% for AGIs $50k-75k, 14.2% for AGIs $75k-100k, 17.3% for AGIs $100k-200k, 13.7% for AGIs over 200k)
Charity contributions: $2,253 (reported on 36.5% of returns)
Here:
$2,253
State:
$5,572
(% of AGI for various income ranges: 0.8% for AGIs below $25k, 0.9% for AGIs $25k-50k, 1.4% for AGIs $50k-75k, 1.6% for AGIs $75k-100k, 1.7% for AGIs $100k-200k, 1.3% for AGIs over 200k)
Taxes paid: $9,542 (reported on 43.5% of returns)
14568:
$9,542
State:
$18,656
(% of AGI for various income ranges: 3.8% for AGIs below $25k, 5.1% for AGIs $25k-50k, 6.7% for AGIs $50k-75k, 7.2% for AGIs $75k-100k, 8.8% for AGIs $100k-200k, 8.6% for AGIs over 200k)
Earned income credit: $1,900 (reported on 9.0% of returns)
Here:
$1,900
State:
$2,230
(% of AGI for various income ranges: 3.2% for AGIs below $25k, 0.8% for AGIs $25k-50k)
Percentage of individuals using paid preparers for their 2012 taxes: 52.5%
Here:
53%
State:
66%
(% for various income ranges: 46.8% for AGIs below $25k, 50.0% for AGIs $25k-50k, 56.9% for AGIs $50k-75k, 56.1% for AGIs $75k-100k, 57.8% for AGIs $100k-200k, 75.0% for AGIs over 200k)
Averages for the 2004 tax year for zip code 14568, filed in 2005:
Average Adjusted Gross Income (AGI) in 2004: $48,939 (Individual Income Tax Returns)
Here:
$48,939
State:
$59,519
Salary/wage: $45,946 (reported on 90.4% of returns)
Here:
$45,946
State:
$50,673
(% of AGI for various income ranges: 93.8% for AGIs below $10k, 74.4% for AGIs $10k-25k, 84.4% for AGIs $25k-50k, 85.8% for AGIs $50k-75k, 89.2% for AGIs $75k-100k, 81.9% for AGIs over 100k)
Taxable interest for individuals: $585 (reported on 66.5% of returns)
This zip code:
$585
New York:
$2,377
(% of AGI for various income ranges: 3.9% for AGIs below $10k, 2.0% for AGIs $10k-25k, 0.9% for AGIs $25k-50k, 0.7% for AGIs $50k-75k, 0.3% for AGIs $75k-100k, 0.8% for AGIs over 100k)
Taxable dividends: $975 (reported on 31.7% of returns)
Here:
$975
State:
$5,394
(% of AGI for various income ranges: 4.2% for AGIs below $10k, 1.7% for AGIs $10k-25k, 0.5% for AGIs $25k-50k, 0.5% for AGIs $50k-75k, 0.4% for AGIs $75k-100k, 0.6% for AGIs over 100k)
Net capital gain/loss: +$1,682 (reported on 20.7% of returns)
Here:
+$1,682
State:
+$23,581
(% of AGI for various income ranges: -0.8% for AGIs below $10k, 1.3% for AGIs $10k-25k, 0.5% for AGIs $25k-50k, 0.0% for AGIs $50k-75k, 0.4% for AGIs $75k-100k, 1.8% for AGIs over 100k)
Profit/loss from business: +$6,855 (reported on 15.7% of returns)
Here:
+$6,855
State:
+$13,809
(% of AGI for various income ranges: 3.0% for AGIs below $10k, 7.3% for AGIs $10k-25k, 2.6% for AGIs $25k-50k, 2.5% for AGIs $50k-75k, 1.4% for AGIs $75k-100k, 1.4% for AGIs over 100k)
IRA payment deduction: $2,877 (reported on 2.3% of returns)
14568:
$2,877
New York:
$3,115
Self-employed pension: $6,062 (reported on 0.6% of returns)
Here:
$6,062
New York:
$19,016
Total itemized deductions: $15,717 (22% of AGI, reported on 52.3% of returns)
Here:
$15,717
State:
$25,864
Here:
21.6% of AGI
State:
21.9% of AGI
(% of AGI for various income ranges: 13.5% for AGIs below $10k, 13.9% for AGIs $10k-25k, 16.3% for AGIs $25k-50k, 18.0% for AGIs $50k-75k, 17.8% for AGIs $75k-100k, 15.9% for AGIs over 100k)
Charity contributions deductions: $1,926 (3% of AGI, reported on 48.5% of returns)
Here:
$1,926
State:
$4,439
Here:
2.6% of AGI
State:
3.6% of AGI
(% of AGI for various income ranges: 1.0% for AGIs below $10k, 1.3% for AGIs $10k-25k, 1.8% for AGIs $25k-50k, 2.0% for AGIs $50k-75k, 1.9% for AGIs $75k-100k, 2.0% for AGIs over 100k)
Total tax: $5,848 (reported on 80.7% of returns)
14568:
$5,848
State:
$11,730
(% of AGI for various income ranges: 2.4% for AGIs below $10k, 5.0% for AGIs $10k-25k, 6.8% for AGIs $25k-50k, 7.8% for AGIs $50k-75k, 9.1% for AGIs $75k-100k, 15.1% for AGIs over 100k)
Earned income credit: $1,412 (reported on 8.0% of returns)
Here:
$1,412
State:
$1,757
Percentage of individuals using paid preparers for their 2004 taxes: 55.4%
Here:
55%
State:
67%
(% for various income ranges: 39.9% for AGIs below $10k, 59.1% for AGIs $10k-25k, 57.9% for AGIs $25k-50k, 59.8% for AGIs $50k-75k, 58.0% for AGIs $75k-100k, 62.0% for AGIs over 100k)
Household received Food Stamps/SNAP in the past 12 months: 96 Household did not receive Food Stamps/SNAP in the past 12 months: 2,462
Women who had a birth in the past 12 months: 90 (33 now married, 59 unmarried) Women who did not have a birth in the past 12 months: 1,286 (626 now married, 652 unmarried)
Housing units in zip code 14568 with a mortgage: 1,722 (199 second mortgage, 187 both second mortgage and home equity loan) Houses without a mortgage: 209
Median monthly owner costs for units with a mortgage: $1,430 Median monthly owner costs for units without a mortgage: $688
Residents with income below the poverty level in 2022:
This zip code:
5.6%
Whole state:
14.3%
Residents with income below 50% of the poverty level in 2022:
This zip code:
1.9%
Whole state:
6.8%
Median number of rooms in houses and condos:
Here:
7.0
State:
6.3
Median number of rooms in apartments:
Here:
5.0
State:
3.8
Notable locations in this zip code not listed on our city pages
Notable locations in zip code 14568: Arbor Road Nursery (A), Goat Bridge Farm (B), Greystone Golf Club (C), Blue Heron Hills Country Club (D), Walworth - Seely Public Library (E), Walworth Town Hall (F). Display/hide their locations on the map
Cemeteries: Finley Cemetery (1), Baker Cemetery (2), Hall Center Cemetery (3), Walworth Cemetery (4), Walworth Center Cemetery (5). Display/hide their locations on the map
1,105 married couples with children.
139 single-parent households (72 men, 67 women).
96.7% of residents of 14568 zip code speak English at home.
0.7% of residents speak Spanish at home (100% very well).
1.9% of residents speak other Indo-European language at home (83% very well, 17% well).
0.3% of residents speak Asian or Pacific Island language at home (62% very well, 38% well).
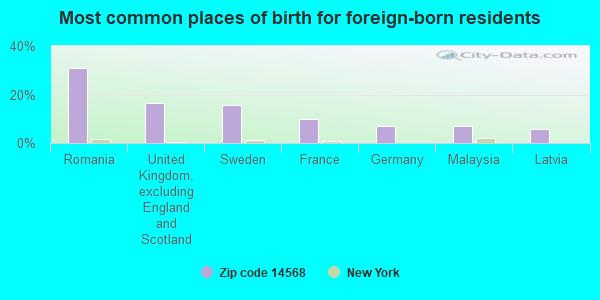
Foreign born population: 176 (2.8%) (87.0% of them are naturalized citizens)
This zip code:
2.8%
Whole state:
22.7%
31%Romania
17%United Kingdom, excluding England and Scotland
16%Sweden
10%France
7%Germany
7%Malaysia
6%Latvia
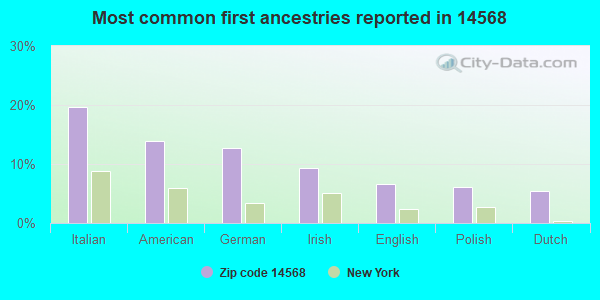
20%Italian
14%American
13%German
9%Irish
7%English
6%Polish
5%Dutch
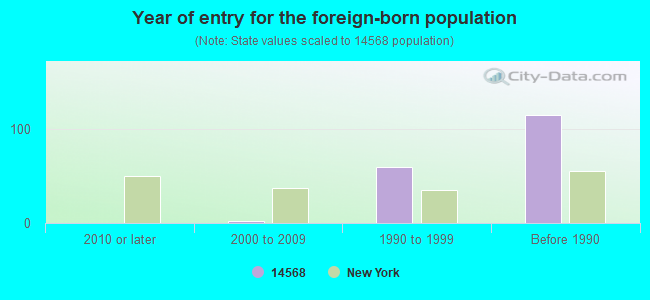
Year of entry for the foreign-born population
02010 or later
22000 to 2009
601990 to 1999
115Before 1990
Facilities with environmental interests located in this zip code:
HYDRA PREST CONCRETE DIV MANITOU CONST (1200 ATLANTIC AVE in WALWORTH, NY)
AIR MINOR (AIRS/AFS) Business SIC classification: CONCRETE BLOCK AND BRICK Alternative names: HYDRA-PREST CONCRETE
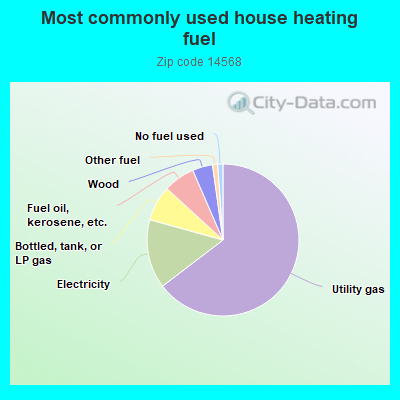
64.7%Utility gas
14.7%Electricity
7.5%Bottled, tank, or LP gas
6.7%Fuel oil, kerosene, etc.
4.3%Wood
1.1%Other fuel
1.1%No fuel used
Population in 1990: 5,461. Population change in the 1990s: +413 (+7.6%).
Place of birth for U.S.-born residents:
This state: 5,156
Northeast: 535
Midwest: 190
South: 135
West: 22
67% of the 14568 zip code residents lived in the same house 5 years ago. Out of people who lived in different houses, 41% lived in this county. Out of people who lived in different counties, 50% lived in New York.
97% of the 14568 zip code residents lived in the same house 1 year ago. Out of people who lived in different houses, 19% moved from this county. Out of people who lived in different houses, 78% moved from different county within same state.
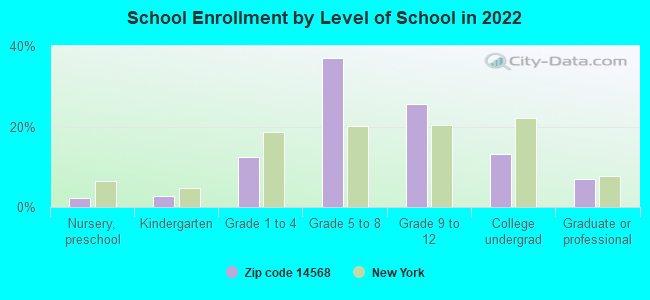
Private vs. public school enrollment:
Students in private schools in grades 1 to 8 (elementary and middle school): 18
Here:
2.3%
New York:
15.6%
Students in private schools in grades 9 to 12 (high school): 40
Here:
9.9%
New York:
15.0%
Students in private undergraduate colleges: 43
Here:
21.1%
New York:
39.2%
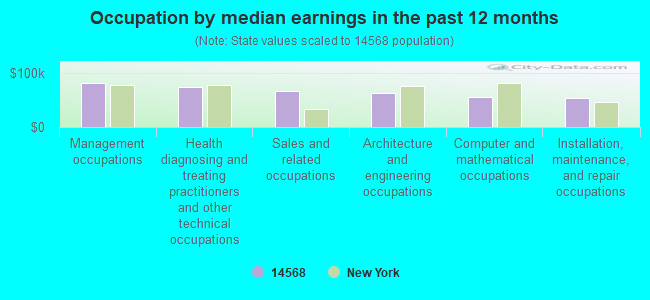
Occupation by median earnings in the past 12 months ($)
80,788Management occupations
73,899Health diagnosing and treating practitioners and other technical occupations
67,499Sales and related occupations
62,099Architecture and engineering occupations
56,151Computer and mathematical occupations
54,252Installation, maintenance, and repair occupations
Companies with federal contracts located in this zip code:
J&G MACHINE & TOOL CO , INC (2747 GILDERSLEEVE ROAD in WALWORTH, NY; small business)
$8,706 with Navy for Miscellaneous Ship and Marine Equipment. Signed on 2004-04-27. Completion date: 2004-06-14.
Top industries in this zip code by the number of employees in 2005:
Information: Data Processing, Hosting, and Related Services (20-49 employees: 1 establishment)
Mining: Crushed and Broken Limestone Mining and Quarrying (20-49: 1)
Information: Libraries and Archives (10-19: 1)
Utilities: Water Supply and Irrigation Systems (10-19: 1)
Professional, Scientific, and Technical Services: Veterinary Services (10-19: 1)
Accommodation and Food Services: Limited-Service Restaurants (10-19: 1)
Health Care and Social Assistance: Offices of Dentists (10-19: 1)
Health Care and Social Assistance: Child Day Care Services (5-9: 2)
People in group quarters in 2010:
7 people in group homes intended for adults
People in group quarters in 2000:
10 people in homes for the mentally retarded
Home Mortgage Disclosure Act Aggregated Statistics For Year 2009 (Based on 4 partial tracts)
A) FHA, FSA/RHS & VA Home Purchase Loans
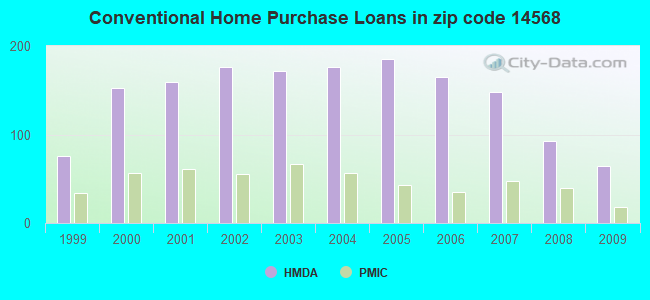
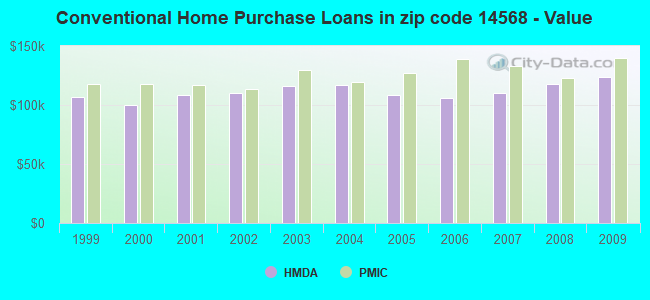
B) Conventional Home Purchase Loans
C) Refinancings
D) Home Improvement Loans
F) Non-occupant Loans on < 5 Family Dwellings (A B C & D)
G) Loans On Manufactured Home Dwelling (A B C & D)
Number
Average Value
Number
Average Value
Number
Average Value
Number
Average Value
Number
Average Value
Number
Average Value
LOANS ORIGINATED
74
$136,081
64
$123,973
164
$109,906
39
$25,854
2
$97,325
1
$12,080
APPLICATIONS APPROVED, NOT ACCEPTED
4
$128,387
2
$194,660
19
$119,478
5
$23,552
0
$0
0
$0
APPLICATIONS DENIED
8
$144,858
8
$106,580
50
$127,348
19
$22,380
1
$32,430
2
$6,470
APPLICATIONS WITHDRAWN
2
$175,955
2
$174,650
40
$124,735
3
$19,930
0
$0
0
$0
FILES CLOSED FOR INCOMPLETENESS
2
$139,065
1
$144,510
12
$116,474
2
$21,535
0
$0
0
$0
Aggregated Statistics For Year 2008 (Based on 4 partial tracts)
A) FHA, FSA/RHS & VA Home Purchase Loans
B) Conventional Home Purchase Loans
C) Refinancings
D) Home Improvement Loans
E) Loans on Dwellings For 5+ Families
F) Non-occupant Loans on < 5 Family Dwellings (A B C & D)
G) Loans On Manufactured Home Dwelling (A B C & D)
Number
Average Value
Number
Average Value
Number
Average Value
Number
Average Value
Number
Average Value
Number
Average Value
Number
Average Value
LOANS ORIGINATED
49
$133,983
93
$117,881
84
$117,304
31
$33,893
1
$813,450
4
$116,932
0
$0
APPLICATIONS APPROVED, NOT ACCEPTED
4
$146,188
13
$134,101
15
$119,771
6
$10,992
1
$732,450
0
$0
1
$13,360
APPLICATIONS DENIED
10
$114,346
8
$130,486
68
$134,439
36
$50,147
0
$0
1
$63,480
2
$12,030
APPLICATIONS WITHDRAWN
5
$119,540
9
$130,406
28
$124,194
7
$86,596
0
$0
0
$0
0
$0
FILES CLOSED FOR INCOMPLETENESS
0
$0
5
$135,586
8
$107,332
0
$0
0
$0
0
$0
0
$0
Aggregated Statistics For Year 2007 (Based on 4 partial tracts)
A) FHA, FSA/RHS & VA Home Purchase Loans
B) Conventional Home Purchase Loans
C) Refinancings
D) Home Improvement Loans
F) Non-occupant Loans on < 5 Family Dwellings (A B C & D)
Number
Average Value
Number
Average Value
Number
Average Value
Number
Average Value
Number
Average Value
LOANS ORIGINATED
51
$132,143
148
$110,241
121
$96,898
49
$36,364
7
$102,514
APPLICATIONS APPROVED, NOT ACCEPTED
3
$67,230
12
$123,632
35
$122,883
10
$36,929
1
$27,500
APPLICATIONS DENIED
5
$115,884
24
$115,362
118
$113,053
37
$31,204
4
$45,362
APPLICATIONS WITHDRAWN
4
$164,945
7
$107,796
65
$112,094
7
$16,909
0
$0
FILES CLOSED FOR INCOMPLETENESS
0
$0
5
$112,390
10
$124,651
1
$52,970
0
$0
Aggregated Statistics For Year 2006 (Based on 4 partial tracts)
A) FHA, FSA/RHS & VA Home Purchase Loans
B) Conventional Home Purchase Loans
C) Refinancings
D) Home Improvement Loans
F) Non-occupant Loans on < 5 Family Dwellings (A B C & D)
G) Loans On Manufactured Home Dwelling (A B C & D)
Number
Average Value
Number
Average Value
Number
Average Value
Number
Average Value
Number
Average Value
Number
Average Value
LOANS ORIGINATED
38
$134,270
165
$105,764
139
$92,997
47
$30,869
16
$99,185
1
$40,010
APPLICATIONS APPROVED, NOT ACCEPTED
1
$149,500
21
$93,074
33
$102,986
9
$45,044
2
$74,235
1
$44,200
APPLICATIONS DENIED
4
$97,422
25
$91,554
157
$101,912
55
$44,284
7
$47,561
2
$35,035
APPLICATIONS WITHDRAWN
3
$159,113
19
$122,735
87
$106,777
8
$101,536
2
$92,865
0
$0
FILES CLOSED FOR INCOMPLETENESS
0
$0
8
$106,098
29
$129,943
1
$53,990
1
$168,410
0
$0
Aggregated Statistics For Year 2005 (Based on 4 partial tracts)
A) FHA, FSA/RHS & VA Home Purchase Loans
B) Conventional Home Purchase Loans
C) Refinancings
D) Home Improvement Loans
F) Non-occupant Loans on < 5 Family Dwellings (A B C & D)
G) Loans On Manufactured Home Dwelling (A B C & D)
Number
Average Value
Number
Average Value
Number
Average Value
Number
Average Value
Number
Average Value
Number
Average Value
LOANS ORIGINATED
37
$119,586
185
$108,700
180
$101,068
54
$24,232
7
$79,064
3
$22,010
APPLICATIONS APPROVED, NOT ACCEPTED
2
$73,660
15
$112,409
28
$101,130
9
$39,009
1
$42,410
2
$87,130
APPLICATIONS DENIED
2
$77,180
22
$94,893
149
$117,044
32
$38,182
7
$95,461
4
$32,780
APPLICATIONS WITHDRAWN
2
$121,840
13
$128,020
114
$117,716
8
$97,704
3
$140,067
1
$95,700
FILES CLOSED FOR INCOMPLETENESS
0
$0
9
$184,906
42
$133,741
2
$83,935
2
$129,195
0
$0
Aggregated Statistics For Year 2004 (Based on 4 partial tracts)
A) FHA, FSA/RHS & VA Home Purchase Loans
B) Conventional Home Purchase Loans
C) Refinancings
D) Home Improvement Loans
F) Non-occupant Loans on < 5 Family Dwellings (A B C & D)
G) Loans On Manufactured Home Dwelling (A B C & D)
Number
Average Value
Number
Average Value
Number
Average Value
Number
Average Value
Number
Average Value
Number
Average Value
LOANS ORIGINATED
34
$116,759
176
$117,075
223
$98,378
43
$31,655
6
$85,293
3
$17,217
APPLICATIONS APPROVED, NOT ACCEPTED
1
$104,310
19
$126,842
36
$99,276
6
$27,980
0
$0
0
$0
APPLICATIONS DENIED
1
$77,520
20
$91,756
147
$107,783
30
$36,186
2
$128,715
2
$41,375
APPLICATIONS WITHDRAWN
1
$141,190
9
$123,672
116
$115,018
9
$36,702
1
$46,000
0
$0
FILES CLOSED FOR INCOMPLETENESS
1
$144,510
4
$80,508
50
$123,537
5
$22,310
1
$150,250
0
$0
Aggregated Statistics For Year 2003 (Based on 4 partial tracts)
A) FHA, FSA/RHS & VA Home Purchase Loans
B) Conventional Home Purchase Loans
C) Refinancings
D) Home Improvement Loans
E) Loans on Dwellings For 5+ Families
F) Non-occupant Loans on < 5 Family Dwellings (A B C & D)
Number
Average Value
Number
Average Value
Number
Average Value
Number
Average Value
Number
Average Value
Number
Average Value
LOANS ORIGINATED
37
$116,698
172
$115,935
526
$101,832
32
$14,868
1
$328,590
6
$105,990
APPLICATIONS APPROVED, NOT ACCEPTED
1
$76,560
13
$89,068
66
$100,283
5
$38,142
0
$0
0
$0
APPLICATIONS DENIED
3
$108,593
16
$110,956
164
$100,035
18
$14,880
0
$0
1
$118,290
APPLICATIONS WITHDRAWN
0
$0
14
$113,219
110
$107,003
5
$39,754
0
$0
0
$0
FILES CLOSED FOR INCOMPLETENESS
0
$0
2
$164,370
22
$98,863
0
$0
0
$0
0
$0
Aggregated Statistics For Year 2002 (Based on 4 partial tracts)
A) FHA, FSA/RHS & VA Home Purchase Loans
B) Conventional Home Purchase Loans
C) Refinancings
D) Home Improvement Loans
E) Loans on Dwellings For 5+ Families
F) Non-occupant Loans on < 5 Family Dwellings (A B C & D)
Number
Average Value
Number
Average Value
Number
Average Value
Number
Average Value
Number
Average Value
Number
Average Value
LOANS ORIGINATED
53
$104,061
176
$110,260
304
$95,297
41
$12,943
1
$73,690
6
$85,863
APPLICATIONS APPROVED, NOT ACCEPTED
5
$88,056
18
$94,561
52
$101,826
5
$32,908
0
$0
1
$28,710
APPLICATIONS DENIED
6
$91,107
19
$62,814
143
$89,022
17
$13,089
0
$0
2
$52,985
APPLICATIONS WITHDRAWN
0
$0
6
$111,668
86
$103,683
7
$27,604
0
$0
1
$67,100
FILES CLOSED FOR INCOMPLETENESS
2
$83,555
4
$46,688
24
$99,447
0
$0
0
$0
0
$0
Aggregated Statistics For Year 2001 (Based on 4 partial tracts)
A) FHA, FSA/RHS & VA Home Purchase Loans
B) Conventional Home Purchase Loans
C) Refinancings
D) Home Improvement Loans
F) Non-occupant Loans on < 5 Family Dwellings (A B C & D)
Number
Average Value
Number
Average Value
Number
Average Value
Number
Average Value
Number
Average Value
LOANS ORIGINATED
47
$101,743
159
$108,064
226
$94,461
28
$10,654
3
$90,033
APPLICATIONS APPROVED, NOT ACCEPTED
1
$123,730
3
$127,067
32
$70,562
6
$35,415
0
$0
APPLICATIONS DENIED
3
$83,080
12
$57,692
127
$82,931
34
$15,288
1
$21,590
APPLICATIONS WITHDRAWN
2
$115,320
11
$100,625
98
$100,059
5
$37,982
1
$9,570
FILES CLOSED FOR INCOMPLETENESS
1
$160,000
1
$91,480
16
$67,978
2
$22,970
1
$38,280
Aggregated Statistics For Year 2000 (Based on 4 partial tracts)
A) FHA, FSA/RHS & VA Home Purchase Loans
B) Conventional Home Purchase Loans
C) Refinancings
D) Home Improvement Loans
F) Non-occupant Loans on < 5 Family Dwellings (A B C & D)
Number
Average Value
Number
Average Value
Number
Average Value
Number
Average Value
Number
Average Value
LOANS ORIGINATED
58
$106,972
153
$99,959
71
$65,246
45
$15,965
2
$19,755
APPLICATIONS APPROVED, NOT ACCEPTED
2
$132,065
14
$95,406
22
$60,127
16
$21,883
0
$0
APPLICATIONS DENIED
5
$78,726
32
$63,050
93
$54,571
26
$21,896
6
$61,762
APPLICATIONS WITHDRAWN
2
$77,500
6
$98,715
34
$65,591
6
$27,013
1
$54,550
FILES CLOSED FOR INCOMPLETENESS
1
$80,390
4
$150,195
13
$84,865
0
$0
1
$191,400
Aggregated Statistics For Year 1999 (Based on 2 partial tracts)
A) FHA, FSA/RHS & VA Home Purchase Loans
B) Conventional Home Purchase Loans
C) Refinancings
D) Home Improvement Loans
F) Non-occupant Loans on < 5 Family Dwellings (A B C & D)
Detailed PMIC statistics for the following Tracts:0202.00
, 0203.00
2002 - 2018 National Fire Incident Reporting System (NFIRS) incidents
Based on the data from the years 2002 - 2018 the average number of fires per year is 8. The highest number of fires - 22 took place in 2015, and the least - 0 in 2007. The data has a rising trend.
When looking into fire subcategories, the most incidents belonged to: Structure Fires (71.3%), and Outside Fires (20.3%).
Fire incident types reported to NFIRS in Zip Code 14568


 Nearest zip codes: 14519, 14502, 14505, 14522, 14589, 14450.


 Based on the data from the years 2002 - 2018 the average number of fires per year is 8. The highest number of fires - 22 took place in 2015, and the least - 0 in 2007. The data has a rising trend.
 When looking into fire subcategories, the most incidents belonged to: Structure Fires (71.3%), and Outside Fires (20.3%).