Estimated zip code population in 2022: 29
Zip code population in 2010: 128
Zip code population in 2000: 179
Houses and condos: 61
Renter-occupied apartments: 9
| % of renters here: | 45% |
| State: | 31% |
92.2
(less than average, U.S. average is 100)
Land area: 0.0
sq. mi.
Water area: 0.0
sq. mi.
| Population density: 1,223 people per square mile | | (low). |
![Age and Sex of Residents in zip code 15075]()
- OSM Map
- General Map
- Google Map
- MSN Map
- OSM Map
- General Map
- Google Map
- MSN Map
- OSM Map
- General Map
- Google Map
- MSN Map
- OSM Map
- General Map
- Google Map
- MSN Map
Please wait while loading the map...
Business Search - 14 Million verified businesses
| Males: 8 |  (30.0%) (30.0%) |
| Females: 20 |  (70.0%) (70.0%) |
For population 25 years and over in 15075:
- High school or higher: 98.2%
- Bachelor's degree or higher: 0.0%
- Graduate or professional degree: 0.0%
- Mean travel time to work (commute): 178.7 minutes
For population 15 years and over in 15075:
- Never married: 23.2%
- Now married: 25.9%
- Separated: 22.7%
- Widowed: 28.1%
- Divorced: 0.0%
Zip code 15075 compared to state average:
- Median household income significantly below state average.
- Median house value significantly below state average.
- Unemployed percentage significantly below state average.
- Black race population percentage significantly below state average.
- Hispanic race population percentage significantly below state average.
- Median age significantly below state average.
- Foreign-born population percentage significantly below state average.
- Length of stay since moving in significantly above state average.
- House age above state average.
- Number of college students significantly below state average.
- Percentage of population with a bachelor's degree or higher significantly below state average.
Data:
100%
urban population.
Median resident age:| This zip code: | 30.7 years |
| Pennsylvania median age: | 40.9 years |
Average household size:| This zip code: | 1.5 people |
| Pennsylvania: | 2.4 people |
Averages for the 2004 tax year for zip code 15075, filed in 2005:
Average Adjusted Gross Income (AGI) in 2004: $34,288 (Individual Income Tax Returns)
| Here: | $34,288 |
| State: | $48,049 |
Salary/wage: $32,382 (reported on 80.2% of returns)
| Here: | $32,382 |
| State: | $42,646 |
(% of AGI for various income ranges: 84.7% for AGIs below $10k, 79.1% for AGIs $10k-25k, 87.0% for AGIs $25k-50k, 136.4% for AGIs $50k-75k)
Taxable interest for individuals: $286 (reported on 37.8% of returns)
| This zip code: | $286 |
| Pennsylvania: | $1,657 |
Taxable dividends: $400 (reported on 18.0% of returns)
Total itemized deductions: $11,421 (18% of AGI, reported on 17.1% of returns)
| Here: | $11,421 |
| State: | $18,804 |
| Here: | 17.8% of AGI |
| State: | 19.5% of AGI |
Charity contributions deductions: $1,000 (1% of AGI, reported on 11.7% of returns)
| Here: | 1.4% of AGI |
| State: | 3.3% of AGI |
Total tax: $3,530 (reported on 74.8% of returns)
Earned income credit: $1,231 (reported on 11.7% of returns)
Percentage of individuals using paid preparers for their 2004 taxes: 57.7%
(% for various income ranges: 65.0% for AGIs below $10k, 55.2% for AGIs $10k-25k, 54.1% for AGIs $25k-50k, 100.0% for AGIs $50k-75k)
![15075 map]() Nearest zip codes: 15024
Nearest zip codes: 15024,
15076,
15049,
15030,
15051,
15084.
Percentage of family households:| This zip code: | 0.0% |
| Pennsylvania: | 42.6% |
Percentage of households with unmarried partners:| This zip code: | 0.0% |
| Pennsylvania: | 46.5% |
No gay or lesbian households reported
Household received Food Stamps/SNAP in the past 12 months: 0
Household did not receive Food Stamps/SNAP in the past 12 months: 20
Women who did not have a birth in the past 12 months: 9 (9 now married, 0 unmarried)
Residents with income below the poverty level in 2022:
| This zip code: | 37.7% |
| Whole state: | 11.8% |

- Year house built (houses)
- 02020 or later
- 02010 to 2019
- 02000 to 2009
- 01990 to 1999
- 01980 to 1989
- 91970 to 1979
- 01960 to 1969
- 01950 to 1959
- 01940 to 1949
- 511939 or earlier
![Zip code 15075 satellite photo by USGS]()
Zip code 15075 household income distribution in 2022
![Zip code 15075 household income distribution in 2022]()
- 12Less than $10,000
- 8$75,000 to $99,999
Estimated median house (or condo) value in 2022 for:
- White Non-Hispanic householders: $251,718
Housing units in structures:
- One, attached: 19
- Two: 41
Travel time to work (commute) in zip code 15075
![Travel time to work (commute) in zip code 15075]()
- 1820 to 24 minutes
Percentage of zip code residents living and working in this county: 100.0%
Household type by relationship:
Households: 29
- Male householders: 9 (0 living alone), Female householders: 11 (11 living alone)
0 spouses (0 opposite-sex spouses), 10 unmarried partners, (10 opposite-sex unmarried partners), 0 children (0 natural, 0 adopted, 0 stepchildren), 0 grandchildren, 0 brothers or sisters, 0 parents, 0 foster children, 0 other relatives, 0 non-relatives
Size of nonfamily households: 11 1-person, 9 2-persons
All residents speak English at home
Foreign born population: 0 (0.0%)
Housing units lacking complete plumbing facilities: 58.1%
Housing units lacking complete kitchen facilities: 60.8%
Place of birth for U.S.-born residents:
71% of the 15075 zip code residents lived in the same house 5 years ago.
Out of people who lived in different houses, 100% lived in this county.
37% of the 15075 zip code residents lived in the same house 1 year ago.
Out of people who lived in different houses, 100% moved from different state.
Top industries in this zip code by the number of employees in 2005:
- Construction: Roofing Contractors (50-99 employees: 1 establishment)
- Construction: Painting and Wall Covering Contractors (1-4: 1)
- Other Services (except Public Administration): Computer and Office Machine Repair and Maintenance (1-4: 1)
Home Mortgage Disclosure Act Aggregated Statistics For Year 2009
(Based on 2 partial tracts)
|
| C) Refinancings
|
|---|
| Number | Average Value |
|---|
| LOANS ORIGINATED | 2 | $149,455 |
| APPLICATIONS APPROVED, NOT ACCEPTED | 0 | $0 |
| APPLICATIONS DENIED | 0 | $0 |
| APPLICATIONS WITHDRAWN | 0 | $0 |
| FILES CLOSED FOR INCOMPLETENESS | 0 | $0 |
Aggregated Statistics For Year 2008
(Based on 2 partial tracts)
|
| B) Conventional
Home Purchase Loans | C) Refinancings
|
|---|
| Number | Average Value | Number | Average Value |
|---|
| LOANS ORIGINATED | 1 | $125,790 | 1 | $79,450 |
| APPLICATIONS APPROVED, NOT ACCEPTED | 0 | $0 | 0 | $0 |
| APPLICATIONS DENIED | 0 | $0 | 0 | $0 |
| APPLICATIONS WITHDRAWN | 0 | $0 | 0 | $0 |
| FILES CLOSED FOR INCOMPLETENESS | 0 | $0 | 0 | $0 |
Aggregated Statistics For Year 2007
(Based on 2 partial tracts)
|
| B) Conventional
Home Purchase Loans | C) Refinancings
|
|---|
| Number | Average Value | Number | Average Value |
|---|
| LOANS ORIGINATED | 1 | $136,360 | 1 | $68,300 |
| APPLICATIONS APPROVED, NOT ACCEPTED | 0 | $0 | 0 | $0 |
| APPLICATIONS DENIED | 0 | $0 | 1 | $109,410 |
| APPLICATIONS WITHDRAWN | 0 | $0 | 0 | $0 |
| FILES CLOSED FOR INCOMPLETENESS | 0 | $0 | 0 | $0 |
Aggregated Statistics For Year 2006
(Based on 2 partial tracts)
|
| B) Conventional
Home Purchase Loans | C) Refinancings
|
|---|
| Number | Average Value | Number | Average Value |
|---|
| LOANS ORIGINATED | 1 | $199,630 | 1 | $100,350 |
| APPLICATIONS APPROVED, NOT ACCEPTED | 0 | $0 | 0 | $0 |
| APPLICATIONS DENIED | 0 | $0 | 1 | $62,170 |
| APPLICATIONS WITHDRAWN | 0 | $0 | 0 | $0 |
| FILES CLOSED FOR INCOMPLETENESS | 0 | $0 | 0 | $0 |
Aggregated Statistics For Year 2005
(Based on 2 partial tracts)
|
| B) Conventional
Home Purchase Loans | C) Refinancings
|
|---|
| Number | Average Value | Number | Average Value |
|---|
| LOANS ORIGINATED | 1 | $179,050 | 1 | $181,000 |
| APPLICATIONS APPROVED, NOT ACCEPTED | 0 | $0 | 0 | $0 |
| APPLICATIONS DENIED | 0 | $0 | 1 | $137,620 |
| APPLICATIONS WITHDRAWN | 0 | $0 | 1 | $78,780 |
| FILES CLOSED FOR INCOMPLETENESS | 0 | $0 | 0 | $0 |
Aggregated Statistics For Year 2004
(Based on 2 partial tracts)
|
| B) Conventional
Home Purchase Loans | C) Refinancings
|
|---|
| Number | Average Value | Number | Average Value |
|---|
| LOANS ORIGINATED | 1 | $144,320 | 1 | $190,540 |
| APPLICATIONS APPROVED, NOT ACCEPTED | 0 | $0 | 0 | $0 |
| APPLICATIONS DENIED | 0 | $0 | 1 | $174,510 |
| APPLICATIONS WITHDRAWN | 0 | $0 | 1 | $61,100 |
| FILES CLOSED FOR INCOMPLETENESS | 0 | $0 | 0 | $0 |
Aggregated Statistics For Year 2003
(Based on 2 partial tracts)
|
| B) Conventional
Home Purchase Loans | C) Refinancings
|
|---|
| Number | Average Value | Number | Average Value |
|---|
| LOANS ORIGINATED | 1 | $105,970 | 3 | $176,267 |
| APPLICATIONS APPROVED, NOT ACCEPTED | 0 | $0 | 1 | $71,690 |
| APPLICATIONS DENIED | 0 | $0 | 1 | $140,130 |
| APPLICATIONS WITHDRAWN | 0 | $0 | 0 | $0 |
| FILES CLOSED FOR INCOMPLETENESS | 0 | $0 | 0 | $0 |
Aggregated Statistics For Year 2002
(Based on 2 partial tracts)
|
| B) Conventional
Home Purchase Loans | C) Refinancings
|
|---|
| Number | Average Value | Number | Average Value |
|---|
| LOANS ORIGINATED | 1 | $85,890 | 2 | $154,425 |
| APPLICATIONS APPROVED, NOT ACCEPTED | 0 | $0 | 0 | $0 |
| APPLICATIONS DENIED | 0 | $0 | 1 | $82,780 |
| APPLICATIONS WITHDRAWN | 0 | $0 | 0 | $0 |
| FILES CLOSED FOR INCOMPLETENESS | 0 | $0 | 0 | $0 |
Aggregated Statistics For Year 2001
(Based on 2 partial tracts)
|
| B) Conventional
Home Purchase Loans | C) Refinancings
|
|---|
| Number | Average Value | Number | Average Value |
|---|
| LOANS ORIGINATED | 1 | $101,820 | 1 | $179,240 |
| APPLICATIONS APPROVED, NOT ACCEPTED | 0 | $0 | 0 | $0 |
| APPLICATIONS DENIED | 0 | $0 | 0 | $0 |
| APPLICATIONS WITHDRAWN | 0 | $0 | 0 | $0 |
| FILES CLOSED FOR INCOMPLETENESS | 0 | $0 | 0 | $0 |
Aggregated Statistics For Year 2000
(Based on 2 partial tracts)
|
| B) Conventional
Home Purchase Loans | C) Refinancings
|
|---|
| Number | Average Value | Number | Average Value |
|---|
| LOANS ORIGINATED | 1 | $124,030 | 1 | $36,300 |
| APPLICATIONS APPROVED, NOT ACCEPTED | 0 | $0 | 0 | $0 |
| APPLICATIONS DENIED | 0 | $0 | 0 | $0 |
| APPLICATIONS WITHDRAWN | 0 | $0 | 0 | $0 |
| FILES CLOSED FOR INCOMPLETENESS | 0 | $0 | 0 | $0 |
| Most common first names in zip code 15075 among deceased individuals |
| Name | Count | Lived (average) |
|---|
| John | 15 | 73.4 years |
| Mary | 9 | 83.2 years |
| Charles | 5 | 79.2 years |
| Frank | 3 | 74.7 years |
| George | 3 | 77.0 years |
| Mike | 3 | 76.3 years |
| Paul | 3 | 83.0 years |
| Caroline | 2 | 80.0 years |
| Helen | 2 | 78.6 years |
| Irene | 2 | 78.4 years |
| Most common last names in zip code 15075 among deceased individuals |
| Last name | Count | Lived (average) |
|---|
| Erceg | 4 | 78.8 years |
| Metal | 4 | 80.2 years |
| Pisarcik | 3 | 58.4 years |
| Bracco | 3 | 83.3 years |
| Mascarello | 3 | 84.6 years |
| Rusnak | 3 | 86.7 years |
| Mariani | 3 | 78.0 years |
| Firko | 2 | 88.0 years |
| Lynn | 2 | 73.5 years |
| Swaiko | 2 | 73.5 years |
 100% urban population.


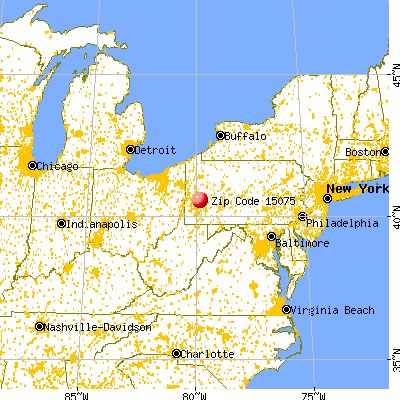

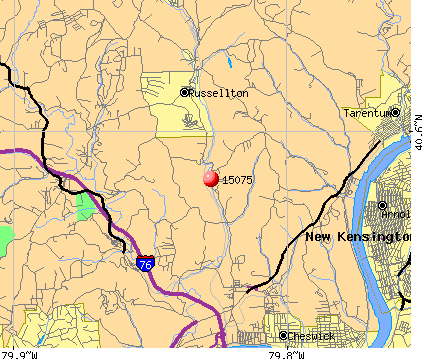 Nearest zip codes: 15024, 15076, 15049, 15030, 15051, 15084.


