Estimated median house/condo value in 2022: $177,016
15363:
$177,016
Pennsylvania:
$245,500
According to our research of Pennsylvania and other state lists, there was 1 registered sex offender living in 15363 zip code as of April 26, 2024. The ratio of all residents to sex offenders in zip code 15363 is 605 to 1. The ratio of registered sex offenders to all residents in this zip code is near the state average.
Median resident age:
This zip code:
34.6 years
Pennsylvania median age:
40.9 years
Average household size:
This zip code:
2.2 people
Pennsylvania:
2.4 people
Averages for the 2020 tax year for zip code 15363, filed in 2021:
Average Adjusted Gross Income (AGI) in 2020: $47,461 (Individual Income Tax Returns)
Here:
$47,461
State:
$75,707
Salary/wage: $45,631 (reported on 79.5% of returns)
Here:
$45,631
State:
$62,806
(% of AGI for various income ranges: 1143.0% for AGIs below $25k, 3242.2% for AGIs $25k-50k, 7498.0% for AGIs $50k-75k, 11220.0% for AGIs $75k-100k, 15983.3% for AGIs $100k-200k)
Taxable interest for individuals: $462 (reported on 29.5% of returns)
This zip code:
$462
Pennsylvania:
$1,633
(% of AGI for various income ranges: 29.0% for AGIs below $25k, 15.6% for AGIs $25k-50k, 8.0% for AGIs $50k-75k, 43.3% for AGIs $75k-100k)
Ordinary dividends: $600 (reported on 11.4% of returns)
Here:
$600
State:
$7,382
(% of AGI for various income ranges: 18.0% for AGIs below $25k, 24.0% for AGIs $50k-75k)
Net capital gain/loss in AGI: +$833 (reported on 6.8% of returns)
Here:
+$833
State:
+$23,522
(% of AGI for various income ranges: 27.8% for AGIs $25k-50k)
Profit/loss from business: +$8,880 (reported on 11.4% of returns)
Here:
+$8,880
State:
+$16,274
(% of AGI for various income ranges: 493.3% for AGIs $25k-50k)
Taxable individual retirement arrangement distribution: $6,750 (reported on 9.1% of returns)
15363:
$6,750
Pennsylvania:
$18,583
(% of AGI for various income ranges: 115.0% for AGIs below $25k, 172.2% for AGIs $25k-50k)
Earned income credit: $1,414 (reported on 15.9% of returns)
Here:
$1,414
State:
$2,100
(% of AGI for various income ranges: 51.0% for AGIs below $25k, 53.3% for AGIs $25k-50k)
Percentage of individuals using paid preparers for their 2020 taxes: 90.9%
Here:
91%
State:
92%
(% for various income ranges: 87.5% for AGIs below $25k, 91.7% for AGIs $25k-50k, 100.0% for AGIs $50k-75k, 80.0% for AGIs $75k-100k, 100.0% for AGIs $100k-200k)
Averages for the 2012 tax year for zip code 15363, filed in 2013:
Average Adjusted Gross Income (AGI) in 2012: $37,893 (Individual Income Tax Returns)
Here:
$37,893
State:
$61,346
Salary/wage: $36,265 (reported on 82.2% of returns)
Here:
$36,265
State:
$51,902
(% of AGI for various income ranges: 68.4% for AGIs below $25k, 79.5% for AGIs $25k-50k, 79.2% for AGIs $50k-75k, 142.7% for AGIs $75k-100k)
Taxable interest for individuals: $676 (reported on 37.8% of returns)
This zip code:
$676
Pennsylvania:
$1,588
(% of AGI for various income ranges: 2.5% for AGIs below $25k, 0.5% for AGIs $25k-50k, 0.4% for AGIs $50k-75k, 0.5% for AGIs $75k-100k)
Ordinary dividends: $850 (reported on 13.3% of returns)
Here:
$850
State:
$5,827
Net capital gain/loss in AGI: +$5,633 (reported on 6.7% of returns)
Here:
+$5,633
State:
+$14,495
Profit/loss from business: +$6,125 (reported on 8.9% of returns)
Here:
+$6,125
State:
+$16,268
Taxable individual retirement arrangement distribution: $8,267 (reported on 13.3% of returns)
15363:
$8,267
Pennsylvania:
$14,550
Total itemized deductions: $16,120 (20% of AGI, reported on 11.1% of returns)
Here:
$16,120
State:
$23,538
Here:
19.9% of AGI
State:
18.4% of AGI
Charity contributions: $833 (reported on 6.7% of returns)
Here:
$833
State:
$4,025
Taxes paid: $4,540 (reported on 11.1% of returns)
15363:
$4,540
State:
$9,982
Earned income credit: $1,611 (reported on 20.0% of returns)
Here:
$1,611
State:
$2,106
(% of AGI for various income ranges: 4.7% for AGIs below $25k, 1.0% for AGIs $25k-50k)
Percentage of individuals using paid preparers for their 2012 taxes: 48.9%
Here:
49%
State:
53%
(% for various income ranges: 47.4% for AGIs below $25k, 58.3% for AGIs $25k-50k, 37.5% for AGIs $50k-75k, 75.0% for AGIs $75k-100k)
Averages for the 2004 tax year for zip code 15363, filed in 2005:
Average Adjusted Gross Income (AGI) in 2004: $30,827 (Individual Income Tax Returns)
Here:
$30,827
State:
$48,049
Salary/wage: $31,472 (reported on 78.2% of returns)
Here:
$31,472
State:
$42,646
(% of AGI for various income ranges: 54.2% for AGIs below $10k, 58.2% for AGIs $10k-25k, 84.9% for AGIs $25k-50k, 83.8% for AGIs $50k-75k, 89.0% for AGIs $75k-100k)
Taxable interest for individuals: $1,116 (reported on 49.0% of returns)
This zip code:
$1,116
Pennsylvania:
$1,657
(% of AGI for various income ranges: 4.6% for AGIs below $10k, 6.2% for AGIs $10k-25k, 1.1% for AGIs $25k-50k, 0.6% for AGIs $50k-75k, 0.3% for AGIs $75k-100k)
Taxable dividends: $922 (reported on 19.1% of returns)
Here:
$922
State:
$3,566
Net capital gain/loss: +$323 (reported on 7.7% of returns)
Here:
+$323
State:
+$9,716
Profit/loss from business: +$8,568 (reported on 9.2% of returns)
Here:
+$8,568
State:
+$14,267
IRA payment deduction: $2,600 (reported on 2.5% of returns)
15363:
$2,600
Pennsylvania:
$2,903
Total itemized deductions: $13,315 (24% of AGI, reported on 13.4% of returns)
Here:
$13,315
State:
$18,804
Here:
24.4% of AGI
State:
19.5% of AGI
(% of AGI for various income ranges: 7.6% for AGIs $10k-25k, 4.1% for AGIs $25k-50k, 5.0% for AGIs $50k-75k, 9.3% for AGIs $75k-100k)
Charity contributions deductions: $1,106 (2% of AGI, reported on 11.6% of returns)
Here:
$1,106
State:
$3,337
Here:
1.9% of AGI
State:
3.3% of AGI
Total tax: $3,182 (reported on 76.2% of returns)
15363:
$3,182
State:
$8,008
(% of AGI for various income ranges: 2.2% for AGIs below $10k, 4.1% for AGIs $10k-25k, 7.0% for AGIs $25k-50k, 9.1% for AGIs $50k-75k, 12.2% for AGIs $75k-100k)
Earned income credit: $1,412 (reported on 12.6% of returns)
Here:
$1,412
State:
$1,643
Percentage of individuals using paid preparers for their 2004 taxes: 51.2%
Here:
51%
State:
56%
(% for various income ranges: 47.5% for AGIs below $10k, 44.3% for AGIs $10k-25k, 58.2% for AGIs $25k-50k, 54.5% for AGIs $50k-75k, 56.0% for AGIs $75k-100k)
Household received Food Stamps/SNAP in the past 12 months: 0 Household did not receive Food Stamps/SNAP in the past 12 months: 257
Women who did not have a birth in the past 12 months: 148 (121 now married, 24 unmarried)
Housing units in zip code 15363 with a mortgage: 76 Median monthly owner costs for units with a mortgage: $1,516 Median monthly owner costs for units without a mortgage: $399
Residents with income below the poverty level in 2022:
This zip code:
0.2%
Whole state:
11.8%
Residents with income below 50% of the poverty level in 2022:
This zip code:
0.2%
Whole state:
6.1%
Median number of rooms in houses and condos:
Here:
6.4
State:
6.8
Median number of rooms in apartments:
Here:
4.1
State:
4.3
Notable locations in this zip code not listed on our city pages
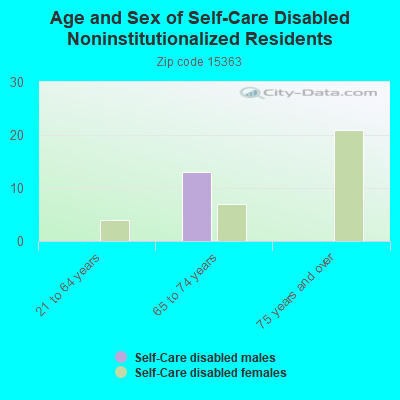
In group quarters: 1 (-1 institutionalized population)
Size of family households: 103 2-persons, 40 3-persons, 50 4-persons
Size of nonfamily households: 46 1-person, 17 2-persons
109 married couples with children.
0 single-parent households ().
97.2% of residents of 15363 zip code speak English at home.
2.4% of residents speak other Indo-European language at home (100% well).
Foreign born population: 51 (9.2%) (100.0% of them are naturalized citizens)
This zip code:
9.2%
Whole state:
7.5%
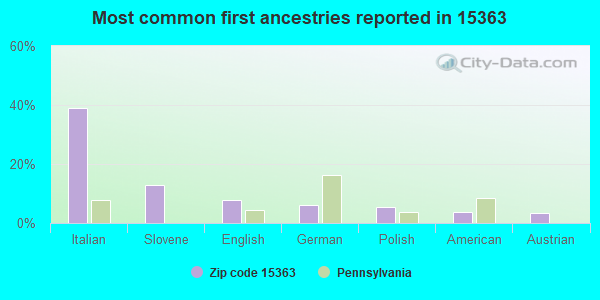
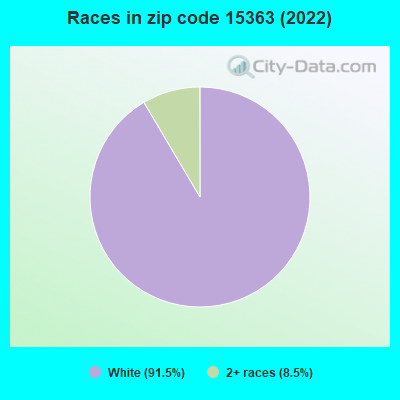
39%Italian
13%Slovene
8%English
6%German
5%Polish
4%American
3%Austrian
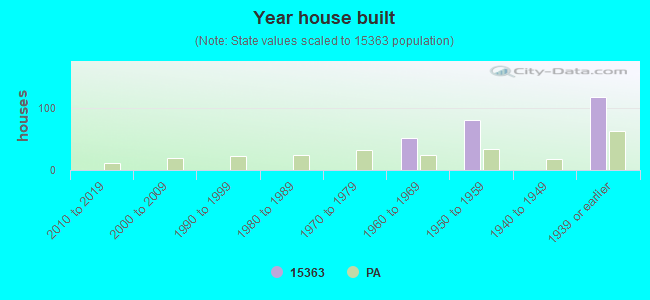
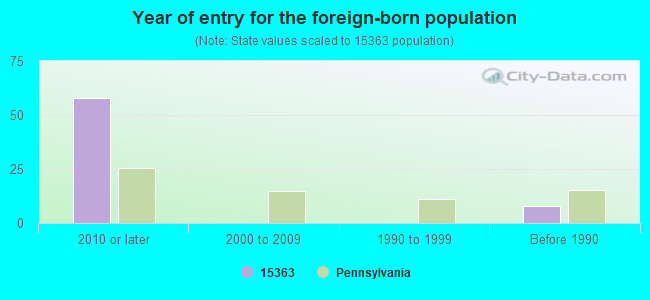
Year of entry for the foreign-born population
582010 or later
02000 to 2009
01990 to 1999
8Before 1990
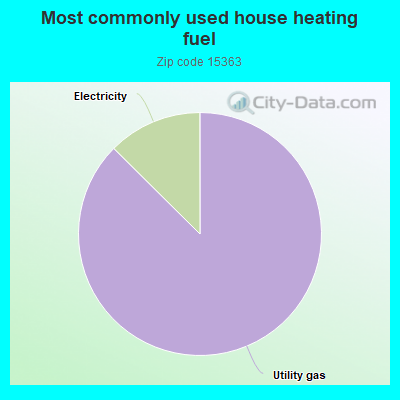
87.8%Utility gas
12.6%Electricity
Population in 1990: 2,386.
Place of birth for U.S.-born residents:
This state: 473
South: 11
West: 18
62% of the 15363 zip code residents lived in the same house 5 years ago. Out of people who lived in different houses, 81% lived in this county. Out of people who lived in different counties, 50% lived in Pennsylvania.
100% of the 15363 zip code residents lived in the same house 1 year ago.
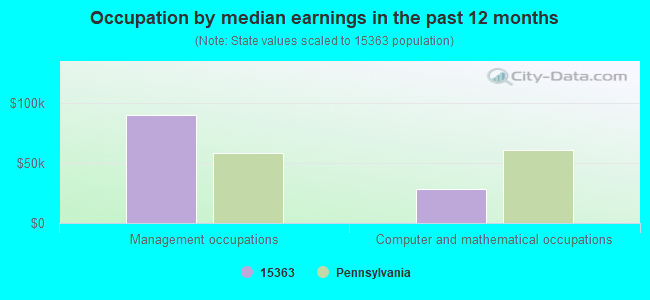
Occupation by median earnings in the past 12 months ($)
89,940Management occupations
28,690Computer and mathematical occupations
Top industries in this zip code by the number of employees in 2005:
Health Care and Social Assistance: Child Day Care Services (10-19 employees: 1 establishment, 5-9 employees: 1 establishment)
Finance and Insurance: Savings Institutions (10-19: 1)
Other Services (except Public Administration): Civic and Social Organizations (1-4: 1)
Construction: Electrical Contractors (1-4: 1)
Accommodation and Food Services: Drinking Places (Alcoholic Beverages) (1-4: 1)
Home Mortgage Disclosure Act Aggregated Statistics For Year 2009 (Based on 2 partial tracts)
A) FHA, FSA/RHS & VA Home Purchase Loans
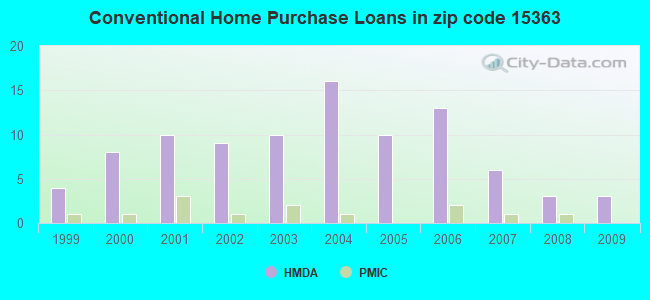
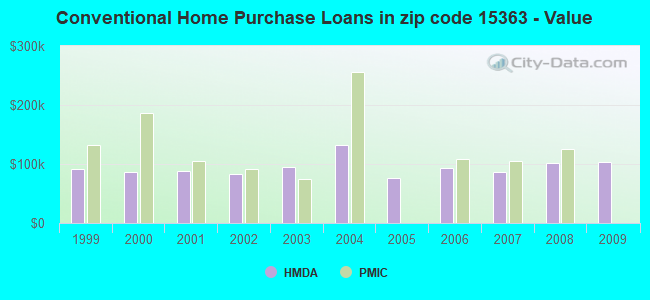
B) Conventional Home Purchase Loans
C) Refinancings
D) Home Improvement Loans
F) Non-occupant Loans on < 5 Family Dwellings (A B C & D)
Number
Average Value
Number
Average Value
Number
Average Value
Number
Average Value
Number
Average Value
LOANS ORIGINATED
3
$101,850
3
$102,650
10
$98,973
2
$41,350
2
$79,090
APPLICATIONS APPROVED, NOT ACCEPTED
0
$0
0
$0
0
$0
0
$0
0
$0
APPLICATIONS DENIED
1
$118,760
0
$0
8
$97,211
2
$174,290
0
$0
APPLICATIONS WITHDRAWN
0
$0
0
$0
4
$115,272
0
$0
0
$0
FILES CLOSED FOR INCOMPLETENESS
0
$0
0
$0
0
$0
0
$0
0
$0
Aggregated Statistics For Year 2008 (Based on 2 partial tracts)
A) FHA, FSA/RHS & VA Home Purchase Loans
B) Conventional Home Purchase Loans
C) Refinancings
D) Home Improvement Loans
F) Non-occupant Loans on < 5 Family Dwellings (A B C & D)
Number
Average Value
Number
Average Value
Number
Average Value
Number
Average Value
Number
Average Value
LOANS ORIGINATED
3
$114,350
3
$102,330
6
$103,332
2
$44,955
3
$92,473
APPLICATIONS APPROVED, NOT ACCEPTED
0
$0
0
$0
0
$0
0
$0
0
$0
APPLICATIONS DENIED
0
$0
1
$38,940
9
$120,253
4
$42,130
0
$0
APPLICATIONS WITHDRAWN
0
$0
1
$132,940
3
$119,720
0
$0
0
$0
FILES CLOSED FOR INCOMPLETENESS
0
$0
0
$0
2
$101,930
0
$0
0
$0
Aggregated Statistics For Year 2007 (Based on 2 partial tracts)
A) FHA, FSA/RHS & VA Home Purchase Loans
B) Conventional Home Purchase Loans
C) Refinancings
D) Home Improvement Loans
F) Non-occupant Loans on < 5 Family Dwellings (A B C & D)
Number
Average Value
Number
Average Value
Number
Average Value
Number
Average Value
Number
Average Value
LOANS ORIGINATED
2
$136,910
6
$86,423
11
$78,502
3
$25,963
2
$48,080
APPLICATIONS APPROVED, NOT ACCEPTED
0
$0
0
$0
2
$72,600
0
$0
0
$0
APPLICATIONS DENIED
0
$0
1
$81,740
11
$106,869
5
$54,090
1
$240,880
APPLICATIONS WITHDRAWN
0
$0
0
$0
2
$99,885
0
$0
0
$0
FILES CLOSED FOR INCOMPLETENESS
0
$0
0
$0
1
$174,770
0
$0
0
$0
Aggregated Statistics For Year 2006 (Based on 2 partial tracts)
A) FHA, FSA/RHS & VA Home Purchase Loans
B) Conventional Home Purchase Loans
C) Refinancings
D) Home Improvement Loans
F) Non-occupant Loans on < 5 Family Dwellings (A B C & D)
Number
Average Value
Number
Average Value
Number
Average Value
Number
Average Value
Number
Average Value
LOANS ORIGINATED
2
$96,040
13
$92,942
14
$69,802
6
$42,350
3
$73,643
APPLICATIONS APPROVED, NOT ACCEPTED
0
$0
0
$0
2
$50,365
1
$26,920
0
$0
APPLICATIONS DENIED
0
$0
2
$81,255
10
$75,005
4
$36,902
1
$125,250
APPLICATIONS WITHDRAWN
0
$0
1
$55,050
5
$82,602
0
$0
0
$0
FILES CLOSED FOR INCOMPLETENESS
0
$0
0
$0
0
$0
0
$0
0
$0
Aggregated Statistics For Year 2005 (Based on 2 partial tracts)
A) FHA, FSA/RHS & VA Home Purchase Loans
B) Conventional Home Purchase Loans
C) Refinancings
D) Home Improvement Loans
F) Non-occupant Loans on < 5 Family Dwellings (A B C & D)
Number
Average Value
Number
Average Value
Number
Average Value
Number
Average Value
Number
Average Value
LOANS ORIGINATED
0
$0
10
$75,822
16
$84,305
6
$24,682
3
$97,923
APPLICATIONS APPROVED, NOT ACCEPTED
0
$0
2
$97,845
3
$78,370
1
$13,940
0
$0
APPLICATIONS DENIED
1
$60,820
2
$39,305
14
$90,339
5
$43,416
1
$56,490
APPLICATIONS WITHDRAWN
0
$0
1
$142,320
8
$105,385
2
$212,155
1
$128,610
FILES CLOSED FOR INCOMPLETENESS
0
$0
0
$0
1
$138,950
0
$0
0
$0
Aggregated Statistics For Year 2004 (Based on 2 partial tracts)
A) FHA, FSA/RHS & VA Home Purchase Loans
B) Conventional Home Purchase Loans
C) Refinancings
D) Home Improvement Loans
F) Non-occupant Loans on < 5 Family Dwellings (A B C & D)
Number
Average Value
Number
Average Value
Number
Average Value
Number
Average Value
Number
Average Value
LOANS ORIGINATED
1
$68,030
16
$131,964
19
$82,179
5
$36,204
2
$69,475
APPLICATIONS APPROVED, NOT ACCEPTED
0
$0
1
$37,260
4
$80,535
1
$43,750
0
$0
APPLICATIONS DENIED
0
$0
2
$70,800
21
$83,098
6
$20,273
3
$43,833
APPLICATIONS WITHDRAWN
0
$0
3
$176,533
10
$89,020
0
$0
0
$0
FILES CLOSED FOR INCOMPLETENESS
0
$0
0
$0
6
$120,320
0
$0
0
$0
Aggregated Statistics For Year 2003 (Based on 2 partial tracts)
A) FHA, FSA/RHS & VA Home Purchase Loans
B) Conventional Home Purchase Loans
C) Refinancings
D) Home Improvement Loans
F) Non-occupant Loans on < 5 Family Dwellings (A B C & D)
Number
Average Value
Number
Average Value
Number
Average Value
Number
Average Value
Number
Average Value
LOANS ORIGINATED
1
$105,540
10
$94,141
28
$93,739
5
$30,676
4
$62,262
APPLICATIONS APPROVED, NOT ACCEPTED
0
$0
1
$65,390
6
$86,063
1
$3,370
0
$0
APPLICATIONS DENIED
0
$0
1
$177,660
16
$93,426
2
$27,525
1
$44,230
APPLICATIONS WITHDRAWN
0
$0
1
$110,100
7
$89,394
0
$0
0
$0
FILES CLOSED FOR INCOMPLETENESS
0
$0
0
$0
1
$113,230
0
$0
0
$0
Aggregated Statistics For Year 2002 (Based on 2 partial tracts)
A) FHA, FSA/RHS & VA Home Purchase Loans
B) Conventional Home Purchase Loans
C) Refinancings
D) Home Improvement Loans
F) Non-occupant Loans on < 5 Family Dwellings (A B C & D)
Number
Average Value
Number
Average Value
Number
Average Value
Number
Average Value
Number
Average Value
LOANS ORIGINATED
1
$94,240
9
$82,858
22
$89,986
4
$26,022
3
$70,037
APPLICATIONS APPROVED, NOT ACCEPTED
0
$0
0
$0
5
$80,438
1
$23,080
0
$0
APPLICATIONS DENIED
0
$0
0
$0
12
$65,288
2
$12,020
0
$0
APPLICATIONS WITHDRAWN
0
$0
0
$0
7
$80,397
0
$0
0
$0
FILES CLOSED FOR INCOMPLETENESS
0
$0
0
$0
4
$77,590
0
$0
0
$0
Aggregated Statistics For Year 2001 (Based on 2 partial tracts)
A) FHA, FSA/RHS & VA Home Purchase Loans
B) Conventional Home Purchase Loans
C) Refinancings
D) Home Improvement Loans
F) Non-occupant Loans on < 5 Family Dwellings (A B C & D)
Number
Average Value
Number
Average Value
Number
Average Value
Number
Average Value
Number
Average Value
LOANS ORIGINATED
3
$73,323
10
$88,227
23
$72,695
4
$30,832
4
$60,520
APPLICATIONS APPROVED, NOT ACCEPTED
0
$0
1
$41,830
5
$66,158
0
$0
0
$0
APPLICATIONS DENIED
0
$0
2
$50,485
15
$65,885
3
$28,367
1
$42,310
APPLICATIONS WITHDRAWN
0
$0
1
$47,600
6
$73,763
1
$16,590
0
$0
FILES CLOSED FOR INCOMPLETENESS
0
$0
0
$0
2
$74,405
0
$0
0
$0
Aggregated Statistics For Year 2000 (Based on 2 partial tracts)
A) FHA, FSA/RHS & VA Home Purchase Loans
B) Conventional Home Purchase Loans
C) Refinancings
D) Home Improvement Loans
F) Non-occupant Loans on < 5 Family Dwellings (A B C & D)
Number
Average Value
Number
Average Value
Number
Average Value
Number
Average Value
Number
Average Value
LOANS ORIGINATED
2
$105,775
8
$86,604
9
$54,838
7
$22,186
3
$42,870
APPLICATIONS APPROVED, NOT ACCEPTED
0
$0
0
$0
4
$58,898
1
$11,300
0
$0
APPLICATIONS DENIED
0
$0
1
$106,020
6
$50,003
3
$8,973
0
$0
APPLICATIONS WITHDRAWN
0
$0
1
$43,510
4
$60,340
1
$35,820
1
$33,420
FILES CLOSED FOR INCOMPLETENESS
0
$0
1
$100,970
2
$98,325
0
$0
0
$0
Aggregated Statistics For Year 1999 (Based on 1 partial tract)
A) FHA, FSA/RHS & VA Home Purchase Loans
B) Conventional Home Purchase Loans
C) Refinancings
D) Home Improvement Loans
F) Non-occupant Loans on < 5 Family Dwellings (A B C & D)

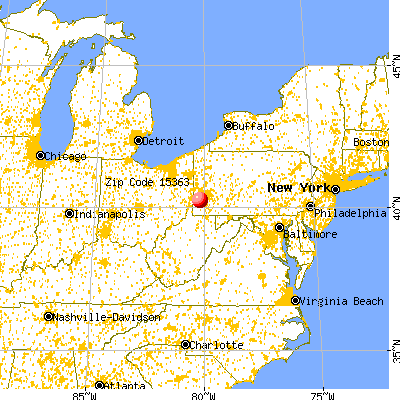


 Nearest zip codes: 15342, 15317, 15347, 15350, 15321, 15378.