Estimated median house/condo value in 2022: $271,765
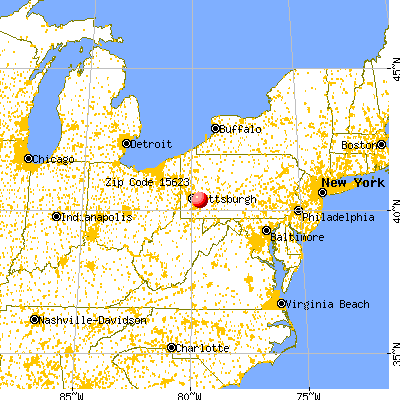
15623:
$271,765
Pennsylvania:
$245,500
Median resident age:
This zip code:
28.7 years
Pennsylvania median age:
40.9 years
Average household size:
This zip code:
2.4 people
Pennsylvania:
2.4 people
Averages for the 2020 tax year for zip code 15623, filed in 2021:
Average Adjusted Gross Income (AGI) in 2020: $66,285 (Individual Income Tax Returns)
Here:
$66,285
State:
$75,707
Salary/wage: $58,661 (reported on 82.6% of returns)
Here:
$58,661
State:
$62,806
(% of AGI for various income ranges: 830.0% for AGIs below $25k, 3266.0% for AGIs $25k-50k, 5048.3% for AGIs $50k-75k, 8186.7% for AGIs $75k-100k, 13420.0% for AGIs $100k-200k)
Taxable interest for individuals: $479 (reported on 30.4% of returns)
This zip code:
$479
Pennsylvania:
$1,633
(% of AGI for various income ranges: 10.9% for AGIs below $25k, 13.0% for AGIs $25k-50k, 25.0% for AGIs $50k-75k, 54.0% for AGIs $100k-200k)
Ordinary dividends: $2,589 (reported on 19.6% of returns)
Here:
$2,589
State:
$7,382
(% of AGI for various income ranges: 20.0% for AGIs below $25k, 48.3% for AGIs $50k-75k, 364.0% for AGIs $100k-200k)
Net capital gain/loss in AGI: +$3,629 (reported on 15.2% of returns)
Here:
+$3,629
State:
+$23,522
(% of AGI for various income ranges: 38.0% for AGIs $25k-50k, 432.0% for AGIs $100k-200k)
Profit/loss from business: +$4,375 (reported on 8.7% of returns)
Here:
+$4,375
State:
+$16,274
(% of AGI for various income ranges: 291.7% for AGIs $50k-75k)
Taxable individual retirement arrangement distribution: $14,817 (reported on 13.0% of returns)
15623:
$14,817
Pennsylvania:
$18,583
(% of AGI for various income ranges: 232.7% for AGIs below $25k, 1055.0% for AGIs $50k-75k)
Earned income credit: $1,980 (reported on 10.9% of returns)
Here:
$1,980
State:
$2,100
(% of AGI for various income ranges: 90.0% for AGIs below $25k)
Percentage of individuals using paid preparers for their 2020 taxes: 91.3%
Here:
91%
State:
92%
(% for various income ranges: 85.7% for AGIs below $25k, 91.7% for AGIs $25k-50k, 85.7% for AGIs $50k-75k, 100.0% for AGIs $75k-100k, 100.0% for AGIs $100k-200k, 100.0% for AGIs over 200k)
Averages for the 2012 tax year for zip code 15623, filed in 2013:
Average Adjusted Gross Income (AGI) in 2012: $52,260 (Individual Income Tax Returns)
Here:
$52,260
State:
$61,346
Salary/wage: $48,069 (reported on 87.5% of returns)
Here:
$48,069
State:
$51,902
(% of AGI for various income ranges: 73.2% for AGIs below $25k, 83.4% for AGIs $25k-50k, 88.3% for AGIs $50k-75k, 90.8% for AGIs $75k-100k, 72.1% for AGIs $100k-200k)
Taxable interest for individuals: $367 (reported on 22.5% of returns)
This zip code:
$367
Pennsylvania:
$1,588
(% of AGI for various income ranges: 0.9% for AGIs below $25k, 0.4% for AGIs $25k-50k)
Ordinary dividends: $2,040 (reported on 12.5% of returns)
Here:
$2,040
State:
$5,827
Profit/loss from business: +$2,650 (reported on 10.0% of returns)
Here:
+$2,650
State:
+$16,268
Taxable individual retirement arrangement distribution: $3,800 (reported on 7.5% of returns)
15623:
$3,800
Pennsylvania:
$14,550
Total itemized deductions: $19,856 (17% of AGI, reported on 22.5% of returns)
Here:
$19,856
State:
$23,538
Here:
16.6% of AGI
State:
18.4% of AGI
(% of AGI for various income ranges: 12.2% for AGIs $50k-75k, 10.1% for AGIs $75k-100k, 11.3% for AGIs $100k-200k)
Charity contributions: $1,529 (reported on 17.5% of returns)
Here:
$1,529
State:
$4,025
(% of AGI for various income ranges: 0.7% for AGIs $25k-50k, 0.6% for AGIs $75k-100k, 0.7% for AGIs $100k-200k)
Taxes paid: $7,722 (reported on 22.5% of returns)
15623:
$7,722
State:
$9,982
(% of AGI for various income ranges: 3.7% for AGIs $50k-75k, 3.5% for AGIs $75k-100k, 5.1% for AGIs $100k-200k)
Earned income credit: $2,280 (reported on 12.5% of returns)
Here:
$2,280
State:
$2,106
(% of AGI for various income ranges: 6.2% for AGIs below $25k)
Percentage of individuals using paid preparers for their 2012 taxes: 42.5%
Here:
42%
State:
53%
(% for various income ranges: 37.5% for AGIs below $25k, 33.3% for AGIs $25k-50k, 50.0% for AGIs $50k-75k, 60.0% for AGIs $75k-100k, 50.0% for AGIs $100k-200k)
Averages for the 2004 tax year for zip code 15623, filed in 2005:
Average Adjusted Gross Income (AGI) in 2004: $31,702 (Individual Income Tax Returns)
Here:
$31,702
State:
$48,049
Salary/wage: $30,344 (reported on 87.4% of returns)
Here:
$30,344
State:
$42,646
(% of AGI for various income ranges: 83.3% for AGIs below $10k, 66.7% for AGIs $10k-25k, 84.9% for AGIs $25k-50k, 93.7% for AGIs $50k-75k, 79.1% for AGIs $75k-100k)
Taxable interest for individuals: $654 (reported on 36.4% of returns)
This zip code:
$654
Pennsylvania:
$1,657
(% of AGI for various income ranges: 1.8% for AGIs below $10k, 3.0% for AGIs $10k-25k, 0.4% for AGIs $25k-50k, 0.4% for AGIs $50k-75k, 0.1% for AGIs $75k-100k)
Taxable dividends: $173 (reported on 14.9% of returns)
Here:
$173
State:
$3,566
Profit/loss from business: +$4,949 (reported on 11.2% of returns)
Here:
+$4,949
State:
+$14,267
Total itemized deductions: $12,261 (25% of AGI, reported on 13.2% of returns)
Here:
$12,261
State:
$18,804
Here:
25.0% of AGI
State:
19.5% of AGI
Charity contributions deductions: $1,250 (2% of AGI, reported on 10.3% of returns)
Here:
$1,250
State:
$3,337
Here:
2.5% of AGI
State:
3.3% of AGI
Total tax: $3,074 (reported on 77.9% of returns)
15623:
$3,074
State:
$8,008
(% of AGI for various income ranges: 1.8% for AGIs below $10k, 4.9% for AGIs $10k-25k, 6.8% for AGIs $25k-50k, 9.0% for AGIs $50k-75k, 10.1% for AGIs $75k-100k)
Earned income credit: $1,566 (reported on 15.2% of returns)
Here:
$1,566
State:
$1,643
Percentage of individuals using paid preparers for their 2004 taxes: 51.9%
Here:
52%
State:
56%
(% for various income ranges: 45.9% for AGIs below $10k, 53.5% for AGIs $10k-25k, 48.6% for AGIs $25k-50k, 61.2% for AGIs $50k-75k, 63.6% for AGIs $75k-100k)
Household received Food Stamps/SNAP in the past 12 months: 141 Household did not receive Food Stamps/SNAP in the past 12 months: 168
Women who had a birth in the past 12 months: 68 (0 now married, 58 unmarried) Women who did not have a birth in the past 12 months: 74 (73 now married, 0 unmarried)
Housing units in zip code 15623 with a mortgage: 180 (13 second mortgage, 13 both second mortgage and home equity loan) Houses without a mortgage: 13
Median monthly owner costs for units with a mortgage: $1,011 Median monthly owner costs for units without a mortgage: $559
Residents with income below the poverty level in 2022:
This zip code:
55.1%
Whole state:
11.8%
Residents with income below 50% of the poverty level in 2022:
This zip code:
37.6%
Whole state:
6.1%
Median number of rooms in houses and condos:
Here:
5.9
State:
6.8
Median number of rooms in apartments:
Here:
6.1
State:
4.3
Notable locations in this zip code not listed on our city pages
Size of family households: 45 2-persons, 12 3-persons, 108 4-persons
Size of nonfamily households: 124 1-person, 8 2-persons
102 married couples with children.
132 single-parent households (132 women).
96.8% of residents of 15623 zip code speak English at home.
1.9% of residents speak other Indo-European language at home (100% very well).
Foreign born population: 0 (0.0%)
:
0.0%
Whole state:
7.5%
57%Polish
19%Irish
7%Slovene
53.2%Fuel oil, kerosene, etc.
26.6%Utility gas
17.5%Electricity
3.0%Bottled, tank, or LP gas
Place of birth for U.S.-born residents:
This state: 661
Midwest: 24
South: 21
West: 23
76% of the 15623 zip code residents lived in the same house 5 years ago. Out of people who lived in different houses, 77% lived in this county. Out of people who lived in different counties, 50% lived in Pennsylvania.
100% of the 15623 zip code residents lived in the same house 1 year ago.
Private vs. public school enrollment:
Students in private schools in grades 1 to 8 (elementary and middle school):
Here:
0.0%
Pennsylvania:
15.7%
Students in private schools in grades 9 to 12 (high school): 11
Here:
100.0%
Pennsylvania:
13.4%
Top industries in this zip code by the number of employees in 2005:
Accommodation and Food Services: Full-Service Restaurants (10-19 employees: 2 establishments)
Construction: Site Preparation Contractors (10-19: 1)
Accommodation and Food Services: Drinking Places (Alcoholic Beverages) (5-9: 1)
Construction: Poured Concrete Foundation and Structure Contractors (1-4: 2)
Accommodation and Food Services: Limited-Service Restaurants (1-4: 1)
Health Care and Social Assistance: Offices of Chiropractors (1-4: 1)
Other Services (except Public Administration): General Automotive Repair (1-4: 1)
Home Mortgage Disclosure Act Aggregated Statistics For Year 2009 (Based on 2 partial tracts)
A) FHA, FSA/RHS & VA Home Purchase Loans
B) Conventional Home Purchase Loans
C) Refinancings
D) Home Improvement Loans
G) Loans On Manufactured Home Dwelling (A B C & D)
Number
Average Value
Number
Average Value
Number
Average Value
Number
Average Value
Number
Average Value
LOANS ORIGINATED
5
$104,866
8
$159,395
30
$112,859
5
$58,806
1
$29,210
APPLICATIONS APPROVED, NOT ACCEPTED
0
$0
0
$0
3
$141,010
0
$0
0
$0
APPLICATIONS DENIED
1
$89,920
0
$0
14
$119,430
2
$58,615
1
$47,050
APPLICATIONS WITHDRAWN
1
$59,950
0
$0
10
$143,527
0
$0
0
$0
FILES CLOSED FOR INCOMPLETENESS
0
$0
0
$0
2
$94,850
0
$0
0
$0
Aggregated Statistics For Year 2008 (Based on 2 partial tracts)
A) FHA, FSA/RHS & VA Home Purchase Loans
B) Conventional Home Purchase Loans
C) Refinancings
D) Home Improvement Loans
F) Non-occupant Loans on < 5 Family Dwellings (A B C & D)
G) Loans On Manufactured Home Dwelling (A B C & D)
Number
Average Value
Number
Average Value
Number
Average Value
Number
Average Value
Number
Average Value
Number
Average Value
LOANS ORIGINATED
8
$117,756
8
$160,249
19
$113,261
9
$39,373
2
$69,810
0
$0
APPLICATIONS APPROVED, NOT ACCEPTED
0
$0
0
$0
3
$120,143
1
$34,900
0
$0
0
$0
APPLICATIONS DENIED
0
$0
2
$87,070
13
$103,781
6
$27,570
0
$0
1
$82,330
APPLICATIONS WITHDRAWN
1
$83,470
2
$183,060
5
$84,226
1
$109,650
0
$0
0
$0
FILES CLOSED FOR INCOMPLETENESS
0
$0
0
$0
1
$85,740
0
$0
0
$0
0
$0
Aggregated Statistics For Year 2007 (Based on 2 partial tracts)
A) FHA, FSA/RHS & VA Home Purchase Loans
B) Conventional Home Purchase Loans
C) Refinancings
D) Home Improvement Loans
F) Non-occupant Loans on < 5 Family Dwellings (A B C & D)
G) Loans On Manufactured Home Dwelling (A B C & D)
Number
Average Value
Number
Average Value
Number
Average Value
Number
Average Value
Number
Average Value
Number
Average Value
LOANS ORIGINATED
3
$95,737
19
$133,049
21
$96,368
9
$57,289
3
$102,943
1
$72,470
APPLICATIONS APPROVED, NOT ACCEPTED
0
$0
3
$124,063
6
$70,315
2
$23,900
1
$63,740
1
$141,140
APPLICATIONS DENIED
1
$88,020
6
$138,545
20
$116,646
6
$56,152
2
$211,325
2
$33,575
APPLICATIONS WITHDRAWN
1
$138,860
2
$70,570
7
$116,856
0
$0
0
$0
0
$0
FILES CLOSED FOR INCOMPLETENESS
0
$0
0
$0
2
$124,825
0
$0
0
$0
0
$0
Aggregated Statistics For Year 2006 (Based on 2 partial tracts)
A) FHA, FSA/RHS & VA Home Purchase Loans
B) Conventional Home Purchase Loans
C) Refinancings
D) Home Improvement Loans
F) Non-occupant Loans on < 5 Family Dwellings (A B C & D)
G) Loans On Manufactured Home Dwelling (A B C & D)
Number
Average Value
Number
Average Value
Number
Average Value
Number
Average Value
Number
Average Value
Number
Average Value
LOANS ORIGINATED
2
$119,510
12
$92,510
23
$83,435
9
$26,516
3
$104,210
1
$50,840
APPLICATIONS APPROVED, NOT ACCEPTED
0
$0
3
$80,687
11
$89,538
1
$23,140
0
$0
0
$0
APPLICATIONS DENIED
0
$0
3
$168,073
22
$106,922
3
$28,960
2
$139,050
2
$62,030
APPLICATIONS WITHDRAWN
0
$0
1
$108,510
9
$133,507
1
$25,800
0
$0
0
$0
FILES CLOSED FOR INCOMPLETENESS
0
$0
0
$0
3
$97,887
0
$0
0
$0
0
$0
Aggregated Statistics For Year 2005 (Based on 2 partial tracts)
A) FHA, FSA/RHS & VA Home Purchase Loans
B) Conventional Home Purchase Loans
C) Refinancings
D) Home Improvement Loans
F) Non-occupant Loans on < 5 Family Dwellings (A B C & D)
G) Loans On Manufactured Home Dwelling (A B C & D)
Number
Average Value
Number
Average Value
Number
Average Value
Number
Average Value
Number
Average Value
Number
Average Value
LOANS ORIGINATED
1
$162,380
20
$107,086
33
$92,493
8
$58,522
2
$29,405
1
$53,870
APPLICATIONS APPROVED, NOT ACCEPTED
0
$0
2
$96,745
10
$102,590
2
$24,470
0
$0
0
$0
APPLICATIONS DENIED
0
$0
1
$100,160
29
$127,819
3
$72,843
0
$0
1
$17,830
APPLICATIONS WITHDRAWN
0
$0
5
$83,468
13
$107,108
1
$169,210
1
$127,860
0
$0
FILES CLOSED FOR INCOMPLETENESS
0
$0
0
$0
2
$134,685
0
$0
0
$0
0
$0
Aggregated Statistics For Year 2004 (Based on 2 partial tracts)
A) FHA, FSA/RHS & VA Home Purchase Loans
B) Conventional Home Purchase Loans
C) Refinancings
D) Home Improvement Loans
F) Non-occupant Loans on < 5 Family Dwellings (A B C & D)
G) Loans On Manufactured Home Dwelling (A B C & D)
Number
Average Value
Number
Average Value
Number
Average Value
Number
Average Value
Number
Average Value
Number
Average Value
LOANS ORIGINATED
1
$93,710
22
$126,047
39
$91,552
14
$44,173
2
$22,955
0
$0
APPLICATIONS APPROVED, NOT ACCEPTED
0
$0
2
$84,795
8
$99,592
0
$0
0
$0
0
$0
APPLICATIONS DENIED
0
$0
2
$80,435
28
$90,555
4
$32,532
2
$53,685
2
$27,695
APPLICATIONS WITHDRAWN
0
$0
2
$97,885
13
$113,091
1
$45,910
0
$0
1
$97,510
FILES CLOSED FOR INCOMPLETENESS
0
$0
0
$0
3
$155,553
0
$0
0
$0
0
$0
Aggregated Statistics For Year 2003 (Based on 2 partial tracts)
A) FHA, FSA/RHS & VA Home Purchase Loans
B) Conventional Home Purchase Loans
C) Refinancings
D) Home Improvement Loans
F) Non-occupant Loans on < 5 Family Dwellings (A B C & D)
Number
Average Value
Number
Average Value
Number
Average Value
Number
Average Value
Number
Average Value
LOANS ORIGINATED
3
$102,563
19
$125,861
74
$96,675
15
$33,210
2
$28,645
APPLICATIONS APPROVED, NOT ACCEPTED
0
$0
1
$124,440
17
$100,251
2
$18,590
0
$0
APPLICATIONS DENIED
0
$0
2
$135,635
24
$94,249
6
$35,473
0
$0
APPLICATIONS WITHDRAWN
0
$0
3
$46,287
12
$94,913
2
$64,120
0
$0
FILES CLOSED FOR INCOMPLETENESS
0
$0
1
$182,110
3
$80,307
0
$0
0
$0
Aggregated Statistics For Year 2002 (Based on 2 partial tracts)
A) FHA, FSA/RHS & VA Home Purchase Loans
B) Conventional Home Purchase Loans
C) Refinancings
D) Home Improvement Loans
F) Non-occupant Loans on < 5 Family Dwellings (A B C & D)
Number
Average Value
Number
Average Value
Number
Average Value
Number
Average Value
Number
Average Value
LOANS ORIGINATED
3
$94,977
17
$99,827
46
$95,477
10
$32,135
1
$63,740
APPLICATIONS APPROVED, NOT ACCEPTED
0
$0
3
$71,707
16
$99,142
3
$16,440
2
$151,190
APPLICATIONS DENIED
0
$0
3
$59,947
25
$82,436
3
$23,650
1
$45,530
APPLICATIONS WITHDRAWN
0
$0
2
$103,005
16
$84,986
1
$17,070
0
$0
FILES CLOSED FOR INCOMPLETENESS
0
$0
0
$0
2
$84,605
0
$0
0
$0
Aggregated Statistics For Year 2001 (Based on 2 partial tracts)
A) FHA, FSA/RHS & VA Home Purchase Loans
B) Conventional Home Purchase Loans
C) Refinancings
D) Home Improvement Loans
F) Non-occupant Loans on < 5 Family Dwellings (A B C & D)
Number
Average Value
Number
Average Value
Number
Average Value
Number
Average Value
Number
Average Value
LOANS ORIGINATED
2
$71,515
12
$91,530
41
$78,813
12
$18,053
1
$45,150
APPLICATIONS APPROVED, NOT ACCEPTED
0
$0
1
$38,320
12
$60,008
2
$40,405
0
$0
APPLICATIONS DENIED
0
$0
8
$41,022
24
$67,154
8
$12,520
0
$0
APPLICATIONS WITHDRAWN
0
$0
1
$124,060
13
$76,522
2
$14,415
0
$0
FILES CLOSED FOR INCOMPLETENESS
0
$0
0
$0
2
$104,335
0
$0
0
$0
Aggregated Statistics For Year 2000 (Based on 2 partial tracts)
A) FHA, FSA/RHS & VA Home Purchase Loans
B) Conventional Home Purchase Loans
C) Refinancings
D) Home Improvement Loans
F) Non-occupant Loans on < 5 Family Dwellings (A B C & D)
Number
Average Value
Number
Average Value
Number
Average Value
Number
Average Value
Number
Average Value
LOANS ORIGINATED
2
$45,340
13
$87,204
23
$64,977
8
$20,915
2
$43,440
APPLICATIONS APPROVED, NOT ACCEPTED
0
$0
2
$37,940
6
$71,263
5
$24,130
0
$0
APPLICATIONS DENIED
0
$0
6
$23,650
11
$67,809
4
$24,755
0
$0
APPLICATIONS WITHDRAWN
0
$0
1
$67,910
5
$79,218
0
$0
0
$0
FILES CLOSED FOR INCOMPLETENESS
0
$0
1
$43,630
1
$67,150
0
$0
0
$0
Aggregated Statistics For Year 1999 (Based on 1 partial tract)
A) FHA, FSA/RHS & VA Home Purchase Loans
B) Conventional Home Purchase Loans
C) Refinancings
D) Home Improvement Loans
F) Non-occupant Loans on < 5 Family Dwellings (A B C & D)
Detailed PMIC statistics for the following Tracts:8024.00
2004 - 2018 National Fire Incident Reporting System (NFIRS) incidents
Based on the data from the years 2004 - 2018 the average number of fires per year is 11. The highest number of reported fire incidents - 28 took place in 2009, and the least - 1 in 2013. The data has a dropping trend.
When looking into fire subcategories, the most reports belonged to: Structure Fires (55.6%), and Other (20.0%).
Fire incident types reported to NFIRS in Zip Code 15623


 Nearest zip codes: 15644, 15675, 15636, 15634, 15665, 15626.


 Based on the data from the years 2004 - 2018 the average number of fires per year is 11. The highest number of reported fire incidents - 28 took place in 2009, and the least - 1 in 2013. The data has a dropping trend.
 When looking into fire subcategories, the most reports belonged to: Structure Fires (55.6%), and Other (20.0%).