Estimated zip code population in 2022: 268 Zip code population in 2010: 423 Zip code population in 2000: 611
Houses and condos: 273 Renter-occupied apartments: 42
% of renters here:
29%
State:
31%
March 2022 cost of living index in zip code 15655: 89.0 (less than average, U.S. average is 100)
Land area: 12.9 sq. mi. Water area: 0.0 sq. mi.
Population density: 21 people per square mile
(very low).
OSM Map
General Map
Google Map
MSN Map
OSM Map
General Map
Google Map
MSN Map
OSM Map
General Map
Google Map
MSN Map
OSM Map
General Map
Google Map
MSN Map
Please wait while loading the map...
Real estate property taxes paid for housing units in 2022:
This zip code:
1.0% ($1,451)
Pennsylvania:
1.3% ($3,094)
Median real estate property taxes paid for housing units with mortgages in 2022: $1,672 (0.8%) Median real estate property taxes paid for housing units with no mortgage in 2022: $1,403 (0.8%)
Business Search- 14 Million verified businesses
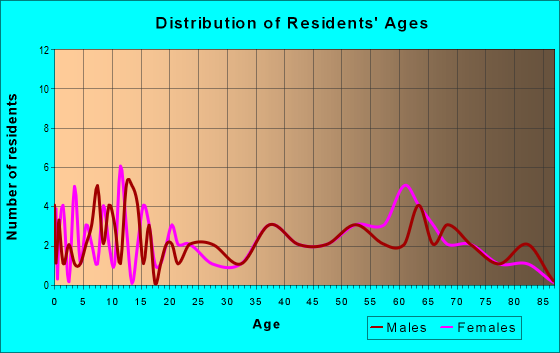
Males: 132
(49.4%)
Females: 135
(50.6%)
For population 25 years and over in 15655:
High school or higher: 97.9%
Bachelor's degree or higher: 18.0%
Graduate or professional degree: 6.4%
Unemployed: 3.6%
Mean travel time to work (commute): 17.8 minutes
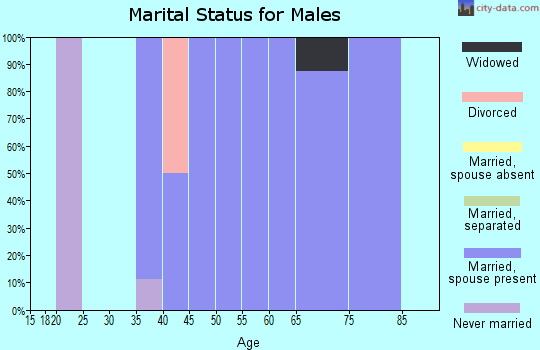
For population 15 years and over in 15655:
Never married: 10.9%
Now married: 76.5%
Separated: 4.6%
Widowed: 3.6%
Divorced: 4.3%
Zip code 15655 compared to state average:
Median household income below state average.
Median house value below state average.
Black race population percentage significantly below state average.
Hispanic race population percentage significantly below state average.
Median age significantly above state average.
Foreign-born population percentage significantly below state average.
Length of stay since moving in significantly above state average.
House age above state average.
Number of college students significantly below state average.
Estimated median house/condo value in 2022: $150,643
15655:
$150,643
Pennsylvania:
$245,500
According to our research of Pennsylvania and other state lists, there was 1 registered sex offender living in 15655 zip code as of May 15, 2024. The ratio of all residents to sex offenders in zip code 15655 is 359 to 1.
Median resident age:
This zip code:
64.3 years
Pennsylvania median age:
40.9 years
Average household size:
This zip code:
1.8 people
Pennsylvania:
2.4 people
Averages for the 2020 tax year for zip code 15655, filed in 2021:
Average Adjusted Gross Income (AGI) in 2020: $81,940 (Individual Income Tax Returns)
Here:
$81,940
State:
$75,707
Salary/wage: $55,268 (reported on 73.3% of returns)
Here:
$55,268
State:
$62,806
(% of AGI for various income ranges: 940.0% for AGIs below $25k, 2832.0% for AGIs $25k-50k, 4460.0% for AGIs $50k-75k, 23873.3% for AGIs $100k-200k)
Taxable interest for individuals: $1,162 (reported on 43.3% of returns)
This zip code:
$1,162
Pennsylvania:
$1,633
(% of AGI for various income ranges: 25.0% for AGIs below $25k, 50.0% for AGIs $50k-75k, 386.7% for AGIs $100k-200k)
Ordinary dividends: $8,860 (reported on 33.3% of returns)
Here:
$8,860
State:
$7,382
(% of AGI for various income ranges: 81.7% for AGIs below $25k, 300.0% for AGIs $50k-75k, 2390.0% for AGIs $100k-200k)
Net capital gain/loss in AGI: +$9,586 (reported on 23.3% of returns)
Here:
+$9,586
State:
+$23,522
(% of AGI for various income ranges: 46.0% for AGIs $25k-50k, 2160.0% for AGIs $100k-200k)
Profit/loss from business: +$9,375 (reported on 13.3% of returns)
Here:
+$9,375
State:
+$16,274
(% of AGI for various income ranges: 750.0% for AGIs $25k-50k)
Taxable individual retirement arrangement distribution: $19,750 (reported on 13.3% of returns)
15655:
$19,750
Pennsylvania:
$18,583
(% of AGI for various income ranges: 1975.0% for AGIs $50k-75k)
Earned income credit: $2,067 (reported on 10.0% of returns)
Here:
$2,067
State:
$2,100
(% of AGI for various income ranges: 103.3% for AGIs below $25k)
Percentage of individuals using paid preparers for their 2020 taxes: 90.0%
Here:
90%
State:
92%
(% for various income ranges: 80.0% for AGIs below $25k, 100.0% for AGIs $25k-50k, 100.0% for AGIs $50k-75k, 66.7% for AGIs $75k-100k, 100.0% for AGIs $100k-200k)
Averages for the 2012 tax year for zip code 15655, filed in 2013:
Average Adjusted Gross Income (AGI) in 2012: $63,009 (Individual Income Tax Returns)
Here:
$63,009
State:
$61,346
Salary/wage: $57,646 (reported on 76.5% of returns)
Here:
$57,646
State:
$51,902
(% of AGI for various income ranges: 59.7% for AGIs below $25k, 66.3% for AGIs $25k-50k, 76.4% for AGIs $50k-75k, 70.0% for AGIs $75k-100k, 69.9% for AGIs $100k-200k)
Taxable interest for individuals: $1,357 (reported on 41.2% of returns)
This zip code:
$1,357
Pennsylvania:
$1,588
(% of AGI for various income ranges: 1.2% for AGIs below $25k, 0.6% for AGIs $25k-50k, 0.7% for AGIs $50k-75k, 1.2% for AGIs $100k-200k)
Ordinary dividends: $11,689 (reported on 26.5% of returns)
Here:
$11,689
State:
$5,827
(% of AGI for various income ranges: 7.9% for AGIs below $25k, 2.8% for AGIs $50k-75k, 7.6% for AGIs $100k-200k)
Net capital gain/loss in AGI: +$21,543 (reported on 20.6% of returns)
Here:
+$21,543
State:
+$14,495
(% of AGI for various income ranges: 14.0% for AGIs $100k-200k)
Profit/loss from business: +$6,250 (reported on 11.8% of returns)
Here:
+$6,250
State:
+$16,268
Taxable individual retirement arrangement distribution: $6,075 (reported on 11.8% of returns)
15655:
$6,075
Pennsylvania:
$14,550
Total itemized deductions: $24,225 (16% of AGI, reported on 23.5% of returns)
Here:
$24,225
State:
$23,538
Here:
16.4% of AGI
State:
18.4% of AGI
(% of AGI for various income ranges: 20.5% for AGIs below $25k, 13.3% for AGIs $50k-75k, 10.5% for AGIs $100k-200k)
Charity contributions: $4,000 (reported on 20.6% of returns)
Here:
$4,000
State:
$4,025
Taxes paid: $9,912 (reported on 23.5% of returns)
15655:
$9,912
State:
$9,982
(% of AGI for various income ranges: 5.4% for AGIs below $25k, 4.4% for AGIs $50k-75k, 5.0% for AGIs $100k-200k)
Earned income credit: $2,075 (reported on 11.8% of returns)
Here:
$2,075
State:
$2,106
(% of AGI for various income ranges: 6.2% for AGIs below $25k)
Percentage of individuals using paid preparers for their 2012 taxes: 55.9%
Here:
56%
State:
53%
(% for various income ranges: 50.0% for AGIs below $25k, 50.0% for AGIs $25k-50k, 83.3% for AGIs $50k-75k, 80.0% for AGIs $100k-200k)
Averages for the 2004 tax year for zip code 15655, filed in 2005:
Average Adjusted Gross Income (AGI) in 2004: $47,711 (Individual Income Tax Returns)
Here:
$47,711
State:
$48,049
Salary/wage: $40,785 (reported on 78.3% of returns)
Here:
$40,785
State:
$42,646
(% of AGI for various income ranges: 85.4% for AGIs below $10k, 66.4% for AGIs $10k-25k, 65.1% for AGIs $25k-50k, 80.0% for AGIs $50k-75k, 65.5% for AGIs $75k-100k, 59.9% for AGIs over 100k)
Taxable interest for individuals: $1,803 (reported on 50.9% of returns)
This zip code:
$1,803
Pennsylvania:
$1,657
(% of AGI for various income ranges: 8.9% for AGIs below $10k, 2.5% for AGIs $10k-25k, 4.3% for AGIs $25k-50k, 0.4% for AGIs $50k-75k, 1.3% for AGIs $75k-100k, 1.3% for AGIs over 100k)
Taxable dividends: $3,377 (reported on 34.9% of returns)
Here:
$3,377
State:
$3,566
(% of AGI for various income ranges: 13.2% for AGIs below $10k, 4.1% for AGIs $10k-25k, 1.7% for AGIs $25k-50k, 0.6% for AGIs $50k-75k, 1.2% for AGIs $75k-100k, 3.7% for AGIs over 100k)
Net capital gain/loss: +$10,636 (reported on 22.0% of returns)
Here:
+$10,636
State:
+$9,716
(% of AGI for various income ranges: -6.1% for AGIs below $10k, 0.8% for AGIs $10k-25k, -0.2% for AGIs $25k-50k, 0.3% for AGIs $50k-75k, 13.9% for AGIs over 100k)
Profit/loss from business: +$10,000 (reported on 13.7% of returns)
Here:
+$10,000
State:
+$14,267
IRA payment deduction: $2,462 (reported on 3.7% of returns)
15655:
$2,462
Pennsylvania:
$2,903
Total itemized deductions: $15,638 (16% of AGI, reported on 26.9% of returns)
Here:
$15,638
State:
$18,804
Here:
16.4% of AGI
State:
19.5% of AGI
(% of AGI for various income ranges: 11.1% for AGIs $25k-50k, 7.3% for AGIs $50k-75k, 11.5% for AGIs $75k-100k, 9.2% for AGIs over 100k)
Charity contributions deductions: $3,212 (3% of AGI, reported on 24.3% of returns)
Here:
$3,212
State:
$3,337
Here:
3.2% of AGI
State:
3.3% of AGI
(% of AGI for various income ranges: 1.3% for AGIs $25k-50k, 1.1% for AGIs $50k-75k, 3.0% for AGIs $75k-100k, 1.9% for AGIs over 100k)
Total tax: $7,448 (reported on 79.7% of returns)
15655:
$7,448
State:
$8,008
(% of AGI for various income ranges: 2.9% for AGIs below $10k, 4.0% for AGIs $10k-25k, 7.3% for AGIs $25k-50k, 9.7% for AGIs $50k-75k, 11.9% for AGIs $75k-100k, 19.3% for AGIs over 100k)
Earned income credit: $1,000 (reported on 9.1% of returns)
Here:
$1,000
State:
$1,643
Percentage of individuals using paid preparers for their 2004 taxes: 56.3%
Here:
56%
State:
56%
(% for various income ranges: 48.0% for AGIs below $10k, 50.0% for AGIs $10k-25k, 57.9% for AGIs $25k-50k, 50.9% for AGIs $50k-75k, 65.5% for AGIs $75k-100k, 86.7% for AGIs over 100k)
Household received Food Stamps/SNAP in the past 12 months: 9 Household did not receive Food Stamps/SNAP in the past 12 months: 139
Women who had a birth in the past 12 months: 2 (2 now married, 0 unmarried) Women who did not have a birth in the past 12 months: 33 (21 now married, 12 unmarried)
Housing units in zip code 15655 with a mortgage: 31 (1 second mortgage, 1 both second mortgage and home equity loan) Residents with income below the poverty level in 2022:
This zip code:
0.7%
Whole state:
11.8%
Residents with income below 50% of the poverty level in 2022:
This zip code:
0.7%
Whole state:
6.1%
Median number of rooms in houses and condos:
Here:
6.2
State:
6.8
Median number of rooms in apartments:
Here:
6.0
State:
4.3
Notable locations in this zip code not listed on our city pages
Size of family households: 96 2-persons, 13 3-persons, 2 5-persons
Size of nonfamily households: 38 1-person
13 married couples with children.
0 single-parent households ().
100.4% of residents of 15655 zip code speak English at home.
Foreign born population: 0 (0.0%)
:
0.0%
Whole state:
7.5%
44%English
27%German
11%Hungarian
6%Polish
5%European
4%American
2%Scottish
Housing units lacking complete kitchen facilities: 3.3%
46.8%Utility gas
27.5%Wood
18.6%Fuel oil, kerosene, etc.
8.3%Electricity
Population in 1990: 436. Population change in the 1990s: +175 (+40.1%).
Place of birth for U.S.-born residents:
This state: 230
Northeast: 9
Midwest: 8
South: 16
West: 2
57% of the 15655 zip code residents lived in the same house 5 years ago. Out of people who lived in different houses, 43% lived in this county. Out of people who lived in different counties, 50% lived in Pennsylvania.
99% of the 15655 zip code residents lived in the same house 1 year ago. Out of people who lived in different houses, 33% moved from this county. Out of people who lived in different houses, 33% moved from different county within same state.
Private vs. public school enrollment:
Students in private schools in grades 1 to 8 (elementary and middle school):
Here:
0.0%
Pennsylvania:
15.7%
Students in private schools in grades 9 to 12 (high school):
Here:
0.0%
Pennsylvania:
13.4%
Occupation by median earnings in the past 12 months ($)
77,975Management occupations
24,954Sales and related occupations
Top industries in this zip code by the number of employees in 2005:
Construction: Site Preparation Contractors (50-99 employees: 1 establishment)
Other Services (except Public Administration): Grantmaking Foundations (5-9: 1, 1-4: 2)
Other Services (except Public Administration): General Automotive Repair (5-9: 1)
Construction: New Single-Family Housing Construction (except Operative Builders) (5-9: 1)
Accommodation and Food Services: Full-Service Restaurants (5-9: 1)
Professional, Scientific, and Technical Services: Engineering Services (5-9: 1)
Finance and Insurance: Commercial Banking (5-9: 1)
Construction: Painting and Wall Covering Contractors (1-4: 1)
Fatal accident statistics in 2013:
Fatal accident count: 1
Vehicles involved in fatal accidents: 2
Fatal accidents caused by drunken drivers: 0
Fatalities: 1
Persons involved in fatal accidents: 2
Pedestrians involved in fatal accidents: 0
Fatal accident statistics in 2012:
Fatal accident count: 1
Vehicles involved in fatal accidents: 1
Fatal accidents caused by drunken drivers: 1
Fatalities: 1
Persons involved in fatal accidents: 1
Pedestrians involved in fatal accidents: 0
Home Mortgage Disclosure Act Aggregated Statistics For Year 2009 (Based on 2 partial tracts)
A) FHA, FSA/RHS & VA Home Purchase Loans
B) Conventional Home Purchase Loans
C) Refinancings
D) Home Improvement Loans
F) Non-occupant Loans on < 5 Family Dwellings (A B C & D)
Number
Average Value
Number
Average Value
Number
Average Value
Number
Average Value
Number
Average Value
LOANS ORIGINATED
6
$126,205
17
$148,932
50
$153,759
11
$45,510
5
$156,182
APPLICATIONS APPROVED, NOT ACCEPTED
1
$79,350
1
$629,710
4
$85,968
1
$10,660
0
$0
APPLICATIONS DENIED
1
$66,720
1
$101,070
22
$153,380
3
$26,977
2
$111,335
APPLICATIONS WITHDRAWN
0
$0
1
$531,010
11
$181,393
2
$30,400
1
$152,390
FILES CLOSED FOR INCOMPLETENESS
1
$89,620
0
$0
3
$158,447
1
$184,770
0
$0
Aggregated Statistics For Year 2008 (Based on 2 partial tracts)
A) FHA, FSA/RHS & VA Home Purchase Loans
B) Conventional Home Purchase Loans
C) Refinancings
D) Home Improvement Loans
F) Non-occupant Loans on < 5 Family Dwellings (A B C & D)
G) Loans On Manufactured Home Dwelling (A B C & D)
Number
Average Value
Number
Average Value
Number
Average Value
Number
Average Value
Number
Average Value
Number
Average Value
LOANS ORIGINATED
6
$124,823
20
$170,968
33
$150,072
11
$54,483
4
$178,152
1
$31,980
APPLICATIONS APPROVED, NOT ACCEPTED
0
$0
2
$97,320
7
$82,626
1
$30,790
2
$111,530
1
$31,190
APPLICATIONS DENIED
1
$73,430
1
$79,350
34
$157,165
12
$59,122
1
$67,910
2
$60,010
APPLICATIONS WITHDRAWN
1
$73,830
2
$67,115
10
$151,090
1
$157,920
1
$22,900
0
$0
FILES CLOSED FOR INCOMPLETENESS
0
$0
0
$0
3
$268,727
0
$0
0
$0
0
$0
Aggregated Statistics For Year 2007 (Based on 2 partial tracts)
A) FHA, FSA/RHS & VA Home Purchase Loans
B) Conventional Home Purchase Loans
C) Refinancings
D) Home Improvement Loans
F) Non-occupant Loans on < 5 Family Dwellings (A B C & D)
G) Loans On Manufactured Home Dwelling (A B C & D)
Number
Average Value
Number
Average Value
Number
Average Value
Number
Average Value
Number
Average Value
Number
Average Value
LOANS ORIGINATED
5
$121,204
28
$143,721
54
$123,967
19
$42,763
5
$82,356
3
$48,957
APPLICATIONS APPROVED, NOT ACCEPTED
1
$38,690
2
$121,995
14
$150,334
4
$47,475
0
$0
1
$28,030
APPLICATIONS DENIED
1
$59,610
6
$105,477
45
$158,604
10
$38,532
3
$360,583
2
$47,180
APPLICATIONS WITHDRAWN
1
$58,430
6
$98,437
17
$121,134
1
$112,520
1
$131,070
0
$0
FILES CLOSED FOR INCOMPLETENESS
0
$0
1
$121,600
6
$201,743
1
$13,820
0
$0
0
$0
Aggregated Statistics For Year 2006 (Based on 2 partial tracts)
A) FHA, FSA/RHS & VA Home Purchase Loans
B) Conventional Home Purchase Loans
C) Refinancings
D) Home Improvement Loans
F) Non-occupant Loans on < 5 Family Dwellings (A B C & D)
G) Loans On Manufactured Home Dwelling (A B C & D)
Number
Average Value
Number
Average Value
Number
Average Value
Number
Average Value
Number
Average Value
Number
Average Value
LOANS ORIGINATED
3
$106,200
33
$121,443
54
$105,002
28
$29,596
7
$96,274
3
$72,773
APPLICATIONS APPROVED, NOT ACCEPTED
0
$0
2
$105,805
8
$223,161
5
$25,504
1
$31,980
0
$0
APPLICATIONS DENIED
0
$0
7
$93,850
42
$142,654
12
$36,058
3
$49,613
2
$95,345
APPLICATIONS WITHDRAWN
0
$0
4
$126,238
24
$143,707
2
$108,375
0
$0
0
$0
FILES CLOSED FOR INCOMPLETENESS
0
$0
0
$0
4
$327,290
0
$0
0
$0
0
$0
Aggregated Statistics For Year 2005 (Based on 2 partial tracts)
A) FHA, FSA/RHS & VA Home Purchase Loans
B) Conventional Home Purchase Loans
C) Refinancings
D) Home Improvement Loans
F) Non-occupant Loans on < 5 Family Dwellings (A B C & D)
G) Loans On Manufactured Home Dwelling (A B C & D)
Number
Average Value
Number
Average Value
Number
Average Value
Number
Average Value
Number
Average Value
Number
Average Value
LOANS ORIGINATED
2
$144,890
40
$151,070
58
$118,297
25
$63,736
10
$308,102
4
$46,882
APPLICATIONS APPROVED, NOT ACCEPTED
0
$0
3
$243,853
11
$115,927
2
$42,045
2
$59,810
0
$0
APPLICATIONS DENIED
0
$0
6
$75,867
38
$125,536
11
$31,261
4
$38,000
5
$35,768
APPLICATIONS WITHDRAWN
0
$0
6
$104,820
32
$132,752
4
$128,113
3
$109,490
0
$0
FILES CLOSED FOR INCOMPLETENESS
0
$0
0
$0
4
$102,055
0
$0
0
$0
0
$0
Aggregated Statistics For Year 2004 (Based on 2 partial tracts)
A) FHA, FSA/RHS & VA Home Purchase Loans
B) Conventional Home Purchase Loans
C) Refinancings
D) Home Improvement Loans
F) Non-occupant Loans on < 5 Family Dwellings (A B C & D)
G) Loans On Manufactured Home Dwelling (A B C & D)
Number
Average Value
Number
Average Value
Number
Average Value
Number
Average Value
Number
Average Value
Number
Average Value
LOANS ORIGINATED
2
$89,815
37
$132,439
84
$97,666
27
$47,200
10
$77,855
4
$42,738
APPLICATIONS APPROVED, NOT ACCEPTED
0
$0
2
$122,190
15
$125,231
3
$37,243
2
$198,585
2
$39,675
APPLICATIONS DENIED
0
$0
6
$59,680
45
$93,401
12
$39,184
4
$42,342
2
$21,515
APPLICATIONS WITHDRAWN
0
$0
5
$144,496
32
$102,574
3
$41,323
1
$163,840
1
$84,880
FILES CLOSED FOR INCOMPLETENESS
0
$0
0
$0
9
$133,750
0
$0
0
$0
0
$0
Aggregated Statistics For Year 2003 (Based on 2 partial tracts)
A) FHA, FSA/RHS & VA Home Purchase Loans
B) Conventional Home Purchase Loans
C) Refinancings
D) Home Improvement Loans
F) Non-occupant Loans on < 5 Family Dwellings (A B C & D)
Number
Average Value
Number
Average Value
Number
Average Value
Number
Average Value
Number
Average Value
LOANS ORIGINATED
4
$84,882
29
$118,889
132
$105,923
21
$39,931
9
$128,486
APPLICATIONS APPROVED, NOT ACCEPTED
0
$0
4
$86,362
15
$113,834
3
$66,457
1
$121,600
APPLICATIONS DENIED
1
$77,380
4
$64,450
48
$97,598
5
$35,926
1
$148,440
APPLICATIONS WITHDRAWN
0
$0
1
$95,540
19
$165,026
2
$45,600
0
$0
FILES CLOSED FOR INCOMPLETENESS
0
$0
0
$0
4
$114,690
0
$0
1
$169,370
Aggregated Statistics For Year 2002 (Based on 2 partial tracts)
A) FHA, FSA/RHS & VA Home Purchase Loans
B) Conventional Home Purchase Loans
C) Refinancings
D) Home Improvement Loans
F) Non-occupant Loans on < 5 Family Dwellings (A B C & D)
Number
Average Value
Number
Average Value
Number
Average Value
Number
Average Value
Number
Average Value
LOANS ORIGINATED
4
$81,722
30
$109,465
94
$105,953
19
$34,285
8
$94,259
APPLICATIONS APPROVED, NOT ACCEPTED
0
$0
2
$68,500
21
$103,663
2
$16,580
0
$0
APPLICATIONS DENIED
0
$0
4
$77,775
39
$90,247
6
$38,953
0
$0
APPLICATIONS WITHDRAWN
0
$0
2
$166,210
21
$109,153
2
$28,425
1
$69,480
FILES CLOSED FOR INCOMPLETENESS
0
$0
1
$116,070
4
$96,232
1
$11,840
0
$0
Aggregated Statistics For Year 2001 (Based on 2 partial tracts)
A) FHA, FSA/RHS & VA Home Purchase Loans
B) Conventional Home Purchase Loans
C) Refinancings
D) Home Improvement Loans
F) Non-occupant Loans on < 5 Family Dwellings (A B C & D)
Number
Average Value
Number
Average Value
Number
Average Value
Number
Average Value
Number
Average Value
LOANS ORIGINATED
2
$86,855
23
$114,509
65
$94,916
18
$25,640
4
$109,558
APPLICATIONS APPROVED, NOT ACCEPTED
0
$0
0
$0
19
$77,277
2
$21,320
1
$94,360
APPLICATIONS DENIED
0
$0
4
$79,750
42
$93,455
10
$25,228
1
$43,820
APPLICATIONS WITHDRAWN
0
$0
3
$113,967
28
$78,509
3
$11,317
1
$91,990
FILES CLOSED FOR INCOMPLETENESS
0
$0
0
$0
4
$87,350
0
$0
0
$0
Aggregated Statistics For Year 2000 (Based on 2 partial tracts)
A) FHA, FSA/RHS & VA Home Purchase Loans
B) Conventional Home Purchase Loans
C) Refinancings
D) Home Improvement Loans
F) Non-occupant Loans on < 5 Family Dwellings (A B C & D)
Number
Average Value
Number
Average Value
Number
Average Value
Number
Average Value
Number
Average Value
LOANS ORIGINATED
2
$70,865
28
$109,501
30
$102,437
21
$20,962
5
$238,932
APPLICATIONS APPROVED, NOT ACCEPTED
0
$0
2
$124,955
11
$78,529
7
$18,724
1
$180,030
APPLICATIONS DENIED
0
$0
8
$72,791
18
$70,735
7
$39,593
1
$41,450
APPLICATIONS WITHDRAWN
0
$0
3
$57,903
13
$74,738
2
$18,755
2
$22,305
FILES CLOSED FOR INCOMPLETENESS
0
$0
0
$0
3
$49,613
0
$0
0
$0
Aggregated Statistics For Year 1999 (Based on 1 partial tract)
A) FHA, FSA/RHS & VA Home Purchase Loans
B) Conventional Home Purchase Loans
C) Refinancings
D) Home Improvement Loans
F) Non-occupant Loans on < 5 Family Dwellings (A B C & D)


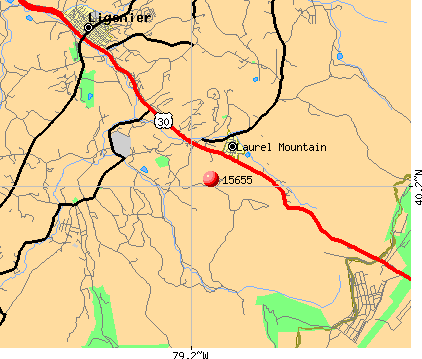 Nearest zip codes: 15531, 15544, 15658, 15677, 15547, 15561.