Estimated zip code population in 2022: 4,361 Zip code population in 2010: 4,676 Zip code population in 2000: 5,125
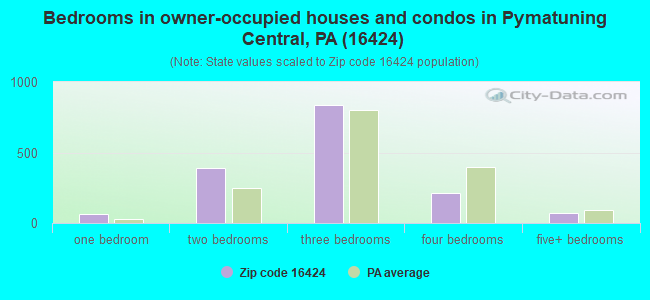
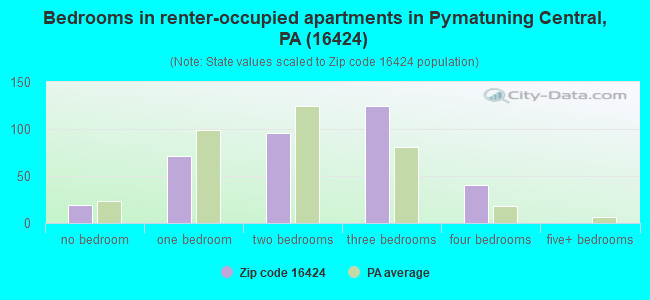
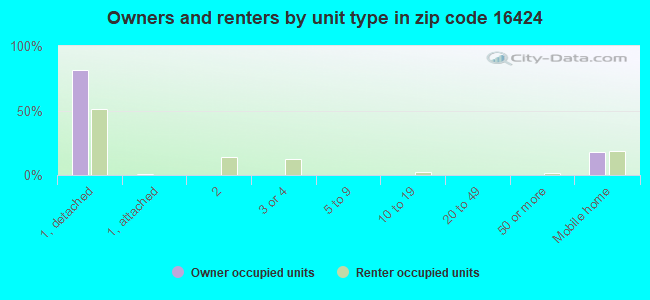
Houses and condos: 3,587 Renter-occupied apartments: 354
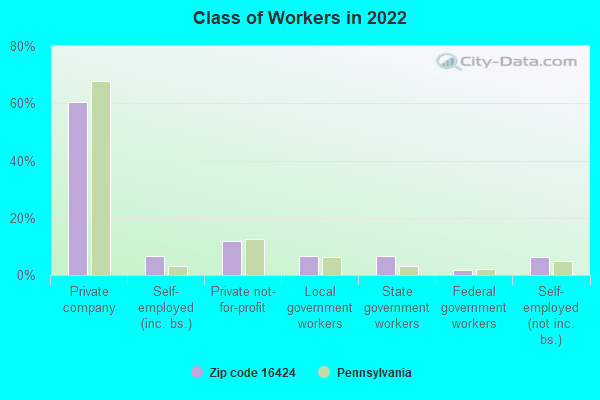
% of renters here:
18%
State:
31%
March 2022 cost of living index in zip code 16424: 91.3 (less than average, U.S. average is 100)
Land area: 68.3 sq. mi. Water area: 14.2 sq. mi.
Population density: 64 people per square mile
(very low).
OSM Map
General Map
Google Map
MSN Map
OSM Map
General Map
Google Map
MSN Map
OSM Map
General Map
Google Map
MSN Map
OSM Map
General Map
Google Map
MSN Map
Please wait while loading the map...
Real estate property taxes paid for housing units in 2022:
This zip code:
1.3% ($1,741)
Pennsylvania:
1.3% ($3,094)
Median real estate property taxes paid for housing units with mortgages in 2022: $1,921 (1.3%) Median real estate property taxes paid for housing units with no mortgage in 2022: $1,559 (1.3%)
Business Search- 14 Million verified businesses
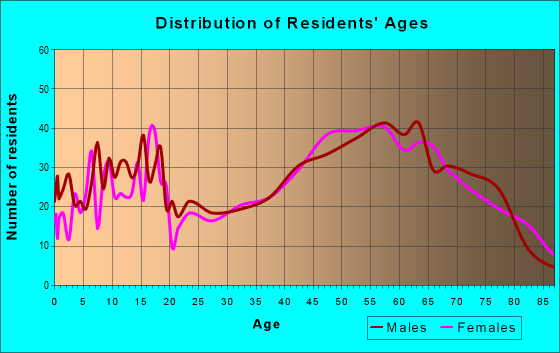
Males: 2,340
(53.7%)
Females: 2,021
(46.3%)
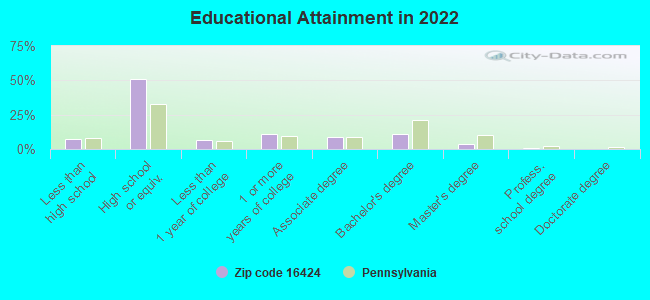
For population 25 years and over in 16424:
High school or higher: 91.6%
Bachelor's degree or higher: 14.9%
Graduate or professional degree: 4.2%
Unemployed: 3.5%
Mean travel time to work (commute): 25.9 minutes
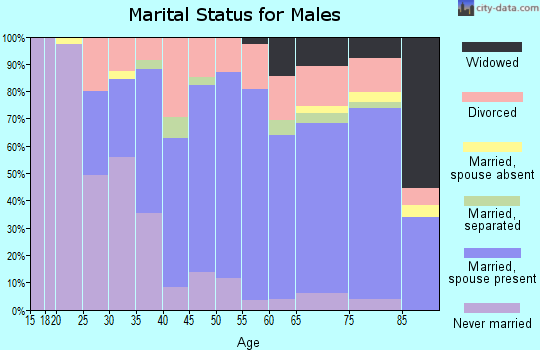
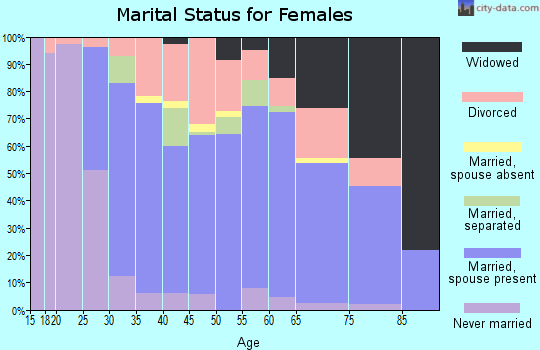
For population 15 years and over in 16424:
Never married: 24.1%
Now married: 49.8%
Separated: 0.8%
Widowed: 10.8%
Divorced: 14.5%
Zip code 16424 compared to state average:
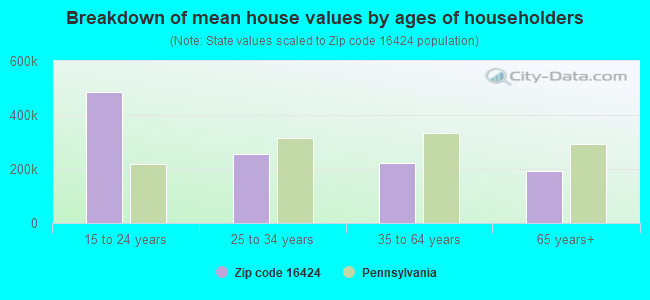
Median house value below state average.
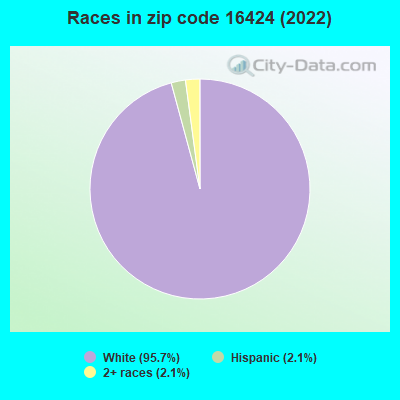
Black race population percentage significantly below state average.
Hispanic race population percentage significantly below state average.
Median age significantly above state average.
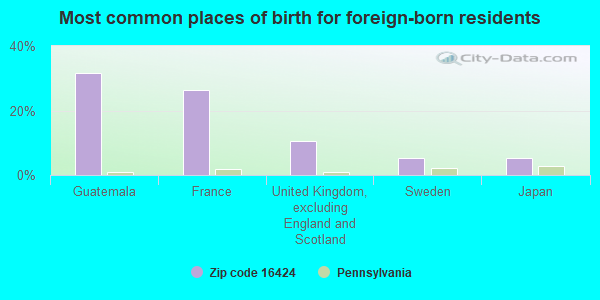
Foreign-born population percentage significantly below state average.
Renting percentage below state average.
Length of stay since moving in significantly above state average.
Number of college students below state average.
Percentage of population with a bachelor's degree or higher below state average.
Averages for the 2020 tax year for zip code 16424, filed in 2021:
Average Adjusted Gross Income (AGI) in 2020: $47,205 (Individual Income Tax Returns)
Here:
$47,205
State:
$75,707
Salary/wage: $40,683 (reported on 74.6% of returns)
Here:
$40,683
State:
$62,806
(% of AGI for various income ranges: 973.0% for AGIs below $25k, 3179.6% for AGIs $25k-50k, 5648.6% for AGIs $50k-75k, 8787.7% for AGIs $75k-100k, 14746.2% for AGIs $100k-200k)
Taxable interest for individuals: $658 (reported on 28.2% of returns)
This zip code:
$658
Pennsylvania:
$1,633
(% of AGI for various income ranges: 15.8% for AGIs below $25k, 13.9% for AGIs $25k-50k, 26.4% for AGIs $50k-75k, 40.0% for AGIs $75k-100k, 100.8% for AGIs $100k-200k)
Ordinary dividends: $1,961 (reported on 18.2% of returns)
Here:
$1,961
State:
$7,382
(% of AGI for various income ranges: 26.2% for AGIs below $25k, 25.9% for AGIs $25k-50k, 66.8% for AGIs $50k-75k, 53.1% for AGIs $75k-100k, 208.5% for AGIs $100k-200k)
Net capital gain/loss in AGI: +$4,535 (reported on 14.8% of returns)
Here:
+$4,535
State:
+$23,522
(% of AGI for various income ranges: 15.8% for AGIs below $25k, 58.2% for AGIs $25k-50k, 139.1% for AGIs $50k-75k, 92.3% for AGIs $75k-100k, 473.8% for AGIs $100k-200k)
Profit/loss from business: +$14,358 (reported on 11.5% of returns)
Here:
+$14,358
State:
+$16,274
(% of AGI for various income ranges: 114.0% for AGIs below $25k, 164.5% for AGIs $25k-50k, 478.6% for AGIs $50k-75k, 782.3% for AGIs $100k-200k)
Taxable individual retirement arrangement distribution: $12,262 (reported on 12.4% of returns)
16424:
$12,262
Pennsylvania:
$18,583
(% of AGI for various income ranges: 94.2% for AGIs below $25k, 138.6% for AGIs $25k-50k, 217.7% for AGIs $50k-75k, 409.2% for AGIs $75k-100k, 790.0% for AGIs $100k-200k)
Total itemized deductions: $31,550 (reported on 1.0% of returns)
Here:
$31,550
State:
$34,850
(% of AGI for various income ranges: 128.8% for AGIs $25k-50k)
Taxes paid: $6,350 (reported on 1.0% of returns)
16424:
$6,350
State:
$8,200
(% of AGI for various income ranges: 25.9% for AGIs $25k-50k)
Earned income credit: $1,968 (reported on 14.8% of returns)
Here:
$1,968
State:
$2,100
(% of AGI for various income ranges: 70.4% for AGIs below $25k, 52.7% for AGIs $25k-50k)
Percentage of individuals using paid preparers for their 2020 taxes: 94.3%
Here:
94%
State:
92%
(% for various income ranges: 92.0% for AGIs below $25k, 95.2% for AGIs $25k-50k, 93.8% for AGIs $50k-75k, 100.0% for AGIs $75k-100k, 95.5% for AGIs $100k-200k)
Averages for the 2012 tax year for zip code 16424, filed in 2013:
Average Adjusted Gross Income (AGI) in 2012: $37,491 (Individual Income Tax Returns)
Here:
$37,491
State:
$61,346
Salary/wage: $32,609 (reported on 76.3% of returns)
Here:
$32,609
State:
$51,902
(% of AGI for various income ranges: 62.5% for AGIs below $25k, 69.0% for AGIs $25k-50k, 71.8% for AGIs $50k-75k, 74.7% for AGIs $75k-100k, 53.6% for AGIs $100k-200k)
Taxable interest for individuals: $651 (reported on 31.8% of returns)
This zip code:
$651
Pennsylvania:
$1,588
(% of AGI for various income ranges: 1.1% for AGIs below $25k, 0.4% for AGIs $25k-50k, 0.7% for AGIs $50k-75k, 0.4% for AGIs $75k-100k, 0.3% for AGIs $100k-200k)
Ordinary dividends: $1,619 (reported on 19.9% of returns)
Here:
$1,619
State:
$5,827
(% of AGI for various income ranges: 1.7% for AGIs below $25k, 1.0% for AGIs $25k-50k, 0.6% for AGIs $50k-75k, 0.4% for AGIs $75k-100k, 0.7% for AGIs $100k-200k)
Net capital gain/loss in AGI: +$1,612 (reported on 12.3% of returns)
Here:
+$1,612
State:
+$14,495
(% of AGI for various income ranges: 0.5% for AGIs $25k-50k, 0.5% for AGIs $50k-75k, 1.4% for AGIs $100k-200k)
Profit/loss from business: +$12,539 (reported on 13.3% of returns)
Here:
+$12,539
State:
+$16,268
(% of AGI for various income ranges: 5.4% for AGIs below $25k, 3.6% for AGIs $25k-50k, 4.3% for AGIs $50k-75k, 4.9% for AGIs $75k-100k, 4.6% for AGIs $100k-200k)
Taxable individual retirement arrangement distribution: $9,738 (reported on 13.7% of returns)
16424:
$9,738
Pennsylvania:
$14,550
(% of AGI for various income ranges: 5.8% for AGIs below $25k, 4.0% for AGIs $25k-50k, 4.4% for AGIs $50k-75k, 3.4% for AGIs $100k-200k)
Total itemized deductions: $17,046 (21% of AGI, reported on 13.3% of returns)
Here:
$17,046
State:
$23,538
Here:
21.3% of AGI
State:
18.4% of AGI
(% of AGI for various income ranges: 3.4% for AGIs below $25k, 4.0% for AGIs $25k-50k, 5.8% for AGIs $50k-75k, 7.5% for AGIs $75k-100k, 9.7% for AGIs $100k-200k)
Charity contributions: $3,300 (reported on 8.1% of returns)
Here:
$3,300
State:
$4,025
(% of AGI for various income ranges: 0.5% for AGIs $25k-50k, 0.8% for AGIs $50k-75k, 0.9% for AGIs $75k-100k, 1.2% for AGIs $100k-200k)
Taxes paid: $5,511 (reported on 13.3% of returns)
16424:
$5,511
State:
$9,982
(% of AGI for various income ranges: 0.5% for AGIs below $25k, 1.0% for AGIs $25k-50k, 1.6% for AGIs $50k-75k, 2.8% for AGIs $75k-100k, 3.9% for AGIs $100k-200k)
Earned income credit: $1,831 (reported on 18.5% of returns)
Here:
$1,831
State:
$2,106
(% of AGI for various income ranges: 4.4% for AGIs below $25k, 1.0% for AGIs $25k-50k)
Percentage of individuals using paid preparers for their 2012 taxes: 58.3%
Here:
58%
State:
53%
(% for various income ranges: 53.1% for AGIs below $25k, 58.6% for AGIs $25k-50k, 63.3% for AGIs $50k-75k, 71.4% for AGIs $75k-100k, 72.7% for AGIs $100k-200k)
Averages for the 2004 tax year for zip code 16424, filed in 2005:
Average Adjusted Gross Income (AGI) in 2004: $29,609 (Individual Income Tax Returns)
Here:
$29,609
State:
$48,049
Salary/wage: $27,958 (reported on 76.3% of returns)
Here:
$27,958
State:
$42,646
(% of AGI for various income ranges: 86.9% for AGIs below $10k, 60.9% for AGIs $10k-25k, 76.1% for AGIs $25k-50k, 76.1% for AGIs $50k-75k, 75.5% for AGIs $75k-100k, 56.6% for AGIs over 100k)
Taxable interest for individuals: $1,106 (reported on 45.1% of returns)
This zip code:
$1,106
Pennsylvania:
$1,657
(% of AGI for various income ranges: 4.4% for AGIs below $10k, 2.7% for AGIs $10k-25k, 1.2% for AGIs $25k-50k, 1.5% for AGIs $50k-75k, 0.9% for AGIs $75k-100k, 2.1% for AGIs over 100k)
Taxable dividends: $1,818 (reported on 25.8% of returns)
Here:
$1,818
State:
$3,566
(% of AGI for various income ranges: 3.8% for AGIs below $10k, 2.1% for AGIs $10k-25k, 1.3% for AGIs $25k-50k, 1.3% for AGIs $50k-75k, 1.1% for AGIs $75k-100k, 2.3% for AGIs over 100k)
Net capital gain/loss: +$2,077 (reported on 16.3% of returns)
Here:
+$2,077
State:
+$9,716
(% of AGI for various income ranges: -1.7% for AGIs below $10k, 0.6% for AGIs $10k-25k, 0.5% for AGIs $25k-50k, 0.9% for AGIs $50k-75k, 0.7% for AGIs $75k-100k, 6.9% for AGIs over 100k)
Profit/loss from business: +$8,508 (reported on 14.8% of returns)
Here:
+$8,508
State:
+$14,267
(% of AGI for various income ranges: 2.6% for AGIs below $10k, 4.2% for AGIs $10k-25k, 3.7% for AGIs $25k-50k, 2.8% for AGIs $50k-75k, 11.6% for AGIs $75k-100k)
IRA payment deduction: $2,060 (reported on 2.4% of returns)
16424:
$2,060
Pennsylvania:
$2,903
Total itemized deductions: $13,303 (23% of AGI, reported on 15.6% of returns)
Here:
$13,303
State:
$18,804
Here:
22.8% of AGI
State:
19.5% of AGI
(% of AGI for various income ranges: 5.2% for AGIs $10k-25k, 6.0% for AGIs $25k-50k, 6.9% for AGIs $50k-75k, 9.7% for AGIs $75k-100k, 12.8% for AGIs over 100k)
Charity contributions deductions: $2,228 (4% of AGI, reported on 11.2% of returns)
Here:
$2,228
State:
$3,337
Here:
3.6% of AGI
State:
3.3% of AGI
(% of AGI for various income ranges: 0.3% for AGIs $10k-25k, 0.7% for AGIs $25k-50k, 0.9% for AGIs $50k-75k, 1.4% for AGIs $75k-100k, 1.8% for AGIs over 100k)
Total tax: $3,465 (reported on 69.3% of returns)
16424:
$3,465
State:
$8,008
(% of AGI for various income ranges: 2.8% for AGIs below $10k, 3.8% for AGIs $10k-25k, 6.4% for AGIs $25k-50k, 8.9% for AGIs $50k-75k, 11.5% for AGIs $75k-100k, 16.7% for AGIs over 100k)
Earned income credit: $1,617 (reported on 17.5% of returns)
Here:
$1,617
State:
$1,643
Percentage of individuals using paid preparers for their 2004 taxes: 60.8%
Here:
61%
State:
56%
(% for various income ranges: 54.7% for AGIs below $10k, 64.8% for AGIs $10k-25k, 59.9% for AGIs $25k-50k, 62.1% for AGIs $50k-75k, 66.0% for AGIs $75k-100k, 73.7% for AGIs over 100k)
Likely homosexual households (counted as self-reported same-sex unmarried-partner households)
Lesbian couples: 0.9% of all households
Gay men: 0.0% of all households
Household received Food Stamps/SNAP in the past 12 months: 278 Household did not receive Food Stamps/SNAP in the past 12 months: 1,652
Women who had a birth in the past 12 months: 42 (19 now married, 20 unmarried) Women who did not have a birth in the past 12 months: 596 (336 now married, 257 unmarried)
Housing units in zip code 16424 with a mortgage: 737 (58 second mortgage, 3 home equity loan, 45 both second mortgage and home equity loan) Houses without a mortgage: 84
Median monthly owner costs for units with a mortgage: $1,027 Median monthly owner costs for units without a mortgage: $441
Residents with income below the poverty level in 2022:
This zip code:
11.6%
Whole state:
11.8%
Residents with income below 50% of the poverty level in 2022:
This zip code:
7.7%
Whole state:
6.1%
Median number of rooms in houses and condos:
Here:
6.3
State:
6.8
Median number of rooms in apartments:
Here:
5.1
State:
4.3
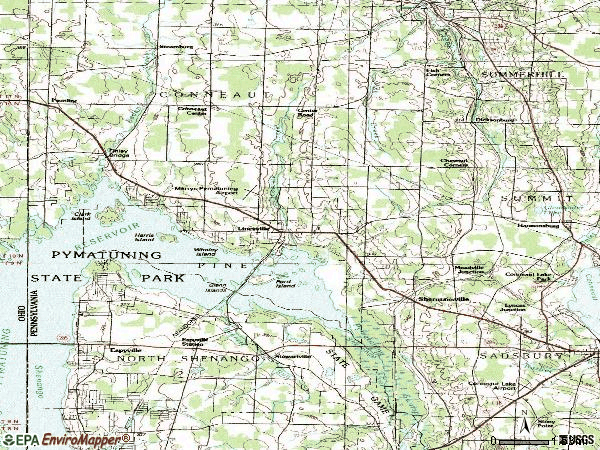
Notable locations in this zip code not listed on our city pages
Notable locations in zip code 16424: Harmonsburg Station (A), Espyville Station (B), Camp Iroquois (C), Chestnut Corners (D), North Shenango Volunteer Fire Department (E), Linesville Volunteer Fire Department (F). Display/hide their locations on the map
515 married couples with children.
95 single-parent households (61 men, 34 women).
94.6% of residents of 16424 zip code speak English at home.
0.5% of residents speak Spanish at home (100% very well).
5.1% of residents speak other Indo-European language at home (38% very well, 56% well, 7% not well).
0.1% of residents speak other language at home (100% very well).
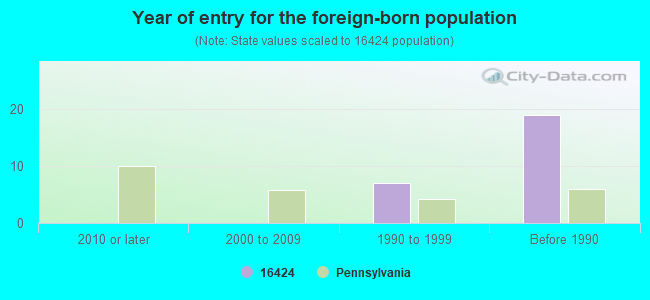
Foreign born population: 19 (0.5%) (69.3% of them are naturalized citizens)
This zip code:
0.5%
Whole state:
7.5%
32%Guatemala
26%France
11%United Kingdom, excluding England and Scotland
5%Sweden
5%Japan
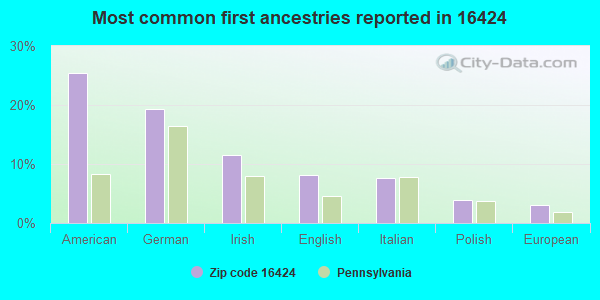
25%American
19%German
12%Irish
8%English
8%Italian
4%Polish
3%European
Year of entry for the foreign-born population
02010 or later
02000 to 2009
71990 to 1999
19Before 1990
Facilities with environmental interests located in this zip code:
ALICE SCHAFER EL SCH (220 WEST SCHOOL DRIVE in LINESVILLE, PA)
(National Center for Education Statistics) - STATE ID-7110 Organizations: CONNEAUT SD (SCHOOL DISTRICT)
Housing units lacking complete plumbing facilities: 3.1% Housing units lacking complete kitchen facilities: 3.9%
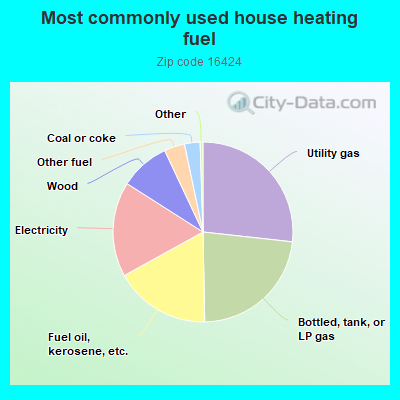
26.8%Utility gas
23.0%Bottled, tank, or LP gas
17.3%Fuel oil, kerosene, etc.
17.1%Electricity
9.0%Wood
3.7%Other fuel
2.8%Coal or coke
Population in 1990: 5,520.
Place of birth for U.S.-born residents:
This state: 3,220
Northeast: 103
Midwest: 710
South: 223
West: 70
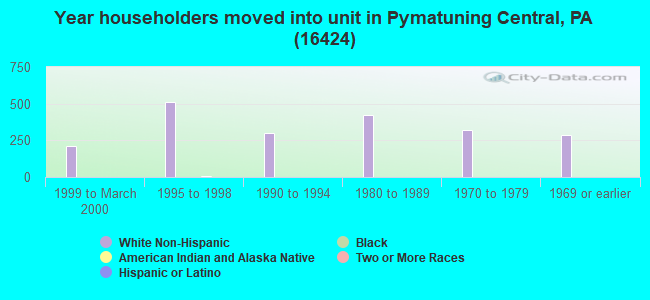
66% of the 16424 zip code residents lived in the same house 5 years ago. Out of people who lived in different houses, 55% lived in this county. Out of people who lived in different counties, 50% lived in Pennsylvania.
93% of the 16424 zip code residents lived in the same house 1 year ago. Out of people who lived in different houses, 38% moved from this county. Out of people who lived in different houses, 43% moved from different county within same state. Out of people who lived in different houses, 20% moved from different state.
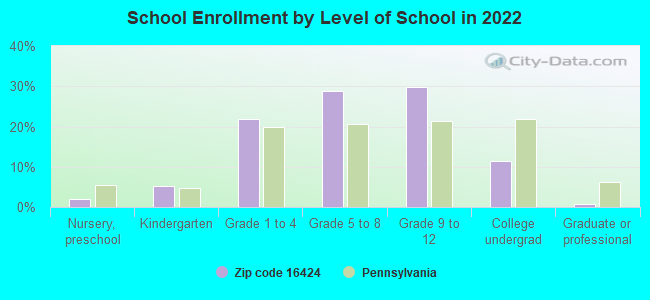
Private vs. public school enrollment:
Students in private schools in grades 1 to 8 (elementary and middle school): 45
Here:
13.1%
Pennsylvania:
15.7%
Students in private schools in grades 9 to 12 (high school): 20
Here:
9.8%
Pennsylvania:
13.4%
Students in private undergraduate colleges: 22
Here:
28.2%
Pennsylvania:
39.8%
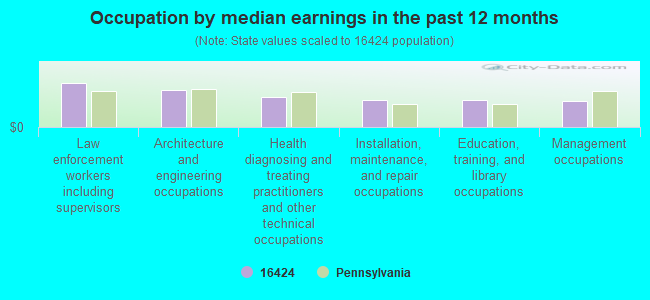
Occupation by median earnings in the past 12 months ($)
100,084Law enforcement workers including supervisors
83,178Architecture and engineering occupations
68,653Health diagnosing and treating practitioners and other technical occupations
61,896Installation, maintenance, and repair occupations
61,079Education, training, and library occupations
59,101Management occupations
Top industries in this zip code by the number of employees in 2005:
Administrative and Support and Waste Management and Remediation Services: Janitorial Services (20-49 employees: 1 establishment, 1-4 employees: 1 establishment)
Other Services (except Public Administration): Labor Unions and Similar Labor Organizations (20-49: 1)
Other Services (except Public Administration): Religious Organizations (5-9: 2, 1-4: 4)
People in group quarters in 2000:
32 people in nursing homes
2 people in religious group quarters
Fatal accident statistics in 2013:
Fatal accident count: 2
Vehicles involved in fatal accidents: 2
Fatal accidents caused by drunken drivers: 2
Fatalities: 2
Persons involved in fatal accidents: 5
Pedestrians involved in fatal accidents: 0
Fatal accident statistics in 2012:
Fatal accident count: 1
Vehicles involved in fatal accidents: 1
Fatal accidents caused by drunken drivers: 1
Fatalities: 1
Persons involved in fatal accidents: 1
Pedestrians involved in fatal accidents: 0
2006 - 2018 National Fire Incident Reporting System (NFIRS) incidents
According to the data from the years 2006 - 2018 the average number of fires per year is 23. The highest number of fire incidents - 47 took place in 2017, and the least - 2 in 2006. The data has a growing trend.
When looking into fire subcategories, the most incidents belonged to: Structure Fires (73.2%), and Outside Fires (11.9%).
Fire incident types reported to NFIRS in Zip Code 16424
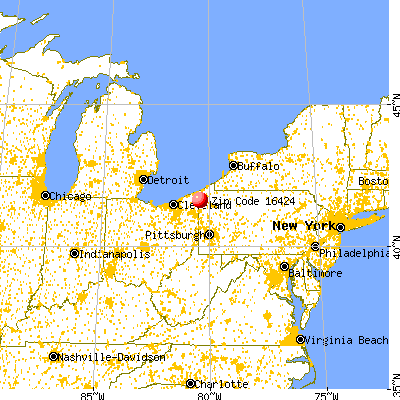


 Nearest zip codes: 16406, 16131, 16422, 16134, 16316, 44003.


 According to the data from the years 2006 - 2018 the average number of fires per year is 23. The highest number of fire incidents - 47 took place in 2017, and the least - 2 in 2006. The data has a growing trend.
 When looking into fire subcategories, the most incidents belonged to: Structure Fires (73.2%), and Outside Fires (11.9%).