Estimated zip code population in 2022: 1,079 Zip code population in 2010: 742 Zip code population in 2000: 851
Houses and condos: 396 Renter-occupied apartments: 19
% of renters here:
5%
State:
31%
March 2022 cost of living index in zip code 16636: 92.5 (less than average, U.S. average is 100)
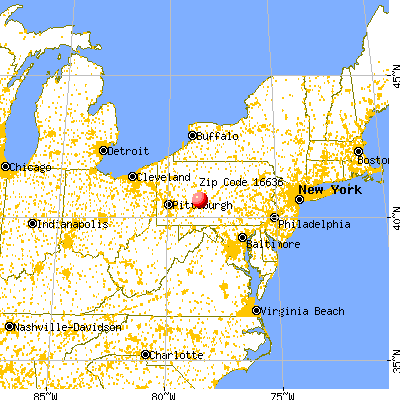
Land area: 28.1 sq. mi. Water area: 0.0 sq. mi.
Population density: 38 people per square mile
(very low).
OSM Map
General Map
Google Map
MSN Map
OSM Map
General Map
Google Map
MSN Map
OSM Map
General Map
Google Map
MSN Map
OSM Map
General Map
Google Map
MSN Map
Please wait while loading the map...
Real estate property taxes paid for housing units in 2022:
This zip code:
0.6% ($1,434)
Pennsylvania:
1.3% ($3,094)
Median real estate property taxes paid for housing units with mortgages in 2022: $1,436 (0.7%) Median real estate property taxes paid for housing units with no mortgage in 2022: $1,436 (0.6%)
Business Search- 14 Million verified businesses
Males: 473
(43.8%)
Females: 606
(56.2%)
For population 25 years and over in 16636:
High school or higher: 98.3%
Bachelor's degree or higher: 31.5%
Graduate or professional degree: 9.2%
Unemployed: 4.6%
Mean travel time to work (commute): 25.9 minutes
For population 15 years and over in 16636:
Never married: 19.3%
Now married: 68.9%
Separated: 0.9%
Widowed: 5.6%
Divorced: 5.3%
Zip code 16636 compared to state average:
Black race population percentage significantly below state average.
Hispanic race population percentage significantly below state average.
Median age below state average.
Foreign-born population percentage significantly below state average.
Renting percentage significantly below state average.
Length of stay since moving in significantly above state average.
Number of college students significantly below state average.
Estimated median house/condo value in 2022: $223,902
16636:
$223,902
Pennsylvania:
$245,500
According to our research of Pennsylvania and other state lists, there was 1 registered sex offender living in 16636 zip code as of June 19, 2024. The ratio of all residents to sex offenders in zip code 16636 is 734 to 1. The ratio of registered sex offenders to all residents in this zip code is near the state average.
Median resident age:
This zip code:
36.7 years
Pennsylvania median age:
40.9 years
Average household size:
This zip code:
3.0 people
Pennsylvania:
2.4 people
Averages for the 2020 tax year for zip code 16636, filed in 2021:
Average Adjusted Gross Income (AGI) in 2020: $61,868 (Individual Income Tax Returns)
Here:
$61,868
State:
$75,707
Salary/wage: $55,533 (reported on 82.5% of returns)
Here:
$55,533
State:
$62,806
(% of AGI for various income ranges: 1182.9% for AGIs below $25k, 3352.9% for AGIs $25k-50k, 5046.0% for AGIs $50k-75k, 8092.5% for AGIs $75k-100k, 18782.0% for AGIs $100k-200k)
Taxable interest for individuals: $377 (reported on 32.5% of returns)
This zip code:
$377
Pennsylvania:
$1,633
(% of AGI for various income ranges: 28.6% for AGIs below $25k, 8.0% for AGIs $50k-75k, 37.5% for AGIs $75k-100k, 20.0% for AGIs $100k-200k)
Ordinary dividends: $2,425 (reported on 20.0% of returns)
Here:
$2,425
State:
$7,382
(% of AGI for various income ranges: 124.0% for AGIs $50k-75k, 264.0% for AGIs $100k-200k)
Net capital gain/loss in AGI: +$1,943 (reported on 17.5% of returns)
Here:
+$1,943
State:
+$23,522
(% of AGI for various income ranges: 372.5% for AGIs $75k-100k)
Profit/loss from business: +$700 (reported on 10.0% of returns)
Here:
+$700
State:
+$16,274
(% of AGI for various income ranges: 70.0% for AGIs $75k-100k)
Taxable individual retirement arrangement distribution: $10,640 (reported on 12.5% of returns)
16636:
$10,640
Pennsylvania:
$18,583
(% of AGI for various income ranges: 311.4% for AGIs below $25k, 628.0% for AGIs $50k-75k)
Earned income credit: $1,475 (reported on 10.0% of returns)
Here:
$1,475
State:
$2,100
(% of AGI for various income ranges: 84.3% for AGIs below $25k)
Percentage of individuals using paid preparers for their 2020 taxes: 97.5%
Here:
98%
State:
92%
(% for various income ranges: 100.0% for AGIs below $25k, 88.9% for AGIs $25k-50k, 100.0% for AGIs $50k-75k, 100.0% for AGIs $75k-100k, 100.0% for AGIs $100k-200k)
Averages for the 2012 tax year for zip code 16636, filed in 2013:
Average Adjusted Gross Income (AGI) in 2012: $45,872 (Individual Income Tax Returns)
Here:
$45,872
State:
$61,346
Salary/wage: $44,109 (reported on 84.6% of returns)
Here:
$44,109
State:
$51,902
(% of AGI for various income ranges: 62.8% for AGIs below $25k, 75.5% for AGIs $25k-50k, 86.8% for AGIs $50k-75k, 79.2% for AGIs $75k-100k, 88.9% for AGIs $100k-200k)
Taxable interest for individuals: $413 (reported on 38.5% of returns)
This zip code:
$413
Pennsylvania:
$1,588
(% of AGI for various income ranges: 1.5% for AGIs below $25k, 0.2% for AGIs $25k-50k, 0.3% for AGIs $50k-75k, 0.5% for AGIs $75k-100k, 0.1% for AGIs $100k-200k)
Ordinary dividends: $925 (reported on 20.5% of returns)
Here:
$925
State:
$5,827
(% of AGI for various income ranges: 1.9% for AGIs below $25k, 0.6% for AGIs $25k-50k, 0.6% for AGIs $75k-100k)
Net capital gain/loss in AGI: +$20 (reported on 12.8% of returns)
Here:
+$20
State:
+$14,495
Profit/loss from business: +$6,375 (reported on 10.3% of returns)
Here:
+$6,375
State:
+$16,268
Taxable individual retirement arrangement distribution: $6,075 (reported on 10.3% of returns)
16636:
$6,075
Pennsylvania:
$14,550
Total itemized deductions: $18,929 (20% of AGI, reported on 17.9% of returns)
Here:
$18,929
State:
$23,538
Here:
20.1% of AGI
State:
18.4% of AGI
(% of AGI for various income ranges: 11.1% for AGIs $25k-50k, 10.8% for AGIs $75k-100k, 9.9% for AGIs $100k-200k)
Charity contributions: $1,233 (reported on 15.4% of returns)
Here:
$1,233
State:
$4,025
Taxes paid: $6,186 (reported on 17.9% of returns)
16636:
$6,186
State:
$9,982
(% of AGI for various income ranges: 3.2% for AGIs $25k-50k, 3.0% for AGIs $75k-100k, 4.0% for AGIs $100k-200k)
Earned income credit: $1,200 (reported on 10.3% of returns)
Here:
$1,200
State:
$2,106
(% of AGI for various income ranges: 3.5% for AGIs below $25k)
Percentage of individuals using paid preparers for their 2012 taxes: 71.8%
Here:
72%
State:
53%
(% for various income ranges: 69.2% for AGIs below $25k, 72.7% for AGIs $25k-50k, 83.3% for AGIs $50k-75k, 80.0% for AGIs $75k-100k, 50.0% for AGIs $100k-200k)
Averages for the 2004 tax year for zip code 16636, filed in 2005:
Average Adjusted Gross Income (AGI) in 2004: $35,749 (Individual Income Tax Returns)
Here:
$35,749
State:
$48,049
Salary/wage: $34,392 (reported on 80.7% of returns)
Here:
$34,392
State:
$42,646
(% of AGI for various income ranges: 80.8% for AGIs below $10k, 61.4% for AGIs $10k-25k, 79.2% for AGIs $25k-50k, 81.1% for AGIs $50k-75k, 85.6% for AGIs $75k-100k, 70.0% for AGIs over 100k)
Taxable interest for individuals: $959 (reported on 50.9% of returns)
This zip code:
$959
Pennsylvania:
$1,657
(% of AGI for various income ranges: 4.9% for AGIs below $10k, 5.0% for AGIs $10k-25k, 1.1% for AGIs $25k-50k, 1.1% for AGIs $50k-75k, 0.5% for AGIs $75k-100k)
Taxable dividends: $1,292 (reported on 23.2% of returns)
Here:
$1,292
State:
$3,566
(% of AGI for various income ranges: 2.3% for AGIs below $10k, 4.4% for AGIs $10k-25k, 0.7% for AGIs $25k-50k, 0.2% for AGIs $50k-75k, 0.3% for AGIs $75k-100k)
Net capital gain/loss: +$316 (reported on 14.9% of returns)
Here:
+$316
State:
+$9,716
(% of AGI for various income ranges: -4.9% for AGIs below $10k, 0.6% for AGIs $10k-25k, 0.6% for AGIs $25k-50k, 0.2% for AGIs $75k-100k)
Profit/loss from business: +$2,875 (reported on 10.4% of returns)
Here:
+$2,875
State:
+$14,267
Total itemized deductions: $14,400 (20% of AGI, reported on 19.6% of returns)
Here:
$14,400
State:
$18,804
Here:
20.3% of AGI
State:
19.5% of AGI
(% of AGI for various income ranges: 7.9% for AGIs $25k-50k, 10.0% for AGIs $50k-75k, 9.2% for AGIs $75k-100k, 9.5% for AGIs over 100k)
Charity contributions deductions: $1,286 (2% of AGI, reported on 14.6% of returns)
Here:
$1,286
State:
$3,337
Here:
1.6% of AGI
State:
3.3% of AGI
(% of AGI for various income ranges: 0.5% for AGIs $10k-25k, 0.8% for AGIs $50k-75k, 0.9% for AGIs $75k-100k, 0.7% for AGIs over 100k)
Total tax: $4,403 (reported on 73.9% of returns)
16636:
$4,403
State:
$8,008
(% of AGI for various income ranges: 1.7% for AGIs below $10k, 4.0% for AGIs $10k-25k, 6.5% for AGIs $25k-50k, 8.1% for AGIs $50k-75k, 11.1% for AGIs $75k-100k, 19.3% for AGIs over 100k)
Earned income credit: $1,350 (reported on 10.4% of returns)
Here:
$1,350
State:
$1,643
Percentage of individuals using paid preparers for their 2004 taxes: 66.3%
Here:
66%
State:
56%
(% for various income ranges: 61.9% for AGIs below $10k, 64.9% for AGIs $10k-25k, 62.0% for AGIs $25k-50k, 74.2% for AGIs $50k-75k, 70.4% for AGIs $75k-100k, 91.7% for AGIs over 100k)
Household received Food Stamps/SNAP in the past 12 months: 19 Household did not receive Food Stamps/SNAP in the past 12 months: 339
Women who had a birth in the past 12 months: 33 (34 now married, 0 unmarried) Women who did not have a birth in the past 12 months: 179 (111 now married, 66 unmarried)
Housing units in zip code 16636 with a mortgage: 170 (6 second mortgage, 6 both second mortgage and home equity loan) Houses without a mortgage: 16
Median monthly owner costs for units with a mortgage: $1,303 Median monthly owner costs for units without a mortgage: $431
Residents with income below the poverty level in 2022:
This zip code:
3.1%
Whole state:
11.8%
Residents with income below 50% of the poverty level in 2022:
This zip code:
0.5%
Whole state:
6.1%
Median number of rooms in houses and condos:
Here:
6.9
State:
6.8
Median number of rooms in apartments:
Here:
6.1
State:
4.3
Notable locations in this zip code not listed on our city pages
Size of family households: 124 2-persons, 29 3-persons, 58 4-persons, 75 5-persons, 2 6-persons
Size of nonfamily households: 56 1-person, 11 2-persons
341 married couples with children.
4 single-parent households (3 men, 1 women).
98.4% of residents of 16636 zip code speak English at home.
0.4% of residents speak Spanish at home (100% very well).
0.2% of residents speak other Indo-European language at home (100% very well).
Foreign born population: 1 (0.1%) (0.0% of them are naturalized citizens)
:
0.1%
Whole state:
7.5%
38%German
20%American
15%Italian
4%Irish
3%English
1%Polish
0%Scottish
Year of entry for the foreign-born population
12010 or later
02000 to 2009
01990 to 1999
0Before 1990
Housing units lacking complete plumbing facilities: 3.7% Housing units lacking complete kitchen facilities: 0.7%
69.2%Fuel oil, kerosene, etc.
13.7%Wood
5.1%Bottled, tank, or LP gas
4.8%No fuel used
3.7%Electricity
3.1%Coal or coke
1.1%Utility gas
Population in 1990: 769. Population change in the 1990s: +82 (+10.7%).
Place of birth for U.S.-born residents:
This state: 992
Northeast: 23
Midwest: 22
South: 27
West: 3
79% of the 16636 zip code residents lived in the same house 5 years ago. Out of people who lived in different houses, 41% lived in this county. Out of people who lived in different counties, 50% lived in Pennsylvania.
94% of the 16636 zip code residents lived in the same house 1 year ago. Out of people who lived in different houses, 84% moved from this county. Out of people who lived in different houses, 14% moved from different county within same state.
Private vs. public school enrollment:
Students in private schools in grades 1 to 8 (elementary and middle school): 15
Here:
10.3%
Pennsylvania:
15.7%
Students in private schools in grades 9 to 12 (high school): 34
Here:
41.4%
Pennsylvania:
13.4%
Students in private undergraduate colleges:
Here:
0.0%
Pennsylvania:
39.8%
Occupation by median earnings in the past 12 months ($)
103,117Law enforcement workers including supervisors
87,712Management occupations
87,703Health diagnosing and treating practitioners and other technical occupations
73,925Construction and extraction occupations
61,536Transportation occupations
53,156Business and financial operations occupations
Top industries in this zip code by the number of employees in 2005:
Construction: Plumbing, Heating, and Air-Conditioning Contractors (10-19 employees: 1 establishment)
Construction: New Single-Family Housing Construction (except Operative Builders) (5-9: 1, 1-4: 1)
Accommodation and Food Services: Drinking Places (Alcoholic Beverages) (1-4: 2)
Construction: Highway, Street, and Bridge Construction (1-4: 1)
Construction: Electrical Contractors (1-4: 1)
Other Services (except Public Administration): Religious Organizations (1-4: 1)
Construction: Site Preparation Contractors (1-4: 1)
Administrative and Support and Waste Management and Remediation Services: Landscaping Services (1-4: 1)
People in group quarters in 2000:
11 people in other noninstitutional group quarters
Fatal accident statistics in 2014:
Fatal accident count: 1
Vehicles involved in fatal accidents: 1
Fatal accidents caused by drunken drivers: 1
Fatalities: 1
Persons involved in fatal accidents: 1
Pedestrians involved in fatal accidents: 0
Fatal accident statistics in 2012:
Fatal accident count: 1
Vehicles involved in fatal accidents: 1
Fatal accidents caused by drunken drivers: 1
Fatalities: 1
Persons involved in fatal accidents: 1
Pedestrians involved in fatal accidents: 0
Home Mortgage Disclosure Act Aggregated Statistics For Year 2009 (Based on 4 partial tracts)
A) FHA, FSA/RHS & VA Home Purchase Loans
B) Conventional Home Purchase Loans
C) Refinancings
D) Home Improvement Loans
F) Non-occupant Loans on < 5 Family Dwellings (A B C & D)
G) Loans On Manufactured Home Dwelling (A B C & D)
Number
Average Value
Number
Average Value
Number
Average Value
Number
Average Value
Number
Average Value
Number
Average Value
LOANS ORIGINATED
9
$95,304
25
$71,862
56
$85,712
25
$23,072
3
$53,690
6
$46,652
APPLICATIONS APPROVED, NOT ACCEPTED
1
$53,170
1
$33,090
3
$141,793
1
$9,750
0
$0
0
$0
APPLICATIONS DENIED
2
$96,410
6
$44,065
30
$70,704
18
$24,592
0
$0
2
$19,870
APPLICATIONS WITHDRAWN
1
$33,000
2
$61,905
15
$105,829
2
$35,700
1
$11,000
1
$61,890
FILES CLOSED FOR INCOMPLETENESS
1
$31,170
0
$0
2
$75,145
0
$0
0
$0
0
$0
Aggregated Statistics For Year 2008 (Based on 4 partial tracts)
A) FHA, FSA/RHS & VA Home Purchase Loans
B) Conventional Home Purchase Loans
C) Refinancings
D) Home Improvement Loans
E) Loans on Dwellings For 5+ Families
F) Non-occupant Loans on < 5 Family Dwellings (A B C & D)
G) Loans On Manufactured Home Dwelling (A B C & D)
Number
Average Value
Number
Average Value
Number
Average Value
Number
Average Value
Number
Average Value
Number
Average Value
Number
Average Value
LOANS ORIGINATED
13
$81,596
25
$82,677
49
$78,876
48
$30,534
2
$93,515
11
$57,832
7
$53,044
APPLICATIONS APPROVED, NOT ACCEPTED
0
$0
5
$90,074
4
$75,565
8
$24,216
0
$0
0
$0
1
$82,820
APPLICATIONS DENIED
0
$0
6
$30,967
56
$88,771
21
$47,559
0
$0
2
$19,605
2
$108,030
APPLICATIONS WITHDRAWN
1
$36,670
1
$36,780
15
$69,243
1
$114,560
0
$0
1
$9,170
0
$0
FILES CLOSED FOR INCOMPLETENESS
0
$0
2
$81,135
8
$141,202
1
$10,080
0
$0
0
$0
1
$118,270
Aggregated Statistics For Year 2007 (Based on 4 partial tracts)
A) FHA, FSA/RHS & VA Home Purchase Loans
B) Conventional Home Purchase Loans
C) Refinancings
D) Home Improvement Loans
F) Non-occupant Loans on < 5 Family Dwellings (A B C & D)
G) Loans On Manufactured Home Dwelling (A B C & D)
Number
Average Value
Number
Average Value
Number
Average Value
Number
Average Value
Number
Average Value
Number
Average Value
LOANS ORIGINATED
6
$74,345
44
$83,397
61
$65,592
51
$27,462
8
$42,464
8
$70,394
APPLICATIONS APPROVED, NOT ACCEPTED
1
$37,590
4
$35,955
13
$82,719
5
$27,382
1
$296,130
1
$33,490
APPLICATIONS DENIED
1
$78,340
15
$64,421
96
$77,365
42
$46,933
5
$34,326
11
$72,987
APPLICATIONS WITHDRAWN
0
$0
2
$44,280
30
$69,574
3
$70,687
2
$54,090
2
$31,105
FILES CLOSED FOR INCOMPLETENESS
0
$0
2
$41,255
10
$83,905
0
$0
0
$0
1
$117,350
Aggregated Statistics For Year 2006 (Based on 4 partial tracts)
A) FHA, FSA/RHS & VA Home Purchase Loans
B) Conventional Home Purchase Loans
C) Refinancings
D) Home Improvement Loans
F) Non-occupant Loans on < 5 Family Dwellings (A B C & D)
G) Loans On Manufactured Home Dwelling (A B C & D)
Number
Average Value
Number
Average Value
Number
Average Value
Number
Average Value
Number
Average Value
Number
Average Value
LOANS ORIGINATED
6
$69,688
48
$74,922
75
$69,985
66
$25,837
7
$44,370
9
$79,443
APPLICATIONS APPROVED, NOT ACCEPTED
0
$0
8
$85,639
13
$81,988
4
$22,905
1
$20,170
1
$104,520
APPLICATIONS DENIED
2
$38,290
14
$71,959
98
$71,722
32
$36,038
1
$14,650
5
$56,792
APPLICATIONS WITHDRAWN
0
$0
6
$58,530
41
$75,055
3
$40,643
0
$0
1
$96,460
FILES CLOSED FOR INCOMPLETENESS
0
$0
2
$51,585
8
$95,511
1
$45,840
1
$39,420
0
$0
Aggregated Statistics For Year 2005 (Based on 4 partial tracts)
A) FHA, FSA/RHS & VA Home Purchase Loans
B) Conventional Home Purchase Loans
C) Refinancings
D) Home Improvement Loans
E) Loans on Dwellings For 5+ Families
F) Non-occupant Loans on < 5 Family Dwellings (A B C & D)
G) Loans On Manufactured Home Dwelling (A B C & D)
Number
Average Value
Number
Average Value
Number
Average Value
Number
Average Value
Number
Average Value
Number
Average Value
Number
Average Value
LOANS ORIGINATED
3
$73,220
50
$75,882
63
$70,442
50
$26,230
0
$0
3
$33,633
10
$60,549
APPLICATIONS APPROVED, NOT ACCEPTED
0
$0
6
$50,870
30
$63,624
5
$47,830
0
$0
0
$0
1
$23,920
APPLICATIONS DENIED
0
$0
18
$63,692
102
$67,750
31
$32,556
0
$0
2
$59,025
14
$48,996
APPLICATIONS WITHDRAWN
0
$0
9
$74,551
54
$95,533
4
$66,960
1
$179,690
4
$75,568
4
$82,125
FILES CLOSED FOR INCOMPLETENESS
0
$0
1
$71,160
5
$120,192
0
$0
0
$0
1
$84,350
0
$0
Aggregated Statistics For Year 2004 (Based on 4 partial tracts)
A) FHA, FSA/RHS & VA Home Purchase Loans
B) Conventional Home Purchase Loans
C) Refinancings
D) Home Improvement Loans
F) Non-occupant Loans on < 5 Family Dwellings (A B C & D)
G) Loans On Manufactured Home Dwelling (A B C & D)
Number
Average Value
Number
Average Value
Number
Average Value
Number
Average Value
Number
Average Value
Number
Average Value
LOANS ORIGINATED
6
$62,862
51
$60,015
89
$60,316
57
$26,274
7
$37,167
8
$54,949
APPLICATIONS APPROVED, NOT ACCEPTED
1
$22,920
4
$71,838
28
$57,398
2
$18,460
0
$0
1
$90,920
APPLICATIONS DENIED
0
$0
20
$45,157
85
$67,107
25
$34,829
2
$23,230
12
$45,578
APPLICATIONS WITHDRAWN
0
$0
2
$92,425
48
$68,043
5
$76,710
0
$0
0
$0
FILES CLOSED FOR INCOMPLETENESS
1
$55,920
0
$0
15
$89,389
2
$112,460
0
$0
0
$0
Aggregated Statistics For Year 2003 (Based on 4 partial tracts)
A) FHA, FSA/RHS & VA Home Purchase Loans
B) Conventional Home Purchase Loans
C) Refinancings
D) Home Improvement Loans
F) Non-occupant Loans on < 5 Family Dwellings (A B C & D)
Number
Average Value
Number
Average Value
Number
Average Value
Number
Average Value
Number
Average Value
LOANS ORIGINATED
8
$69,616
47
$56,205
180
$56,804
50
$27,054
6
$40,682
APPLICATIONS APPROVED, NOT ACCEPTED
1
$43,090
2
$55,960
22
$60,396
3
$19,667
0
$0
APPLICATIONS DENIED
1
$56,210
15
$44,943
87
$70,667
15
$19,349
2
$67,345
APPLICATIONS WITHDRAWN
0
$0
3
$140,273
41
$66,412
2
$19,355
0
$0
FILES CLOSED FOR INCOMPLETENESS
0
$0
1
$32,290
4
$64,078
0
$0
0
$0
Aggregated Statistics For Year 2002 (Based on 4 partial tracts)
A) FHA, FSA/RHS & VA Home Purchase Loans
B) Conventional Home Purchase Loans
C) Refinancings
D) Home Improvement Loans
F) Non-occupant Loans on < 5 Family Dwellings (A B C & D)
Number
Average Value
Number
Average Value
Number
Average Value
Number
Average Value
Number
Average Value
LOANS ORIGINATED
7
$66,201
32
$49,897
97
$62,447
45
$20,459
4
$33,840
APPLICATIONS APPROVED, NOT ACCEPTED
1
$22,920
4
$61,320
24
$63,593
3
$16,910
0
$0
APPLICATIONS DENIED
1
$59,590
16
$55,406
73
$61,621
21
$11,301
2
$40,410
APPLICATIONS WITHDRAWN
2
$17,019,475
2
$51,255
30
$1,372,648
1
$18,240
0
$0
FILES CLOSED FOR INCOMPLETENESS
0
$0
1
$48,140
9
$82,866
1
$27,500
0
$0
Aggregated Statistics For Year 2001 (Based on 4 partial tracts)
A) FHA, FSA/RHS & VA Home Purchase Loans
B) Conventional Home Purchase Loans
C) Refinancings
D) Home Improvement Loans
F) Non-occupant Loans on < 5 Family Dwellings (A B C & D)
Number
Average Value
Number
Average Value
Number
Average Value
Number
Average Value
Number
Average Value
LOANS ORIGINATED
12
$52,432
38
$73,219
97
$51,405
69
$17,837
7
$39,064
APPLICATIONS APPROVED, NOT ACCEPTED
2
$38,505
9
$36,187
23
$48,211
4
$16,348
0
$0
APPLICATIONS DENIED
1
$38,510
19
$54,086
92
$49,204
19
$17,168
2
$62,575
APPLICATIONS WITHDRAWN
0
$0
3
$54,867
33
$60,057
13
$18,415
1
$42,170
FILES CLOSED FOR INCOMPLETENESS
0
$0
1
$52,260
7
$72,911
1
$32,290
0
$0
Aggregated Statistics For Year 2000 (Based on 4 partial tracts)
A) FHA, FSA/RHS & VA Home Purchase Loans
B) Conventional Home Purchase Loans
C) Refinancings
D) Home Improvement Loans
F) Non-occupant Loans on < 5 Family Dwellings (A B C & D)
Number
Average Value
Number
Average Value
Number
Average Value
Number
Average Value
Number
Average Value
LOANS ORIGINATED
6
$55,925
38
$46,588
43
$41,971
47
$12,981
7
$32,994
APPLICATIONS APPROVED, NOT ACCEPTED
0
$0
5
$64,742
21
$50,057
4
$37,710
0
$0
APPLICATIONS DENIED
3
$54,397
18
$34,681
55
$41,531
18
$14,751
0
$0
APPLICATIONS WITHDRAWN
0
$0
9
$40,804
27
$50,019
7
$30,859
2
$21,125
FILES CLOSED FOR INCOMPLETENESS
0
$0
0
$0
2
$69,415
3
$26,587
0
$0
Aggregated Statistics For Year 1999 (Based on 2 partial tracts)
A) FHA, FSA/RHS & VA Home Purchase Loans
B) Conventional Home Purchase Loans
C) Refinancings
D) Home Improvement Loans
F) Non-occupant Loans on < 5 Family Dwellings (A B C & D)


 Nearest zip codes: 16613, 16619, 16624, 16639, 16641, 16640.


