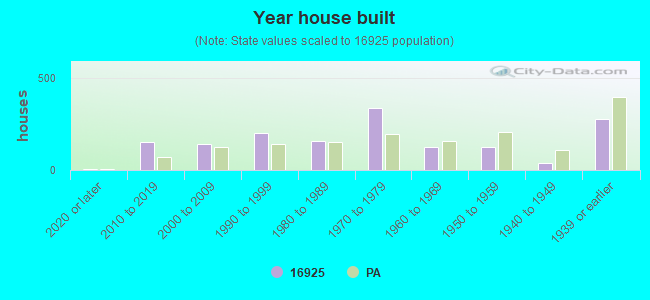
Estimated zip code population in 2022: 3,325 Zip code population in 2010: 3,186 Zip code population in 2000: 3,471
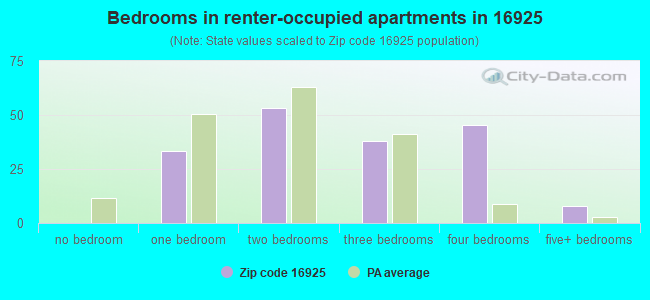
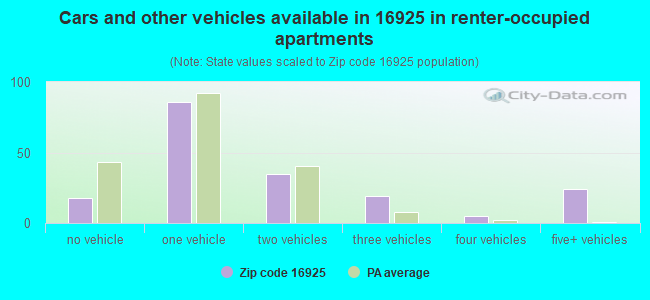
Houses and condos: 1,563 Renter-occupied apartments: 181
% of renters here:
15%
State:
31%
March 2022 cost of living index in zip code 16925: 91.4 (less than average, U.S. average is 100)
Land area: 77.2 sq. mi. Water area: 0.2 sq. mi.
Population density: 43 people per square mile
(very low).
OSM Map
General Map
Google Map
MSN Map
OSM Map
General Map
Google Map
MSN Map
OSM Map
General Map
Google Map
MSN Map
OSM Map
General Map
Google Map
MSN Map
Please wait while loading the map...
Real estate property taxes paid for housing units in 2022:
This zip code:
0.9% ($1,709)
Pennsylvania:
1.3% ($3,094)
Median real estate property taxes paid for housing units with mortgages in 2022: $1,758 (0.9%) Median real estate property taxes paid for housing units with no mortgage in 2022: $1,661 (0.9%)
Business Search- 14 Million verified businesses
Males: 1,754
(52.7%)
Females: 1,571
(47.3%)
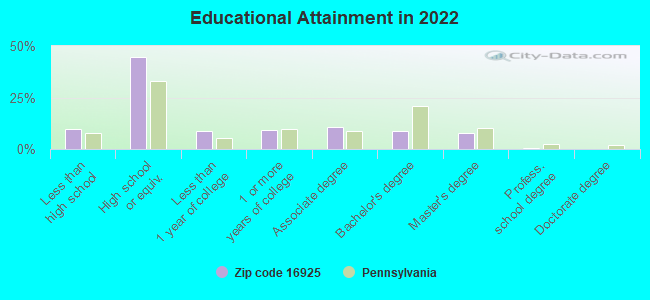
For population 25 years and over in 16925:
High school or higher: 89.7%
Bachelor's degree or higher: 16.8%
Graduate or professional degree: 8.1%
Unemployed: 1.8%
Mean travel time to work (commute): 30.1 minutes
For population 15 years and over in 16925:
Never married: 20.2%
Now married: 61.2%
Separated: 1.0%
Widowed: 7.5%
Divorced: 10.1%
Zip code 16925 compared to state average:
Unemployed percentage below state average.
Black race population percentage significantly below state average.
Hispanic race population percentage significantly below state average.
Median age above state average.
Foreign-born population percentage significantly below state average.
Renting percentage below state average.
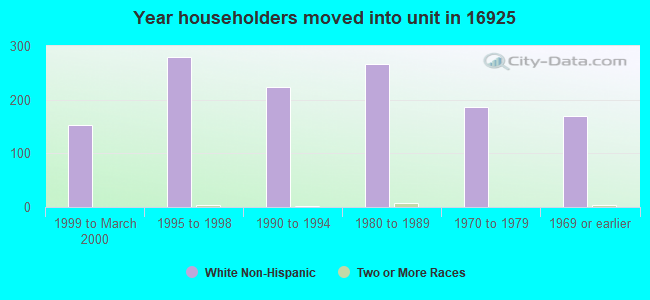
Length of stay since moving in significantly above state average.
Number of college students below state average.
Percentage of population with a bachelor's degree or higher below state average.
Averages for the 2020 tax year for zip code 16925, filed in 2021:
Average Adjusted Gross Income (AGI) in 2020: $54,530 (Individual Income Tax Returns)
Here:
$54,530
State:
$75,707
Salary/wage: $50,104 (reported on 79.2% of returns)
Here:
$50,104
State:
$62,806
(% of AGI for various income ranges: 1056.5% for AGIs below $25k, 3113.1% for AGIs $25k-50k, 5706.8% for AGIs $50k-75k, 9134.2% for AGIs $75k-100k, 14190.0% for AGIs $100k-200k)
Taxable interest for individuals: $785 (reported on 34.9% of returns)
This zip code:
$785
Pennsylvania:
$1,633
(% of AGI for various income ranges: 13.2% for AGIs below $25k, 38.4% for AGIs $25k-50k, 32.6% for AGIs $50k-75k, 63.3% for AGIs $75k-100k, 61.4% for AGIs $100k-200k)
Ordinary dividends: $2,519 (reported on 17.4% of returns)
Here:
$2,519
State:
$7,382
(% of AGI for various income ranges: 36.5% for AGIs below $25k, 37.2% for AGIs $25k-50k, 60.0% for AGIs $50k-75k, 70.0% for AGIs $75k-100k, 160.7% for AGIs $100k-200k)
Net capital gain/loss in AGI: +$4,547 (reported on 12.8% of returns)
Here:
+$4,547
State:
+$23,522
(% of AGI for various income ranges: 23.5% for AGIs below $25k, 38.4% for AGIs $25k-50k, 27.4% for AGIs $50k-75k, 185.0% for AGIs $75k-100k, 281.4% for AGIs $100k-200k)
Profit/loss from business: +$5,500 (reported on 12.1% of returns)
Here:
+$5,500
State:
+$16,274
(% of AGI for various income ranges: 36.8% for AGIs below $25k, 76.9% for AGIs $25k-50k, 54.2% for AGIs $50k-75k, 376.4% for AGIs $100k-200k)
Taxable individual retirement arrangement distribution: $13,269 (reported on 10.7% of returns)
16925:
$13,269
Pennsylvania:
$18,583
(% of AGI for various income ranges: 102.9% for AGIs below $25k, 144.4% for AGIs $25k-50k, 358.9% for AGIs $50k-75k, 471.4% for AGIs $100k-200k)
Total itemized deductions: $23,200 (reported on 2.7% of returns)
Here:
$23,200
State:
$34,850
(% of AGI for various income ranges: 773.3% for AGIs $75k-100k)
Taxes paid: $7,725 (reported on 2.7% of returns)
16925:
$7,725
State:
$8,200
(% of AGI for various income ranges: 257.5% for AGIs $75k-100k)
Earned income credit: $2,295 (reported on 14.8% of returns)
Here:
$2,295
State:
$2,100
(% of AGI for various income ranges: 96.1% for AGIs below $25k, 64.7% for AGIs $25k-50k)
Percentage of individuals using paid preparers for their 2020 taxes: 96.6%
Here:
97%
State:
92%
(% for various income ranges: 95.7% for AGIs below $25k, 97.5% for AGIs $25k-50k, 95.8% for AGIs $50k-75k, 94.1% for AGIs $75k-100k, 100.0% for AGIs $100k-200k, 100.0% for AGIs over 200k)
Averages for the 2012 tax year for zip code 16925, filed in 2013:
Average Adjusted Gross Income (AGI) in 2012: $46,470 (Individual Income Tax Returns)
Here:
$46,470
State:
$61,346
Salary/wage: $42,858 (reported on 82.2% of returns)
Here:
$42,858
State:
$51,902
(% of AGI for various income ranges: 71.0% for AGIs below $25k, 75.5% for AGIs $25k-50k, 81.6% for AGIs $50k-75k, 77.1% for AGIs $75k-100k, 71.6% for AGIs $100k-200k)
Taxable interest for individuals: $798 (reported on 36.3% of returns)
This zip code:
$798
Pennsylvania:
$1,588
(% of AGI for various income ranges: 1.4% for AGIs below $25k, 1.1% for AGIs $25k-50k, 0.3% for AGIs $50k-75k, 0.5% for AGIs $75k-100k, 0.4% for AGIs $100k-200k)
Ordinary dividends: $1,938 (reported on 19.9% of returns)
Here:
$1,938
State:
$5,827
(% of AGI for various income ranges: 1.7% for AGIs below $25k, 0.5% for AGIs $25k-50k, 0.8% for AGIs $50k-75k, 1.0% for AGIs $75k-100k, 0.5% for AGIs $100k-200k)
Net capital gain/loss in AGI: +$2,795 (reported on 13.0% of returns)
Here:
+$2,795
State:
+$14,495
(% of AGI for various income ranges: 0.9% for AGIs $25k-50k, 1.0% for AGIs $75k-100k, 1.5% for AGIs $100k-200k)
Profit/loss from business: +$7,770 (reported on 15.8% of returns)
Here:
+$7,770
State:
+$16,268
(% of AGI for various income ranges: 5.0% for AGIs below $25k, 3.0% for AGIs $25k-50k, 2.6% for AGIs $50k-75k, 2.7% for AGIs $75k-100k, 1.5% for AGIs $100k-200k)
Taxable individual retirement arrangement distribution: $11,369 (reported on 11.0% of returns)
16925:
$11,369
Pennsylvania:
$14,550
(% of AGI for various income ranges: 4.3% for AGIs below $25k, 2.5% for AGIs $25k-50k, 1.8% for AGIs $50k-75k, 6.7% for AGIs $75k-100k)
Total itemized deductions: $17,314 (20% of AGI, reported on 19.2% of returns)
Here:
$17,314
State:
$23,538
Here:
19.8% of AGI
State:
18.4% of AGI
(% of AGI for various income ranges: 6.1% for AGIs $25k-50k, 6.6% for AGIs $50k-75k, 7.6% for AGIs $75k-100k, 10.6% for AGIs $100k-200k)
Charity contributions: $3,284 (reported on 13.0% of returns)
Here:
$3,284
State:
$4,025
(% of AGI for various income ranges: 0.8% for AGIs $25k-50k, 0.9% for AGIs $50k-75k, 1.2% for AGIs $75k-100k, 1.1% for AGIs $100k-200k)
Taxes paid: $6,900 (reported on 19.2% of returns)
16925:
$6,900
State:
$9,982
(% of AGI for various income ranges: 1.6% for AGIs $25k-50k, 2.1% for AGIs $50k-75k, 3.0% for AGIs $75k-100k, 5.3% for AGIs $100k-200k)
Earned income credit: $2,108 (reported on 17.8% of returns)
Here:
$2,108
State:
$2,106
(% of AGI for various income ranges: 5.8% for AGIs below $25k, 1.2% for AGIs $25k-50k)
Percentage of individuals using paid preparers for their 2012 taxes: 69.2%
Here:
69%
State:
53%
(% for various income ranges: 57.1% for AGIs below $25k, 71.4% for AGIs $25k-50k, 76.9% for AGIs $50k-75k, 81.2% for AGIs $75k-100k, 84.6% for AGIs $100k-200k)
Averages for the 2004 tax year for zip code 16925, filed in 2005:
Average Adjusted Gross Income (AGI) in 2004: $33,967 (Individual Income Tax Returns)
Here:
$33,967
State:
$48,049
Salary/wage: $31,736 (reported on 85.0% of returns)
Here:
$31,736
State:
$42,646
(% of AGI for various income ranges: 92.0% for AGIs below $10k, 71.4% for AGIs $10k-25k, 83.4% for AGIs $25k-50k, 83.9% for AGIs $50k-75k, 82.0% for AGIs $75k-100k, 63.9% for AGIs over 100k)
Taxable interest for individuals: $869 (reported on 45.4% of returns)
This zip code:
$869
Pennsylvania:
$1,657
(% of AGI for various income ranges: 3.7% for AGIs below $10k, 2.5% for AGIs $10k-25k, 1.1% for AGIs $25k-50k, 0.6% for AGIs $50k-75k, 1.2% for AGIs $75k-100k, 0.6% for AGIs over 100k)
Taxable dividends: $1,126 (reported on 21.4% of returns)
Here:
$1,126
State:
$3,566
(% of AGI for various income ranges: 3.7% for AGIs below $10k, 1.3% for AGIs $10k-25k, 0.4% for AGIs $25k-50k, 0.6% for AGIs $50k-75k, 0.5% for AGIs $75k-100k, 0.5% for AGIs over 100k)
Net capital gain/loss: +$4,870 (reported on 16.0% of returns)
Here:
+$4,870
State:
+$9,716
(% of AGI for various income ranges: -0.6% for AGIs below $10k, 2.2% for AGIs $10k-25k, 0.7% for AGIs $25k-50k, 2.4% for AGIs $50k-75k, 0.3% for AGIs $75k-100k, 8.2% for AGIs over 100k)
Profit/loss from business: +$6,272 (reported on 15.8% of returns)
Here:
+$6,272
State:
+$14,267
(% of AGI for various income ranges: 11.1% for AGIs below $10k, 5.0% for AGIs $10k-25k, 2.3% for AGIs $25k-50k, 3.7% for AGIs $50k-75k, 1.7% for AGIs $75k-100k)
IRA payment deduction: $3,050 (reported on 2.7% of returns)
16925:
$3,050
Pennsylvania:
$2,903
Total itemized deductions: $13,548 (21% of AGI, reported on 18.8% of returns)
Here:
$13,548
State:
$18,804
Here:
20.6% of AGI
State:
19.5% of AGI
(% of AGI for various income ranges: 4.3% for AGIs $10k-25k, 7.4% for AGIs $25k-50k, 7.5% for AGIs $50k-75k, 10.6% for AGIs $75k-100k, 9.4% for AGIs over 100k)
Charity contributions deductions: $2,588 (4% of AGI, reported on 14.9% of returns)
Here:
$2,588
State:
$3,337
Here:
3.7% of AGI
State:
3.3% of AGI
(% of AGI for various income ranges: 0.2% for AGIs $10k-25k, 0.6% for AGIs $25k-50k, 1.2% for AGIs $50k-75k, 2.8% for AGIs $75k-100k, 1.6% for AGIs over 100k)
Total tax: $4,084 (reported on 69.9% of returns)
16925:
$4,084
State:
$8,008
(% of AGI for various income ranges: 2.8% for AGIs below $10k, 3.6% for AGIs $10k-25k, 5.8% for AGIs $25k-50k, 8.5% for AGIs $50k-75k, 11.1% for AGIs $75k-100k, 17.3% for AGIs over 100k)
Earned income credit: $1,709 (reported on 17.9% of returns)
Here:
$1,709
State:
$1,643
Percentage of individuals using paid preparers for their 2004 taxes: 73.6%
Here:
74%
State:
56%
(% for various income ranges: 61.3% for AGIs below $10k, 78.1% for AGIs $10k-25k, 72.8% for AGIs $25k-50k, 78.0% for AGIs $50k-75k, 87.0% for AGIs $75k-100k, 82.5% for AGIs over 100k)
Household received Food Stamps/SNAP in the past 12 months: 135 Household did not receive Food Stamps/SNAP in the past 12 months: 1,115
Women who had a birth in the past 12 months: 36 (27 now married, 9 unmarried) Women who did not have a birth in the past 12 months: 560 (329 now married, 226 unmarried)
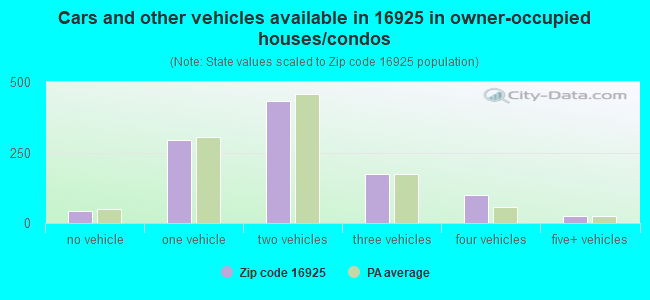
Housing units in zip code 16925 with a mortgage: 560 (45 second mortgage, 45 both second mortgage and home equity loan) Houses without a mortgage: 47
Median monthly owner costs for units with a mortgage: $1,257 Median monthly owner costs for units without a mortgage: $441
Residents with income below the poverty level in 2022:
This zip code:
11.4%
Whole state:
11.8%
Residents with income below 50% of the poverty level in 2022:
This zip code:
8.6%
Whole state:
6.1%
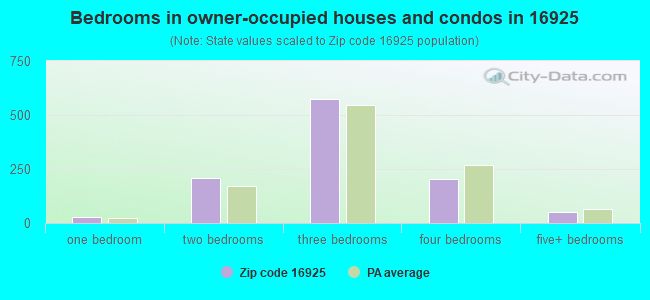
Median number of rooms in houses and condos:
Here:
6.5
State:
6.8
Median number of rooms in apartments:
Here:
5.0
State:
4.3
Notable locations in this zip code not listed on our city pages
Notable locations in zip code 16925: South Creek Volunteer Fire Department Station 2 (A), South Creek Volunteer Fire Department Station 1 (B), Ridgebury Volunteer Fire Company (C). Display/hide their locations on the map
Streams, rivers, and creeks: Canaan Run (A), Justice Run (B), Trout Creek (C), Terwiliger Creek (D), Miller Run (E), Threefall Run (F), Roaring Run (G), Buck Creek (H). Display/hide their locations on the map
Size of family households: 483 2-persons, 112 3-persons, 170 4-persons, 81 5-persons, 46 6-persons, 22 7-or-more-persons
Size of nonfamily households: 258 1-person, 75 2-persons, 3 3-persons
526 married couples with children.
212 single-parent households (103 men, 109 women).
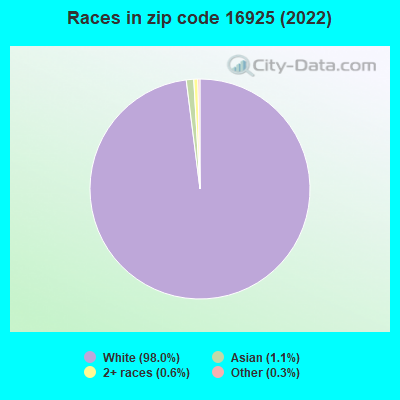
98.0% of residents of 16925 zip code speak English at home.
0.4% of residents speak Spanish at home (100% very well).
1.3% of residents speak Asian or Pacific Island language at home (70% very well, 30% not at all).
Foreign born population: 53 (1.6%) (75.3% of them are naturalized citizens)
This zip code:
1.6%
Whole state:
7.5%
69%Thailand
6%Sweden
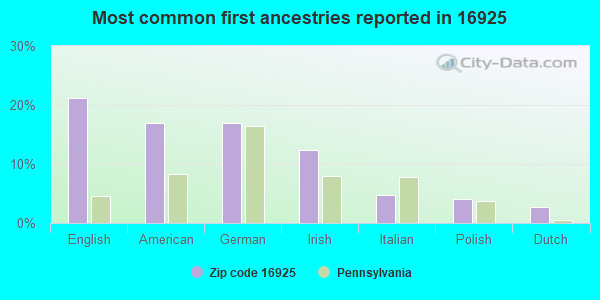
21%English
17%American
17%German
12%Irish
5%Italian
4%Polish
3%Dutch
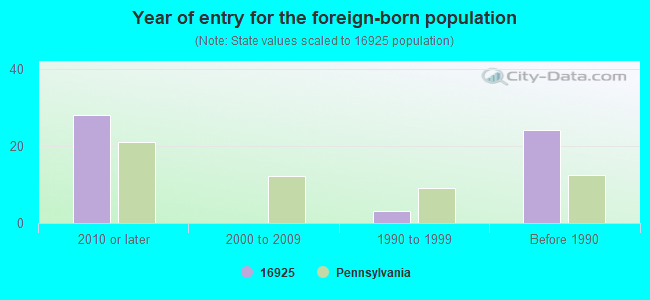
Year of entry for the foreign-born population
282010 or later
02000 to 2009
31990 to 1999
24Before 1990
Facilities with environmental interests located in this zip code:
ALLEN DELOSA (RR 7 BOX 466 in GILLETT, PA)
National Pollutant Discharge Elimination System NON-MAJOR (Tracking pollutant discharge elimination systems) - permit Business SIC classification: OPERATORS OF DWELLINGS OTHER THAN APARTMENT BUILDINGS Alternative names: DELOSA, ALLEN M
Housing units lacking complete plumbing facilities: 6.2% Housing units lacking complete kitchen facilities: 7.0%
41.9%Utility gas
17.6%Wood
14.5%Bottled, tank, or LP gas
10.8%Electricity
10.6%Fuel oil, kerosene, etc.
2.7%Coal or coke
2.2%Other fuel
Population in 1990: 4,273.
Place of birth for U.S.-born residents:
This state: 1,764
Northeast: 1,359
Midwest: 36
South: 116
West: 12
69% of the 16925 zip code residents lived in the same house 5 years ago. Out of people who lived in different houses, 49% lived in this county. Out of people who lived in different counties, 50% lived in Pennsylvania.
96% of the 16925 zip code residents lived in the same house 1 year ago. Out of people who lived in different houses, 50% moved from this county. Out of people who lived in different houses, 29% moved from different county within same state. Out of people who lived in different houses, 24% moved from different state. Out of people who lived in different houses, 2% moved from abroad.
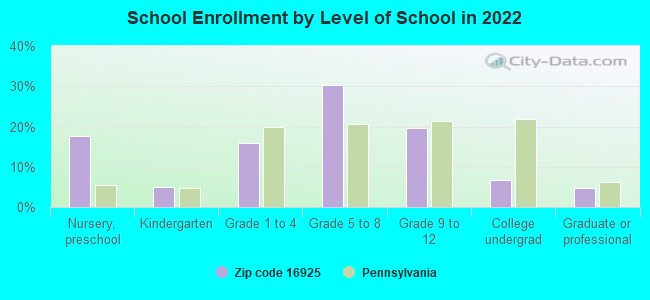
Private vs. public school enrollment:
Students in private schools in grades 1 to 8 (elementary and middle school): 52
Here:
15.7%
Pennsylvania:
15.7%
Students in private schools in grades 9 to 12 (high school): 9
Here:
6.7%
Pennsylvania:
13.4%
Students in private undergraduate colleges: 14
Here:
28.8%
Pennsylvania:
39.8%
Occupation by median earnings in the past 12 months ($)
101,833Architecture and engineering occupations
98,247Business and financial operations occupations
74,623Health diagnosing and treating practitioners and other technical occupations
69,703Installation, maintenance, and repair occupations
66,545Management occupations
64,367Production occupations
Top industries in this zip code by the number of employees in 2005:
Accommodation and Food Services: Snack and Nonalcoholic Beverage Bars (20-49 employees: 1 establishment)
Health Care and Social Assistance: Child Day Care Services (20-49: 1)
Real Estate and Rental and Leasing: Other Activities Related to Real Estate (5-9: 1)
People in group quarters in 2000:
34 people in nursing homes
12 people in other noninstitutional group quarters
Fatal accident statistics in 2012:
Fatal accident count: 1
Vehicles involved in fatal accidents: 1
Fatal accidents caused by drunken drivers: 0
Fatalities: 1
Persons involved in fatal accidents: 2
Pedestrians involved in fatal accidents: 0
Fatal accident statistics in 2010:
Fatal accident count: 2
Vehicles involved in fatal accidents: 2
Fatal accidents caused by drunken drivers: 1
Fatalities: 2
Persons involved in fatal accidents: 4
Pedestrians involved in fatal accidents: 0
Most common first names in zip code 16925 among deceased individuals
Name
Count
Lived (average)
John
19
71.1 years
William
17
65.8 years
Robert
17
71.8 years
George
13
72.9 years
Charles
13
73.8 years
Mary
11
74.7 years
Harold
11
74.3 years
Margaret
10
76.9 years
James
10
80.5 years
Donald
10
74.6 years
Most common last names in zip code 16925 among deceased individuals


 Nearest zip codes: 14894, 16914, 14904, 14901, 14905, 14871.