Estimated zip code population in 2022: 2,481 Zip code population in 2010: 1,994 Zip code population in 2000: 1,350
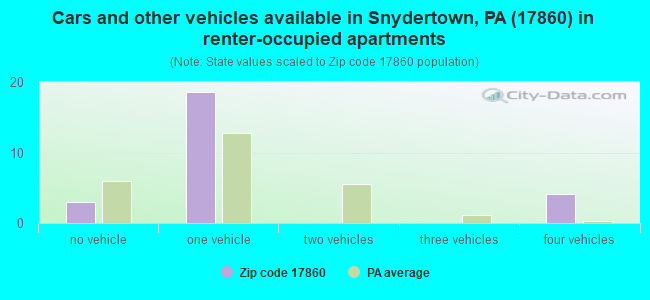
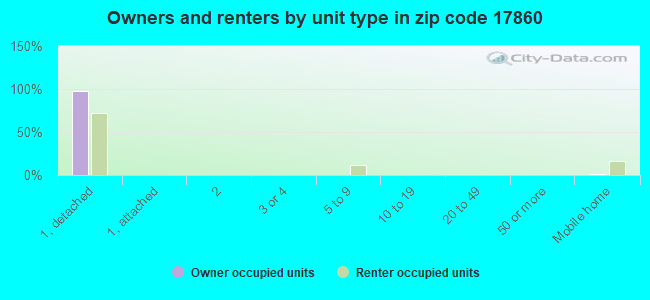
Houses and condos: 1,067 Renter-occupied apartments: 25
% of renters here:
2%
State:
31%
March 2022 cost of living index in zip code 17860: 89.7 (less than average, U.S. average is 100)
Land area: 26.4 sq. mi. Water area: 0.1 sq. mi.
Population density: 94 people per square mile
(very low).
OSM Map
General Map
Google Map
MSN Map
OSM Map
General Map
Google Map
MSN Map
OSM Map
General Map
Google Map
MSN Map
OSM Map
General Map
Google Map
MSN Map
Please wait while loading the map...
Real estate property taxes paid for housing units in 2022:
This zip code:
1.0% ($2,466)
Pennsylvania:
1.3% ($3,094)
Median real estate property taxes paid for housing units with mortgages in 2022: $2,758 (1.0%) Median real estate property taxes paid for housing units with no mortgage in 2022: $2,190 (1.1%)
Business Search- 14 Million verified businesses
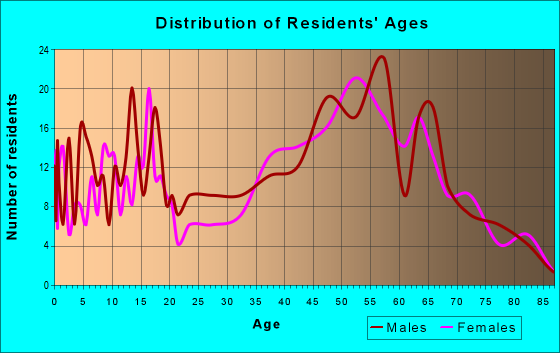
Males: 1,167
(47.0%)
Females: 1,314
(53.0%)
For population 25 years and over in 17860:
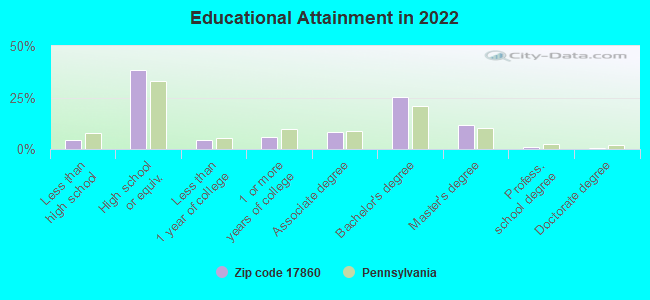
High school or higher: 95.4%
Bachelor's degree or higher: 38.5%
Graduate or professional degree: 13.2%
Unemployed: 0.9%
Mean travel time to work (commute): 26.1 minutes
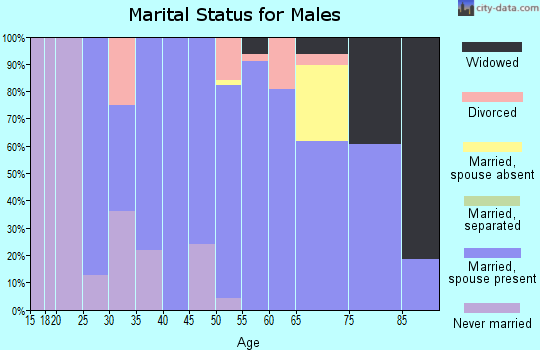
For population 15 years and over in 17860:
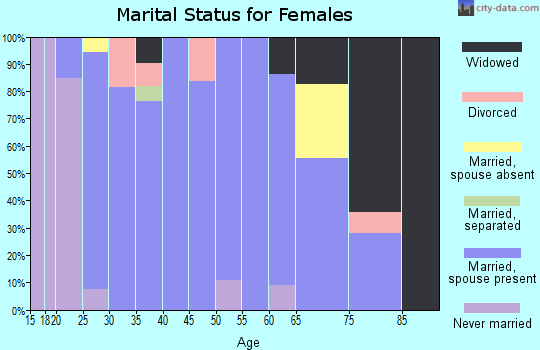
Never married: 13.6%
Now married: 75.3%
Separated: 1.5%
Widowed: 7.2%
Divorced: 2.4%
Zip code 17860 compared to state average:
Unemployed percentage significantly below state average.
Black race population percentage significantly below state average.
Hispanic race population percentage significantly below state average.
Foreign-born population percentage significantly below state average.
Renting percentage significantly below state average.
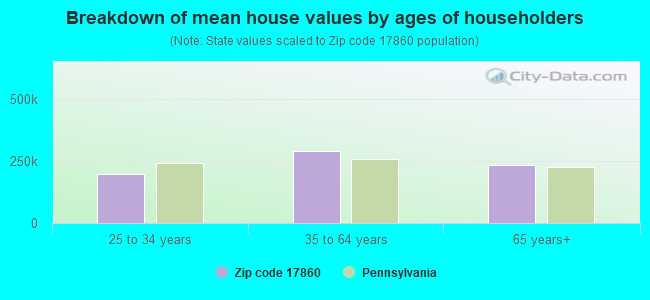
Estimated median house/condo value in 2022: $246,151
17860:
$246,151
Pennsylvania:
$245,500
According to our research of Pennsylvania and other state lists, there were 4 registered sex offenders living in 17860 zip code as of May 17, 2024. The ratio of all residents to sex offenders in zip code 17860 is 648 to 1. The ratio of registered sex offenders to all residents in this zip code is near the state average.
Median resident age:
This zip code:
43.2 years
Pennsylvania median age:
40.9 years
Average household size:
This zip code:
2.4 people
Pennsylvania:
2.4 people
Averages for the 2020 tax year for zip code 17860, filed in 2021:
Average Adjusted Gross Income (AGI) in 2020: $68,633 (Individual Income Tax Returns)
Here:
$68,633
State:
$75,707
Salary/wage: $59,366 (reported on 77.5% of returns)
Here:
$59,366
State:
$62,806
(% of AGI for various income ranges: 1108.8% for AGIs below $25k, 3220.0% for AGIs $25k-50k, 5623.8% for AGIs $50k-75k, 9542.2% for AGIs $75k-100k, 12847.5% for AGIs $100k-200k)
Taxable interest for individuals: $865 (reported on 36.0% of returns)
This zip code:
$865
Pennsylvania:
$1,633
(% of AGI for various income ranges: 36.5% for AGIs below $25k, 24.7% for AGIs $25k-50k, 21.5% for AGIs $50k-75k, 30.0% for AGIs $75k-100k, 113.1% for AGIs $100k-200k)
Ordinary dividends: $4,154 (reported on 25.2% of returns)
Here:
$4,154
State:
$7,382
(% of AGI for various income ranges: 65.3% for AGIs below $25k, 66.7% for AGIs $25k-50k, 74.6% for AGIs $50k-75k, 180.0% for AGIs $75k-100k, 433.1% for AGIs $100k-200k)
Net capital gain/loss in AGI: +$5,255 (reported on 18.0% of returns)
Here:
+$5,255
State:
+$23,522
(% of AGI for various income ranges: 39.4% for AGIs below $25k, 13.8% for AGIs $50k-75k, 113.3% for AGIs $75k-100k, 540.0% for AGIs $100k-200k)
Profit/loss from business: +$13,240 (reported on 13.5% of returns)
Here:
+$13,240
State:
+$16,274
(% of AGI for various income ranges: 93.5% for AGIs below $25k, 156.7% for AGIs $25k-50k, 201.5% for AGIs $50k-75k, 472.2% for AGIs $75k-100k, 565.6% for AGIs $100k-200k)
Taxable individual retirement arrangement distribution: $16,808 (reported on 11.7% of returns)
17860:
$16,808
Pennsylvania:
$18,583
(% of AGI for various income ranges: 109.4% for AGIs below $25k, 176.7% for AGIs $25k-50k, 493.1% for AGIs $50k-75k, 683.1% for AGIs $100k-200k)
Total itemized deductions: $24,800 (reported on 3.6% of returns)
Here:
$24,800
State:
$34,850
(% of AGI for various income ranges: 1102.2% for AGIs $75k-100k)
Charity contributions: $8,000 (reported on 1.8% of returns)
Here:
$8,000
State:
$12,392
(% of AGI for various income ranges: 123.1% for AGIs $50k-75k)
Taxes paid: $6,325 (reported on 3.6% of returns)
17860:
$6,325
State:
$8,200
(% of AGI for various income ranges: 158.1% for AGIs $100k-200k)
Earned income credit: $2,122 (reported on 8.1% of returns)
Here:
$2,122
State:
$2,100
(% of AGI for various income ranges: 68.8% for AGIs below $25k, 49.3% for AGIs $25k-50k)
Percentage of individuals using paid preparers for their 2020 taxes: 89.2%
Here:
89%
State:
92%
(% for various income ranges: 87.9% for AGIs below $25k, 86.4% for AGIs $25k-50k, 88.9% for AGIs $50k-75k, 85.7% for AGIs $75k-100k, 95.0% for AGIs $100k-200k, 100.0% for AGIs over 200k)
Averages for the 2012 tax year for zip code 17860, filed in 2013:
Average Adjusted Gross Income (AGI) in 2012: $54,408 (Individual Income Tax Returns)
Here:
$54,408
State:
$61,346
Salary/wage: $47,062 (reported on 83.5% of returns)
Here:
$47,062
State:
$51,902
(% of AGI for various income ranges: 62.8% for AGIs below $25k, 73.8% for AGIs $25k-50k, 73.7% for AGIs $50k-75k, 80.8% for AGIs $75k-100k, 68.7% for AGIs $100k-200k)
Taxable interest for individuals: $1,041 (reported on 39.8% of returns)
This zip code:
$1,041
Pennsylvania:
$1,588
(% of AGI for various income ranges: 1.6% for AGIs below $25k, 0.8% for AGIs $25k-50k, 0.4% for AGIs $50k-75k, 0.6% for AGIs $75k-100k, 0.8% for AGIs $100k-200k)
Ordinary dividends: $2,386 (reported on 27.2% of returns)
Here:
$2,386
State:
$5,827
(% of AGI for various income ranges: 2.0% for AGIs below $25k, 1.2% for AGIs $25k-50k, 1.0% for AGIs $50k-75k, 1.0% for AGIs $75k-100k, 1.2% for AGIs $100k-200k)
Net capital gain/loss in AGI: +$2,567 (reported on 14.6% of returns)
Here:
+$2,567
State:
+$14,495
(% of AGI for various income ranges: 0.4% for AGIs below $25k, 0.4% for AGIs $25k-50k, 1.4% for AGIs $100k-200k)
Profit/loss from business: +$10,831 (reported on 15.5% of returns)
Here:
+$10,831
State:
+$16,268
(% of AGI for various income ranges: 7.0% for AGIs below $25k, 4.2% for AGIs $25k-50k, 6.3% for AGIs $50k-75k, 0.6% for AGIs $75k-100k, 1.9% for AGIs $100k-200k)
Taxable individual retirement arrangement distribution: $11,858 (reported on 11.7% of returns)
17860:
$11,858
Pennsylvania:
$14,550
(% of AGI for various income ranges: 6.7% for AGIs below $25k, 2.4% for AGIs $25k-50k, 3.2% for AGIs $50k-75k, 2.8% for AGIs $100k-200k)
Total itemized deductions: $19,067 (19% of AGI, reported on 26.2% of returns)
Here:
$19,067
State:
$23,538
Here:
18.8% of AGI
State:
18.4% of AGI
(% of AGI for various income ranges: 9.8% for AGIs $25k-50k, 8.6% for AGIs $50k-75k, 9.6% for AGIs $75k-100k, 10.7% for AGIs $100k-200k)
Charity contributions: $3,485 (reported on 19.4% of returns)
Here:
$3,485
State:
$4,025
(% of AGI for various income ranges: 0.8% for AGIs $25k-50k, 1.2% for AGIs $50k-75k, 1.1% for AGIs $75k-100k, 1.7% for AGIs $100k-200k)
Taxes paid: $7,085 (reported on 26.2% of returns)
17860:
$7,085
State:
$9,982
(% of AGI for various income ranges: 1.7% for AGIs $25k-50k, 2.5% for AGIs $50k-75k, 3.4% for AGIs $75k-100k, 5.0% for AGIs $100k-200k)
Earned income credit: $1,964 (reported on 10.7% of returns)
Here:
$1,964
State:
$2,106
(% of AGI for various income ranges: 3.4% for AGIs below $25k, 0.8% for AGIs $25k-50k)
Percentage of individuals using paid preparers for their 2012 taxes: 63.1%
Here:
63%
State:
53%
(% for various income ranges: 62.2% for AGIs below $25k, 60.9% for AGIs $25k-50k, 66.7% for AGIs $50k-75k, 61.5% for AGIs $75k-100k, 66.7% for AGIs $100k-200k)
Averages for the 2004 tax year for zip code 17860, filed in 2005:
Average Adjusted Gross Income (AGI) in 2004: $41,057 (Individual Income Tax Returns)
Here:
$41,057
State:
$48,049
Salary/wage: $36,032 (reported on 83.9% of returns)
Here:
$36,032
State:
$42,646
(% of AGI for various income ranges: 79.5% for AGIs below $10k, 69.0% for AGIs $10k-25k, 77.4% for AGIs $25k-50k, 80.4% for AGIs $50k-75k, 89.9% for AGIs $75k-100k, 51.9% for AGIs over 100k)
Taxable interest for individuals: $829 (reported on 56.2% of returns)
This zip code:
$829
Pennsylvania:
$1,657
(% of AGI for various income ranges: 6.0% for AGIs below $10k, 2.1% for AGIs $10k-25k, 1.0% for AGIs $25k-50k, 0.8% for AGIs $50k-75k, 0.6% for AGIs $75k-100k, 1.2% for AGIs over 100k)
Taxable dividends: $1,515 (reported on 28.8% of returns)
Here:
$1,515
State:
$3,566
(% of AGI for various income ranges: 4.5% for AGIs below $10k, 1.5% for AGIs $10k-25k, 0.5% for AGIs $25k-50k, 0.4% for AGIs $50k-75k, 0.6% for AGIs $75k-100k, 2.2% for AGIs over 100k)
Net capital gain/loss: +$3,775 (reported on 19.2% of returns)
Here:
+$3,775
State:
+$9,716
(% of AGI for various income ranges: 1.1% for AGIs below $10k, 1.9% for AGIs $10k-25k, 1.5% for AGIs $25k-50k, 1.7% for AGIs $50k-75k, 1.0% for AGIs $75k-100k, 2.7% for AGIs over 100k)
Profit/loss from business: +$12,988 (reported on 15.4% of returns)
Here:
+$12,988
State:
+$14,267
(% of AGI for various income ranges: 12.7% for AGIs below $10k, 8.9% for AGIs $10k-25k, 3.9% for AGIs $25k-50k, 2.4% for AGIs $50k-75k, 0.3% for AGIs $75k-100k, 9.6% for AGIs over 100k)
IRA payment deduction: $2,516 (reported on 3.0% of returns)
17860:
$2,516
Pennsylvania:
$2,903
Total itemized deductions: $15,130 (18% of AGI, reported on 24.4% of returns)
Here:
$15,130
State:
$18,804
Here:
18.1% of AGI
State:
19.5% of AGI
(% of AGI for various income ranges: 4.3% for AGIs $10k-25k, 7.1% for AGIs $25k-50k, 9.8% for AGIs $50k-75k, 12.6% for AGIs $75k-100k, 9.5% for AGIs over 100k)
Charity contributions deductions: $2,413 (3% of AGI, reported on 21.7% of returns)
Here:
$2,413
State:
$3,337
Here:
2.8% of AGI
State:
3.3% of AGI
(% of AGI for various income ranges: 0.8% for AGIs $25k-50k, 1.3% for AGIs $50k-75k, 1.8% for AGIs $75k-100k, 1.9% for AGIs over 100k)
Total tax: $5,679 (reported on 76.1% of returns)
17860:
$5,679
State:
$8,008
(% of AGI for various income ranges: 3.0% for AGIs below $10k, 4.7% for AGIs $10k-25k, 7.2% for AGIs $25k-50k, 8.6% for AGIs $50k-75k, 9.6% for AGIs $75k-100k, 19.0% for AGIs over 100k)
Earned income credit: $1,667 (reported on 8.7% of returns)
Here:
$1,667
State:
$1,643
Percentage of individuals using paid preparers for their 2004 taxes: 61.0%
Here:
61%
State:
56%
(% for various income ranges: 53.4% for AGIs below $10k, 64.6% for AGIs $10k-25k, 60.6% for AGIs $25k-50k, 61.1% for AGIs $50k-75k, 62.1% for AGIs $75k-100k, 76.6% for AGIs over 100k)
Household received Food Stamps/SNAP in the past 12 months: 34 Household did not receive Food Stamps/SNAP in the past 12 months: 994
Women who had a birth in the past 12 months: 59 (63 now married, 0 unmarried) Women who did not have a birth in the past 12 months: 450 (315 now married, 130 unmarried)
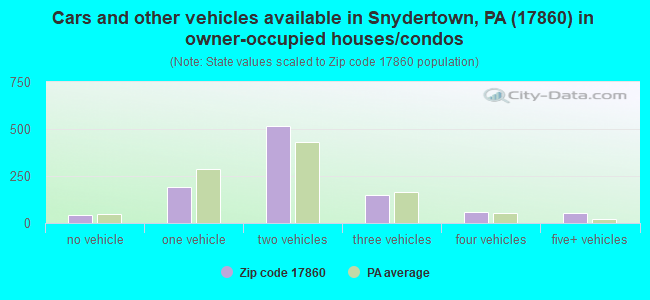
Housing units in zip code 17860 with a mortgage: 625 (121 second mortgage, 113 both second mortgage and home equity loan) Houses without a mortgage: 22
Median monthly owner costs for units with a mortgage: $1,542 Median monthly owner costs for units without a mortgage: $484
Residents with income below the poverty level in 2022:
This zip code:
7.0%
Whole state:
11.8%
Residents with income below 50% of the poverty level in 2022:
This zip code:
3.1%
Whole state:
6.1%
Median number of rooms in houses and condos:
Here:
7.0
State:
6.8
Median number of rooms in apartments:
Here:
5.2
State:
4.3
Notable locations in this zip code not listed on our city pages
Notable locations in zip code 17860: Bar Mac Ramp Station (A), D and Z Ramp Station (B), Shamokin Valley Country Club (C). Display/hide their locations on the map
Churches in zip code 17860 include: Augustaville Church (A), Ash Grove Church (B), Deibler Station Church (C), Clarks Grove Church (D), Saint Peters Church (E), Jacob Church (F), Oak Grove Church (G), Irish Valley Church (H), Bear Gap Tabernacle (I). Display/hide their locations on the map
Size of family households: 369 2-persons, 165 3-persons, 177 4-persons, 68 5-persons, 7 6-persons, 5 7-or-more-persons
Size of nonfamily households: 207 1-person, 27 2-persons
508 married couples with children.
42 single-parent households (42 women).
99.3% of residents of 17860 zip code speak English at home.
0.2% of residents speak Spanish at home (100% very well).
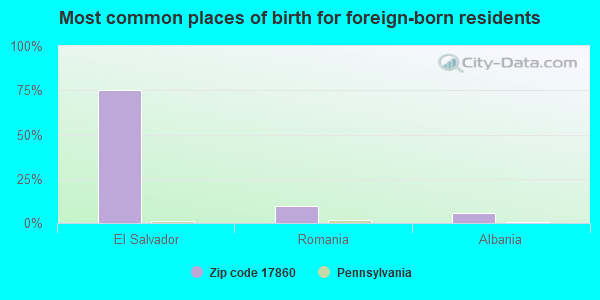
Foreign born population: 53 (2.2%) (100.0% of them are naturalized citizens)
This zip code:
2.2%
Whole state:
7.5%
75%El Salvador
10%Romania
6%Albania
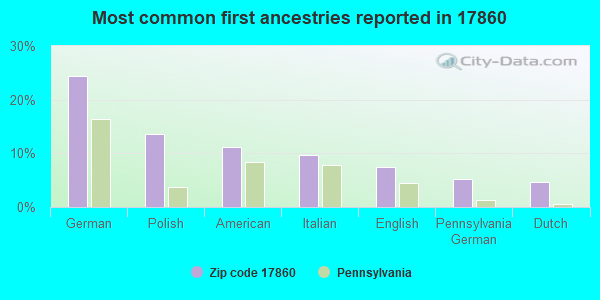
24%German
14%Polish
11%American
10%Italian
7%English
5%Pennsylvania German
5%Dutch
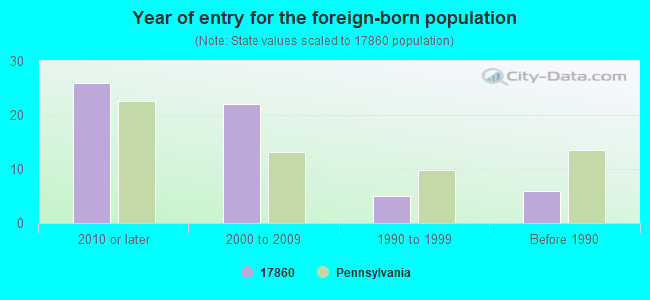
Year of entry for the foreign-born population
262010 or later
222000 to 2009
51990 to 1999
6Before 1990
Housing units lacking complete plumbing facilities: 0.4% Housing units lacking complete kitchen facilities: 0.4%
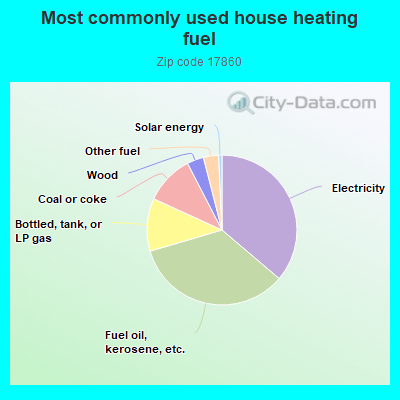
36.3%Electricity
34.3%Fuel oil, kerosene, etc.
11.4%Bottled, tank, or LP gas
10.6%Coal or coke
3.6%Wood
3.3%Other fuel
0.7%Solar energy
Population in 1990: 1,684.
Place of birth for U.S.-born residents:
This state: 2,190
Northeast: 71
Midwest: 12
South: 115
West: 13
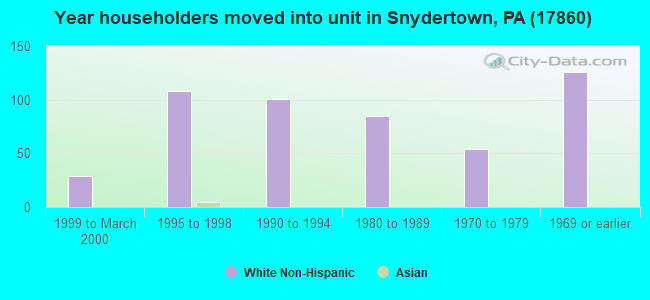
75% of the 17860 zip code residents lived in the same house 5 years ago. Out of people who lived in different houses, 57% lived in this county. Out of people who lived in different counties, 50% lived in Pennsylvania.
97% of the 17860 zip code residents lived in the same house 1 year ago. Out of people who lived in different houses, 75% moved from this county. Out of people who lived in different houses, 32% moved from different county within same state.
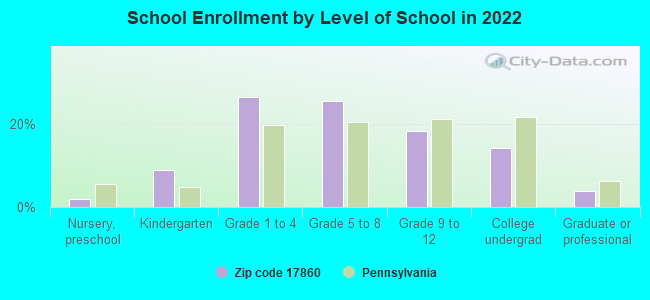
Private vs. public school enrollment:
Students in private schools in grades 1 to 8 (elementary and middle school): 103
Here:
43.1%
Pennsylvania:
15.7%
Students in private schools in grades 9 to 12 (high school):
Here:
0.0%
Pennsylvania:
13.4%
Students in private undergraduate colleges: 13
Here:
21.5%
Pennsylvania:
39.8%
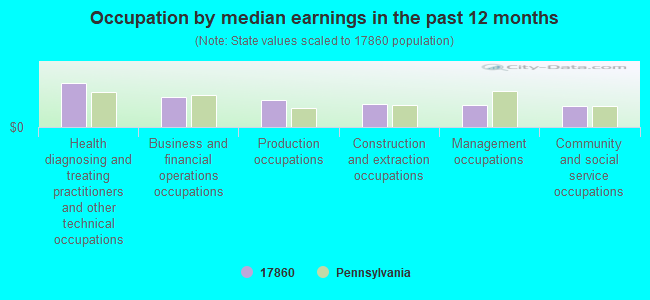
Occupation by median earnings in the past 12 months ($)
128,413Health diagnosing and treating practitioners and other technical occupations
86,957Business and financial operations occupations
78,183Production occupations
66,765Construction and extraction occupations
62,857Management occupations
59,871Community and social service occupations
Top industries in this zip code by the number of employees in 2005:
Wholesale Trade: Beer and Ale Merchant Wholesalers (50-99 employees: 1 establishment)
Accommodation and Food Services: Full-Service Restaurants (20-49: 1, 5-9: 1)
Other Services (except Public Administration): General Automotive Repair (10-19: 1, 1-4: 1)
Educational Services: Elementary and Secondary Schools (10-19: 1)
Fatal accident statistics in 2014:
Fatal accident count: 1
Vehicles involved in fatal accidents: 1
Fatal accidents caused by drunken drivers: 0
Fatalities: 1
Persons involved in fatal accidents: 1
Pedestrians involved in fatal accidents: 0
Fatal accident statistics in 2012:
Fatal accident count: 1
Vehicles involved in fatal accidents: 1
Fatal accidents caused by drunken drivers: 0
Fatalities: 1
Persons involved in fatal accidents: 1
Pedestrians involved in fatal accidents: 0
2004 - 2018 National Fire Incident Reporting System (NFIRS) incidents
Based on the data from the years 2004 - 2018 the average number of fire incidents per year is 7. The highest number of reported fires - 16 took place in 2006, and the least - 0 in 2011. The data has a decreasing trend.
When looking into fire subcategories, the most incidents belonged to: Outside Fires (50.0%), and Structure Fires (34.3%).
Fire incident types reported to NFIRS in Zip Code 17860


 Nearest zip codes: 17866, 17868, 17822, 17881, 17824, 17821.


 Based on the data from the years 2004 - 2018 the average number of fire incidents per year is 7. The highest number of reported fires - 16 took place in 2006, and the least - 0 in 2011. The data has a decreasing trend.
 When looking into fire subcategories, the most incidents belonged to: Outside Fires (50.0%), and Structure Fires (34.3%).