Estimated zip code population in 2022: 12,320 Zip code population in 2010: 7,528 Zip code population in 2000: 3,592
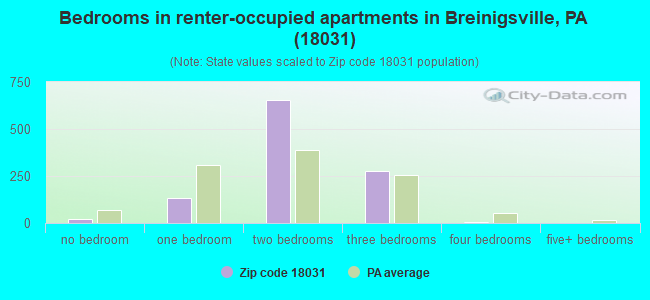
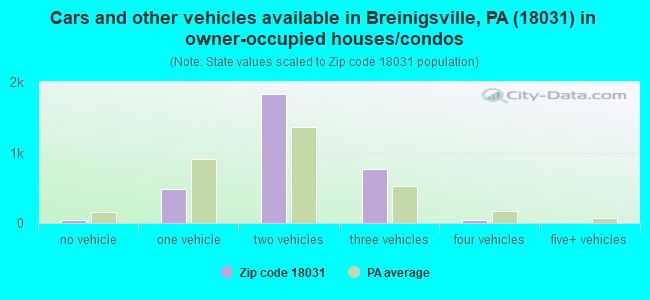
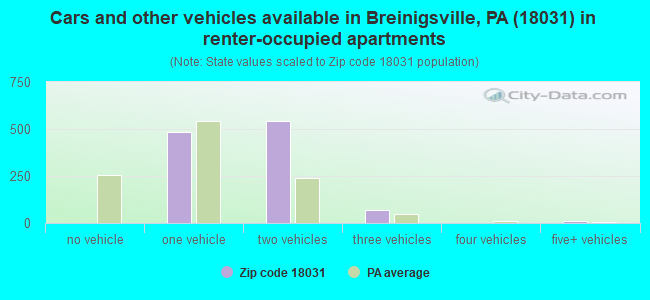
Houses and condos: 4,637 Renter-occupied apartments: 1,098
% of renters here:
26%
State:
31%
March 2022 cost of living index in zip code 18031: 101.9 (near average, U.S. average is 100)
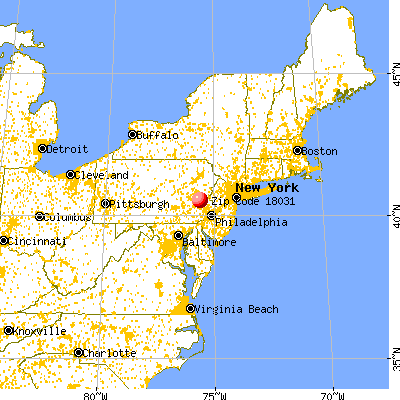
Land area: 13.7 sq. mi. Water area: 0.0 sq. mi.
Population density: 902 people per square mile
(low).
OSM Map
General Map
Google Map
MSN Map
OSM Map
General Map
Google Map
MSN Map
OSM Map
General Map
Google Map
MSN Map
OSM Map
General Map
Google Map
MSN Map
Please wait while loading the map...
Real estate property taxes paid for housing units in 2022:
This zip code:
1.3% ($4,798)
Pennsylvania:
1.3% ($3,094)
Median real estate property taxes paid for housing units with mortgages in 2022: $5,106 (1.3%) Median real estate property taxes paid for housing units with no mortgage in 2022: $3,993 (1.2%)
Business Search- 14 Million verified businesses
Males: 5,607
(45.5%)
Females: 6,713
(54.5%)
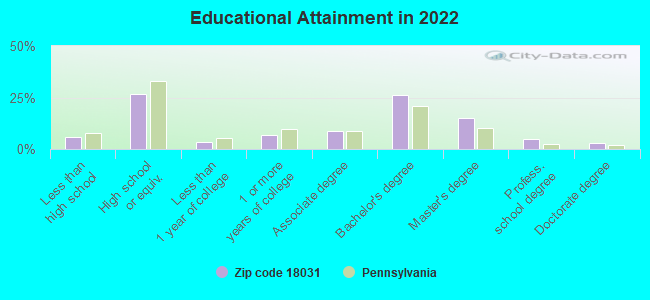
For population 25 years and over in 18031:
High school or higher: 94.7%
Bachelor's degree or higher: 49.2%
Graduate or professional degree: 23.1%
Unemployed: 2.6%
Mean travel time to work (commute): 25.8 minutes
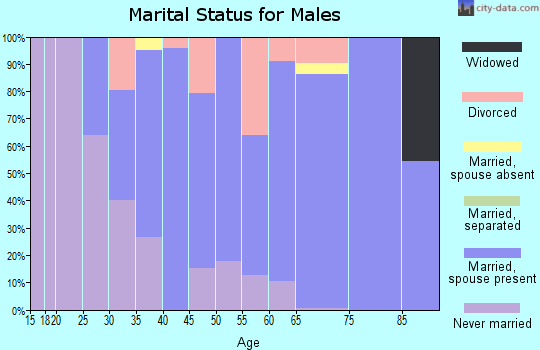
For population 15 years and over in 18031:
Never married: 24.4%
Now married: 60.2%
Separated: 0.3%
Widowed: 5.7%
Divorced: 9.4%
Zip code 18031 compared to state average:
Median house value above state average.
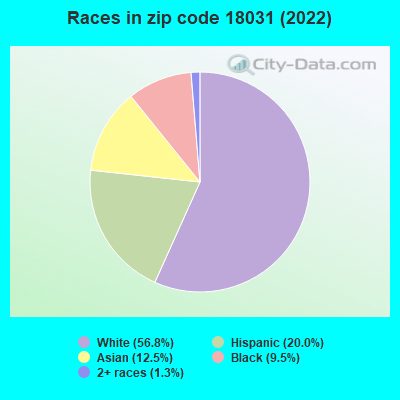
Hispanic race population percentage above state average.
Foreign-born population percentage significantly above state average.
Length of stay since moving in significantly below state average.
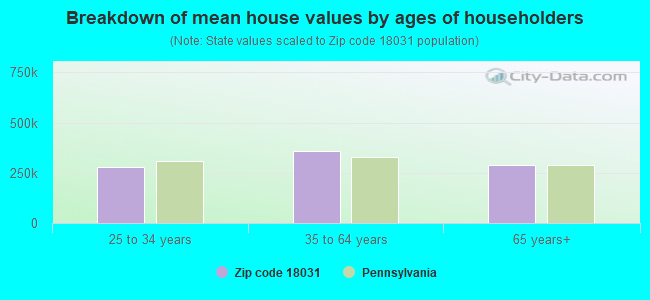
Estimated median house/condo value in 2022: $373,134
18031:
$373,134
Pennsylvania:
$245,500
According to our research of Pennsylvania and other state lists, there were 6 registered sex offenders living in 18031 zip code as of May 16, 2024. The ratio of all residents to sex offenders in zip code 18031 is 1,559 to 1. The ratio of registered sex offenders to all residents in this zip code is lower than the state average.
Median resident age:
This zip code:
39.4 years
Pennsylvania median age:
40.9 years
Average household size:
This zip code:
2.8 people
Pennsylvania:
2.4 people
Averages for the 2020 tax year for zip code 18031, filed in 2021:
Average Adjusted Gross Income (AGI) in 2020: $89,394 (Individual Income Tax Returns)
Here:
$89,394
State:
$75,707
Salary/wage: $83,839 (reported on 84.8% of returns)
Here:
$83,839
State:
$62,806
(% of AGI for various income ranges: 1015.1% for AGIs below $25k, 3435.0% for AGIs $25k-50k, 6919.7% for AGIs $50k-75k, 9816.5% for AGIs $75k-100k, 19874.6% for AGIs $100k-200k, 68073.0% for AGIs over 200k)
Taxable interest for individuals: $1,182 (reported on 34.5% of returns)
This zip code:
$1,182
Pennsylvania:
$1,633
(% of AGI for various income ranges: 14.9% for AGIs below $25k, 32.7% for AGIs $25k-50k, 26.6% for AGIs $50k-75k, 45.0% for AGIs $75k-100k, 63.5% for AGIs $100k-200k, 532.5% for AGIs over 200k)
Ordinary dividends: $3,144 (reported on 25.4% of returns)
Here:
$3,144
State:
$7,382
(% of AGI for various income ranges: 29.1% for AGIs below $25k, 45.1% for AGIs $25k-50k, 69.0% for AGIs $50k-75k, 78.5% for AGIs $75k-100k, 173.2% for AGIs $100k-200k, 922.5% for AGIs over 200k)
Net capital gain/loss in AGI: +$10,461 (reported on 22.9% of returns)
Here:
+$10,461
State:
+$23,522
(% of AGI for various income ranges: 7.2% for AGIs below $25k, 35.0% for AGIs $25k-50k, 72.7% for AGIs $50k-75k, 84.0% for AGIs $75k-100k, 343.2% for AGIs $100k-200k, 4904.0% for AGIs over 200k)
Profit/loss from business: +$13,914 (reported on 14.1% of returns)
Here:
+$13,914
State:
+$16,274
(% of AGI for various income ranges: 107.7% for AGIs below $25k, 175.4% for AGIs $25k-50k, 115.9% for AGIs $50k-75k, 256.0% for AGIs $75k-100k, 457.9% for AGIs $100k-200k, 1742.5% for AGIs over 200k)
Taxable individual retirement arrangement distribution: $18,024 (reported on 8.8% of returns)
18031:
$18,024
Pennsylvania:
$18,583
(% of AGI for various income ranges: 65.7% for AGIs below $25k, 121.9% for AGIs $25k-50k, 145.1% for AGIs $50k-75k, 255.5% for AGIs $75k-100k, 512.0% for AGIs $100k-200k, 815.5% for AGIs over 200k)
Self-employed (Keogh) retirement plans: $14,350 (reported on 0.4% of returns)
18031:
$14,350
Pennsylvania:
$25,407
(% of AGI for various income ranges: 71.8% for AGIs $75k-100k)
Total itemized deductions: $27,629 (reported on 9.3% of returns)
Here:
$27,629
State:
$34,850
(% of AGI for various income ranges: 159.3% for AGIs $25k-50k, 213.7% for AGIs $50k-75k, 431.2% for AGIs $75k-100k, 675.1% for AGIs $100k-200k, 2577.0% for AGIs over 200k)
Charity contributions: $6,678 (reported on 7.2% of returns)
Here:
$6,678
State:
$12,392
(% of AGI for various income ranges: 18.0% for AGIs $25k-50k, 22.2% for AGIs $50k-75k, 61.8% for AGIs $75k-100k, 120.8% for AGIs $100k-200k, 636.5% for AGIs over 200k)
Taxes paid: $8,308 (reported on 9.3% of returns)
18031:
$8,308
State:
$8,200
(% of AGI for various income ranges: 28.2% for AGIs $25k-50k, 70.0% for AGIs $50k-75k, 160.5% for AGIs $75k-100k, 214.6% for AGIs $100k-200k, 743.5% for AGIs over 200k)
Earned income credit: $2,244 (reported on 9.7% of returns)
Here:
$2,244
State:
$2,100
(% of AGI for various income ranges: 73.1% for AGIs below $25k, 61.6% for AGIs $25k-50k)
Percentage of individuals using paid preparers for their 2020 taxes: 92.1%
Here:
92%
State:
92%
(% for various income ranges: 89.5% for AGIs below $25k, 93.1% for AGIs $25k-50k, 91.7% for AGIs $50k-75k, 92.9% for AGIs $75k-100k, 93.3% for AGIs $100k-200k, 94.1% for AGIs over 200k)
Averages for the 2012 tax year for zip code 18031, filed in 2013:
Average Adjusted Gross Income (AGI) in 2012: $70,504 (Individual Income Tax Returns)
Here:
$70,504
State:
$61,346
Salary/wage: $67,662 (reported on 86.9% of returns)
Here:
$67,662
State:
$51,902
(% of AGI for various income ranges: 67.7% for AGIs below $25k, 78.8% for AGIs $25k-50k, 83.1% for AGIs $50k-75k, 85.3% for AGIs $75k-100k, 89.4% for AGIs $100k-200k, 76.4% for AGIs over 200k)
Taxable interest for individuals: $908 (reported on 39.4% of returns)
This zip code:
$908
Pennsylvania:
$1,588
(% of AGI for various income ranges: 1.6% for AGIs below $25k, 0.6% for AGIs $25k-50k, 0.5% for AGIs $50k-75k, 0.4% for AGIs $75k-100k, 0.3% for AGIs $100k-200k, 0.8% for AGIs over 200k)
Ordinary dividends: $1,954 (reported on 24.9% of returns)
Here:
$1,954
State:
$5,827
(% of AGI for various income ranges: 1.8% for AGIs below $25k, 0.8% for AGIs $25k-50k, 0.6% for AGIs $50k-75k, 0.6% for AGIs $75k-100k, 0.6% for AGIs $100k-200k, 0.8% for AGIs over 200k)
Net capital gain/loss in AGI: +$5,447 (reported on 17.6% of returns)
Here:
+$5,447
State:
+$14,495
(% of AGI for various income ranges: 0.4% for AGIs $50k-75k, 0.9% for AGIs $100k-200k, 5.5% for AGIs over 200k)
Profit/loss from business: +$17,840 (reported on 12.7% of returns)
Here:
+$17,840
State:
+$16,268
(% of AGI for various income ranges: 6.4% for AGIs below $25k, 5.4% for AGIs $25k-50k, 3.0% for AGIs $50k-75k, 2.3% for AGIs $75k-100k, 1.7% for AGIs $100k-200k, 5.0% for AGIs over 200k)
Taxable individual retirement arrangement distribution: $14,738 (reported on 10.0% of returns)
18031:
$14,738
Pennsylvania:
$14,550
(% of AGI for various income ranges: 4.6% for AGIs below $25k, 2.7% for AGIs $25k-50k, 2.0% for AGIs $50k-75k, 1.7% for AGIs $75k-100k, 1.6% for AGIs $100k-200k, 2.6% for AGIs over 200k)
Total itemized deductions: $22,214 (19% of AGI, reported on 42.1% of returns)
Here:
$22,214
State:
$23,538
Here:
19.4% of AGI
State:
18.4% of AGI
(% of AGI for various income ranges: 9.0% for AGIs below $25k, 9.4% for AGIs $25k-50k, 12.7% for AGIs $50k-75k, 15.1% for AGIs $75k-100k, 15.4% for AGIs $100k-200k, 11.2% for AGIs over 200k)
Charity contributions: $2,254 (reported on 32.7% of returns)
Here:
$2,254
State:
$4,025
(% of AGI for various income ranges: 0.4% for AGIs below $25k, 0.5% for AGIs $25k-50k, 0.9% for AGIs $50k-75k, 1.1% for AGIs $75k-100k, 1.4% for AGIs $100k-200k, 1.0% for AGIs over 200k)
Taxes paid: $9,262 (reported on 42.1% of returns)
18031:
$9,262
State:
$9,982
(% of AGI for various income ranges: 2.0% for AGIs below $25k, 2.9% for AGIs $25k-50k, 4.7% for AGIs $50k-75k, 5.7% for AGIs $75k-100k, 6.8% for AGIs $100k-200k, 6.0% for AGIs over 200k)
Earned income credit: $2,105 (reported on 8.7% of returns)
Here:
$2,105
State:
$2,106
(% of AGI for various income ranges: 4.2% for AGIs below $25k, 0.7% for AGIs $25k-50k)
Percentage of individuals using paid preparers for their 2012 taxes: 50.1%
Here:
50%
State:
53%
(% for various income ranges: 45.8% for AGIs below $25k, 49.5% for AGIs $25k-50k, 50.0% for AGIs $50k-75k, 52.7% for AGIs $75k-100k, 51.8% for AGIs $100k-200k, 66.7% for AGIs over 200k)
Averages for the 2004 tax year for zip code 18031, filed in 2005:
Average Adjusted Gross Income (AGI) in 2004: $48,114 (Individual Income Tax Returns)
Here:
$48,114
State:
$48,049
Salary/wage: $46,916 (reported on 84.8% of returns)
Here:
$46,916
State:
$42,646
(% of AGI for various income ranges: 88.1% for AGIs below $10k, 68.9% for AGIs $10k-25k, 79.6% for AGIs $25k-50k, 83.7% for AGIs $50k-75k, 88.8% for AGIs $75k-100k, 82.9% for AGIs over 100k)
Taxable interest for individuals: $1,130 (reported on 54.3% of returns)
This zip code:
$1,130
Pennsylvania:
$1,657
(% of AGI for various income ranges: 9.0% for AGIs below $10k, 2.7% for AGIs $10k-25k, 1.6% for AGIs $25k-50k, 1.2% for AGIs $50k-75k, 0.4% for AGIs $75k-100k, 1.0% for AGIs over 100k)
Taxable dividends: $1,751 (reported on 32.1% of returns)
Here:
$1,751
State:
$3,566
(% of AGI for various income ranges: 5.8% for AGIs below $10k, 2.1% for AGIs $10k-25k, 1.3% for AGIs $25k-50k, 1.1% for AGIs $50k-75k, 0.6% for AGIs $75k-100k, 1.1% for AGIs over 100k)
Net capital gain/loss: +$1,496 (reported on 23.0% of returns)
Here:
+$1,496
State:
+$9,716
(% of AGI for various income ranges: -4.6% for AGIs below $10k, 0.4% for AGIs $10k-25k, 0.0% for AGIs $25k-50k, 0.2% for AGIs $50k-75k, -0.0% for AGIs $75k-100k, 2.3% for AGIs over 100k)
Profit/loss from business: +$11,553 (reported on 11.5% of returns)
Here:
+$11,553
State:
+$14,267
(% of AGI for various income ranges: 9.0% for AGIs below $10k, 4.5% for AGIs $10k-25k, 2.6% for AGIs $25k-50k, 1.7% for AGIs $50k-75k, 3.2% for AGIs $75k-100k, 2.8% for AGIs over 100k)
IRA payment deduction: $2,712 (reported on 2.3% of returns)
18031:
$2,712
Pennsylvania:
$2,903
Total itemized deductions: $16,687 (20% of AGI, reported on 33.7% of returns)
Here:
$16,687
State:
$18,804
Here:
20.4% of AGI
State:
19.5% of AGI
(% of AGI for various income ranges: 8.3% for AGIs below $10k, 8.8% for AGIs $10k-25k, 9.1% for AGIs $25k-50k, 10.7% for AGIs $50k-75k, 14.7% for AGIs $75k-100k, 13.1% for AGIs over 100k)
Charity contributions deductions: $2,088 (2% of AGI, reported on 29.8% of returns)
Here:
$2,088
State:
$3,337
Here:
2.5% of AGI
State:
3.3% of AGI
(% of AGI for various income ranges: 1.2% for AGIs $10k-25k, 0.7% for AGIs $25k-50k, 1.2% for AGIs $50k-75k, 2.0% for AGIs $75k-100k, 1.4% for AGIs over 100k)
Total tax: $6,658 (reported on 81.5% of returns)
18031:
$6,658
State:
$8,008
(% of AGI for various income ranges: 3.3% for AGIs below $10k, 4.6% for AGIs $10k-25k, 7.7% for AGIs $25k-50k, 9.8% for AGIs $50k-75k, 11.3% for AGIs $75k-100k, 16.6% for AGIs over 100k)
Earned income credit: $1,396 (reported on 7.2% of returns)
Here:
$1,396
State:
$1,643
Percentage of individuals using paid preparers for their 2004 taxes: 52.3%
Here:
52%
State:
56%
(% for various income ranges: 44.3% for AGIs below $10k, 54.2% for AGIs $10k-25k, 52.6% for AGIs $25k-50k, 53.5% for AGIs $50k-75k, 52.1% for AGIs $75k-100k, 59.9% for AGIs over 100k)
Likely homosexual households (counted as self-reported same-sex unmarried-partner households)
Lesbian couples: 0.3% of all households
Gay men: 0.3% of all households
Household received Food Stamps/SNAP in the past 12 months: 268 Household did not receive Food Stamps/SNAP in the past 12 months: 4,005
Women who had a birth in the past 12 months: 321 (173 now married, 136 unmarried) Women who did not have a birth in the past 12 months: 2,818 (1,499 now married, 1,306 unmarried)
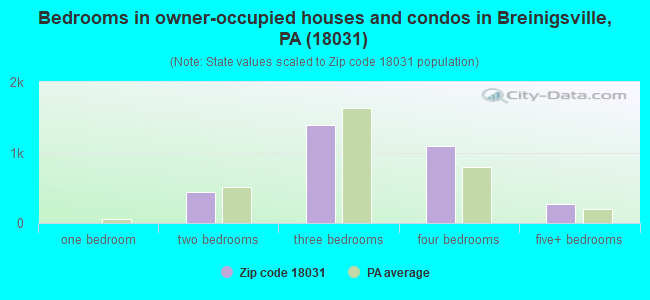
Housing units in zip code 18031 with a mortgage: 2,247 (191 second mortgage, 148 both second mortgage and home equity loan) Houses without a mortgage: 58
Median monthly owner costs for units with a mortgage: $2,109 Median monthly owner costs for units without a mortgage: $813
Residents with income below the poverty level in 2022:
This zip code:
6.5%
Whole state:
11.8%
Residents with income below 50% of the poverty level in 2022:
This zip code:
4.0%
Whole state:
6.1%
Median number of rooms in houses and condos:
Here:
7.7
State:
6.8
Median number of rooms in apartments:
Here:
4.4
State:
4.3
Notable locations in this zip code not listed on our city pages
In group quarters: 62 (-1 institutionalized population)
Size of family households: 1,305 2-persons, 880 3-persons, 578 4-persons, 489 5-persons, 182 6-persons, 12 7-or-more-persons
Size of nonfamily households: 697 1-person, 96 2-persons, 6 4-persons
2,996 married couples with children.
301 single-parent households (58 men, 243 women).
74.8% of residents of 18031 zip code speak English at home.
9.7% of residents speak Spanish at home (48% very well, 52% well).
10.1% of residents speak other Indo-European language at home (45% very well, 52% well, 3% not well).
3.2% of residents speak Asian or Pacific Island language at home (61% very well, 10% well, 28% not well).
2.6% of residents speak other language at home (58% very well, 42% well).
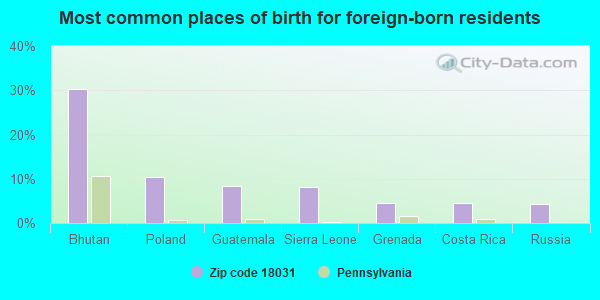
Foreign born population: 2,561 (20.8%) (52.9% of them are naturalized citizens)
This zip code:
20.8%
Whole state:
7.5%
30%Bhutan
10%Poland
8%Guatemala
8%Sierra Leone
5%Grenada
4%Costa Rica
4%Russia
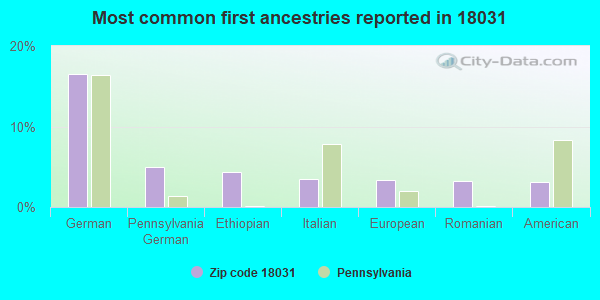
17%German
5%Pennsylvania German
4%Ethiopian
3%Italian
3%European
3%Romanian
3%American
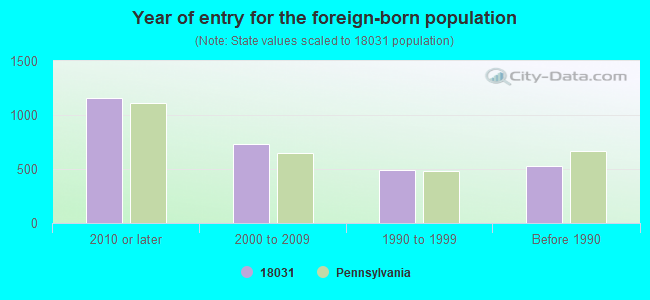
Year of entry for the foreign-born population
1,1562010 or later
7282000 to 2009
4921990 to 1999
530Before 1990
Housing units lacking complete kitchen facilities: 0.9%
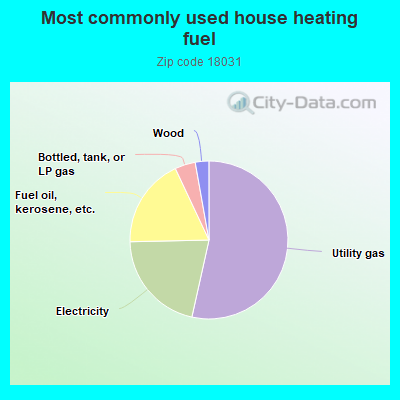
53.6%Utility gas
21.2%Electricity
18.4%Fuel oil, kerosene, etc.
4.2%Bottled, tank, or LP gas
2.8%Wood
Population in 1990: 3,437. Population change in the 1990s: +155 (+4.5%).
Place of birth for U.S.-born residents:
This state: 6,739
Northeast: 1,490
Midwest: 292
South: 617
West: 367
64% of the 18031 zip code residents lived in the same house 5 years ago. Out of people who lived in different houses, 58% lived in this county. Out of people who lived in different counties, 50% lived in Pennsylvania.
84% of the 18031 zip code residents lived in the same house 1 year ago. Out of people who lived in different houses, 43% moved from this county. Out of people who lived in different houses, 2% moved from different county within same state. Out of people who lived in different houses, 48% moved from different state. Out of people who lived in different houses, 7% moved from abroad.
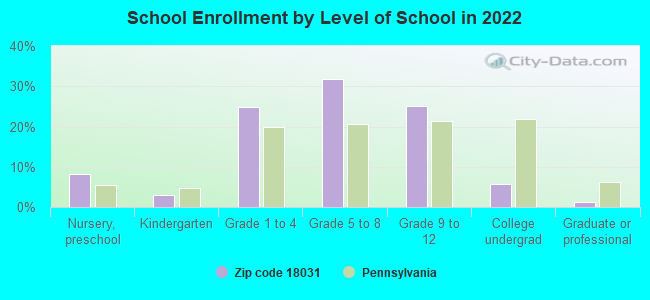
Private vs. public school enrollment:
Students in private schools in grades 1 to 8 (elementary and middle school): 161
Here:
9.6%
Pennsylvania:
15.7%
Students in private schools in grades 9 to 12 (high school): 14
Here:
2.0%
Pennsylvania:
13.4%
Students in private undergraduate colleges:
Here:
0.0%
Pennsylvania:
39.8%
Occupation by median earnings in the past 12 months ($)
185,777Health diagnosing and treating practitioners and other technical occupations
116,236Architecture and engineering occupations
92,218Computer and mathematical occupations
91,745Management occupations
90,993Education, training, and library occupations
69,631Health technologists and technicians
Companies with federal contracts located in this zip code:
ULINE, INC (DEL) (400 BOULDER DR in BREINIGSVILLE, PA; small business) : $72,940 in 12 contractsfrom 2002 to 2006
Contracts for Boxes, Cartons, and Crates, Packaging and Packing Bulk Materials, Hazardous Substance Removal, Cleanup, and Disposal Services and Operational Support, Office Supplies by Navy, U.S. Coast Guard, Army, Defense Logistics Agency, and others Signed by year:2000: $0; 2001: $0; 2002: $4,518; 2003: $39,398; 2004: $0; 2005: $18,443; 2006: $10,581.
Biggest contracts:
$31,786 with Navy for Boxes, Cartons, and Crates. Taking place in NJ. Signed on 2003-09-29. Completion date: 2003-09-30.
$10,993 with U.S. Coast Guard for Packaging and Packing Bulk Materials. Signed on 2005-09-02. Completion date: 2005-09-30.
$4,518 with Army for Packaging and Packing Bulk Materials. Taking place in NJ. Signed on 2002-08-13. Completion date: 2002-08-30.
$4,161 with Defense Logistics Agency for Hazardous Substance Removal, Cleanup, and Disposal Services and Operational Support. Signed on 2006-06-21. Completion date: 2006-07-26.
CYOPTICS INC (9999 HAMILTON BLVD in BREINIGSVILLE, PA; small business)
$21,412 with Navy for Other Defense -- Applied Research and Exploratory Development (R&D). Signed on 2005-09-24. Completion date: 2005-10-24.
Top industries in this zip code by the number of employees in 2005:
Professional, Scientific, and Technical Services: Process, Physical Distribution, and Logistics Consulting Services (500-999 employees: 1 establishment)
Wholesale Trade: Beer and Ale Merchant Wholesalers (100-249: 1)
Accommodation and Food Services: Full-Service Restaurants (50-99: 1, 20-49: 1)
People in group quarters in 2010:
54 people in nursing facilities/skilled-nursing facilities
7 people in residential treatment centers for juveniles (non-correctional)
People in group quarters in 2000:
58 people in nursing homes
5 people in other noninstitutional group quarters
Fatal accident statistics in 2014:
Fatal accident count: 1
Vehicles involved in fatal accidents: 3
Fatal accidents caused by drunken drivers: 0
Fatalities: 1
Persons involved in fatal accidents: 3
Pedestrians involved in fatal accidents: 0
Fatal accident statistics in 2013:
Fatal accident count: 1
Vehicles involved in fatal accidents: 2
Fatal accidents caused by drunken drivers: 0
Fatalities: 1
Persons involved in fatal accidents: 3
Pedestrians involved in fatal accidents: 0
Home Mortgage Disclosure Act Aggregated Statistics For Year 2009 (Based on 2 partial tracts)
A) FHA, FSA/RHS & VA Home Purchase Loans
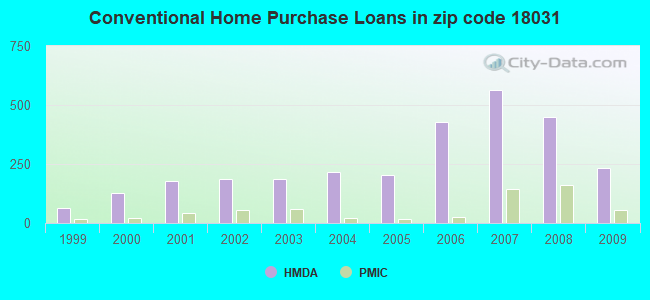
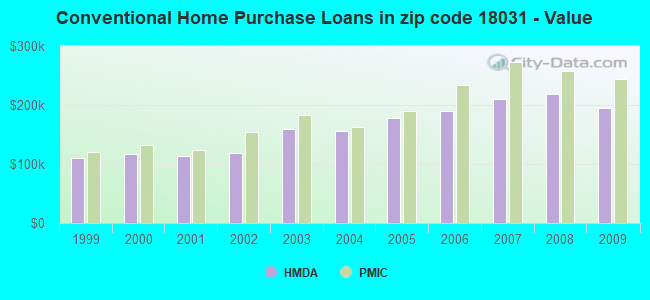
B) Conventional Home Purchase Loans
C) Refinancings
D) Home Improvement Loans
E) Loans on Dwellings For 5+ Families
F) Non-occupant Loans on < 5 Family Dwellings (A B C & D)
G) Loans On Manufactured Home Dwelling (A B C & D)
Number
Average Value
Number
Average Value
Number
Average Value
Number
Average Value
Number
Average Value
Number
Average Value
Number
Average Value
LOANS ORIGINATED
234
$196,983
232
$195,378
455
$221,384
32
$42,750
2
$241,980
26
$129,366
21
$34,645
APPLICATIONS APPROVED, NOT ACCEPTED
18
$218,409
31
$197,591
32
$238,754
6
$7,260
0
$0
5
$101,954
3
$54,850
APPLICATIONS DENIED
37
$179,545
31
$120,522
168
$242,345
18
$30,023
0
$0
6
$88,727
24
$35,490
APPLICATIONS WITHDRAWN
21
$198,577
21
$216,937
77
$250,863
6
$117,495
0
$0
2
$87,115
0
$0
FILES CLOSED FOR INCOMPLETENESS
2
$190,360
3
$37,640
16
$240,367
0
$0
0
$0
0
$0
5
$30,006
Aggregated Statistics For Year 2008 (Based on 2 partial tracts)
A) FHA, FSA/RHS & VA Home Purchase Loans
B) Conventional Home Purchase Loans
C) Refinancings
D) Home Improvement Loans
F) Non-occupant Loans on < 5 Family Dwellings (A B C & D)
G) Loans On Manufactured Home Dwelling (A B C & D)
Number
Average Value
Number
Average Value
Number
Average Value
Number
Average Value
Number
Average Value
Number
Average Value
LOANS ORIGINATED
108
$221,935
448
$218,632
194
$192,395
53
$36,525
47
$144,433
15
$39,792
APPLICATIONS APPROVED, NOT ACCEPTED
10
$188,583
68
$194,153
55
$221,859
6
$33,070
8
$141,559
6
$51,622
APPLICATIONS DENIED
15
$226,386
71
$159,298
121
$228,154
19
$35,745
8
$142,970
32
$82,223
APPLICATIONS WITHDRAWN
13
$188,620
39
$183,533
48
$217,816
8
$126,031
18
$153,523
0
$0
FILES CLOSED FOR INCOMPLETENESS
5
$229,720
19
$223,811
8
$258,112
0
$0
0
$0
2
$32,265
Aggregated Statistics For Year 2007 (Based on 2 partial tracts)
A) FHA, FSA/RHS & VA Home Purchase Loans
B) Conventional Home Purchase Loans
C) Refinancings
D) Home Improvement Loans
F) Non-occupant Loans on < 5 Family Dwellings (A B C & D)
G) Loans On Manufactured Home Dwelling (A B C & D)
Number
Average Value
Number
Average Value
Number
Average Value
Number
Average Value
Number
Average Value
Number
Average Value
LOANS ORIGINATED
10
$221,331
565
$209,476
142
$162,172
53
$36,799
24
$193,181
27
$44,214
APPLICATIONS APPROVED, NOT ACCEPTED
2
$220,200
134
$175,995
34
$125,403
6
$23,928
10
$192,455
18
$37,552
APPLICATIONS DENIED
2
$306,510
69
$217,665
85
$188,403
19
$64,613
13
$215,548
16
$30,147
APPLICATIONS WITHDRAWN
2
$328,285
106
$172,460
32
$194,743
8
$131,879
8
$182,291
0
$0
FILES CLOSED FOR INCOMPLETENESS
0
$0
15
$231,763
13
$149,035
2
$75,015
0
$0
0
$0
Aggregated Statistics For Year 2006 (Based on 2 partial tracts)
A) FHA, FSA/RHS & VA Home Purchase Loans
B) Conventional Home Purchase Loans
C) Refinancings
D) Home Improvement Loans
E) Loans on Dwellings For 5+ Families
F) Non-occupant Loans on < 5 Family Dwellings (A B C & D)
G) Loans On Manufactured Home Dwelling (A B C & D)
Number
Average Value
Number
Average Value
Number
Average Value
Number
Average Value
Number
Average Value
Number
Average Value
Number
Average Value
LOANS ORIGINATED
3
$210,253
426
$190,460
179
$135,608
65
$29,137
2
$19,358,400
48
$162,933
26
$36,111
APPLICATIONS APPROVED, NOT ACCEPTED
0
$0
63
$166,493
27
$119,914
8
$41,944
0
$0
2
$143,575
11
$54,849
APPLICATIONS DENIED
0
$0
42
$180,448
84
$134,587
16
$43,758
0
$0
8
$126,435
29
$33,488
APPLICATIONS WITHDRAWN
2
$162,935
60
$172,801
68
$128,937
2
$100,825
0
$0
5
$202,940
2
$30,650
FILES CLOSED FOR INCOMPLETENESS
0
$0
3
$162,933
16
$208,204
2
$50,815
0
$0
0
$0
0
$0
Aggregated Statistics For Year 2005 (Based on 2 partial tracts)
A) FHA, FSA/RHS & VA Home Purchase Loans
B) Conventional Home Purchase Loans
C) Refinancings
D) Home Improvement Loans
F) Non-occupant Loans on < 5 Family Dwellings (A B C & D)
G) Loans On Manufactured Home Dwelling (A B C & D)
Number
Average Value
Number
Average Value
Number
Average Value
Number
Average Value
Number
Average Value
Number
Average Value
LOANS ORIGINATED
2
$86,305
202
$178,147
206
$129,651
87
$35,973
34
$156,291
26
$32,326
APPLICATIONS APPROVED, NOT ACCEPTED
2
$144,380
24
$130,535
47
$123,530
3
$80,660
2
$100,825
11
$47,076
APPLICATIONS DENIED
0
$0
42
$109,467
60
$112,843
35
$47,520
3
$191,970
39
$36,979
APPLICATIONS WITHDRAWN
2
$142,770
11
$135,362
53
$135,722
10
$51,622
2
$124,215
2
$43,555
FILES CLOSED FOR INCOMPLETENESS
0
$0
11
$146,068
23
$189,516
2
$48,395
0
$0
0
$0
Aggregated Statistics For Year 2004 (Based on 2 partial tracts)
A) FHA, FSA/RHS & VA Home Purchase Loans
B) Conventional Home Purchase Loans
C) Refinancings
D) Home Improvement Loans
F) Non-occupant Loans on < 5 Family Dwellings (A B C & D)
G) Loans On Manufactured Home Dwelling (A B C & D)
Number
Average Value
Number
Average Value
Number
Average Value
Number
Average Value
Number
Average Value
Number
Average Value
LOANS ORIGINATED
15
$114,429
218
$155,526
200
$130,701
53
$48,305
15
$131,207
23
$36,613
APPLICATIONS APPROVED, NOT ACCEPTED
0
$0
37
$137,166
37
$104,596
11
$51,183
0
$0
24
$42,951
APPLICATIONS DENIED
2
$106,470
23
$150,378
84
$96,331
19
$24,707
2
$37,105
16
$48,497
APPLICATIONS WITHDRAWN
0
$0
15
$170,031
34
$147,086
15
$35,813
0
$0
0
$0
FILES CLOSED FOR INCOMPLETENESS
0
$0
3
$220,470
15
$129,917
2
$40,330
0
$0
0
$0
Aggregated Statistics For Year 2003 (Based on 2 partial tracts)
A) FHA, FSA/RHS & VA Home Purchase Loans
B) Conventional Home Purchase Loans
C) Refinancings
D) Home Improvement Loans
F) Non-occupant Loans on < 5 Family Dwellings (A B C & D)
Number
Average Value
Number
Average Value
Number
Average Value
Number
Average Value
Number
Average Value
LOANS ORIGINATED
10
$136,477
186
$159,958
453
$133,215
24
$29,105
31
$86,072
APPLICATIONS APPROVED, NOT ACCEPTED
0
$0
11
$82,566
56
$108,171
6
$34,953
5
$120,668
APPLICATIONS DENIED
5
$146,802
35
$62,915
98
$111,689
16
$19,056
13
$72,842
APPLICATIONS WITHDRAWN
0
$0
16
$145,994
61
$137,810
3
$19,360
3
$74,207
FILES CLOSED FOR INCOMPLETENESS
0
$0
10
$159,062
3
$156,480
0
$0
0
$0
Aggregated Statistics For Year 2002 (Based on 2 partial tracts)
A) FHA, FSA/RHS & VA Home Purchase Loans
B) Conventional Home Purchase Loans
C) Refinancings
D) Home Improvement Loans
F) Non-occupant Loans on < 5 Family Dwellings (A B C & D)
Number
Average Value
Number
Average Value
Number
Average Value
Number
Average Value
Number
Average Value
LOANS ORIGINATED
15
$103,783
186
$118,457
240
$128,673
35
$26,595
18
$85,589
APPLICATIONS APPROVED, NOT ACCEPTED
0
$0
15
$66,033
32
$110,605
5
$20,326
2
$33,875
APPLICATIONS DENIED
0
$0
39
$53,773
66
$104,174
10
$30,651
3
$114,000
APPLICATIONS WITHDRAWN
2
$17,745
11
$98,698
34
$108,274
2
$20,970
3
$100,020
FILES CLOSED FOR INCOMPLETENESS
0
$0
2
$100,825
5
$70,658
0
$0
0
$0
Aggregated Statistics For Year 2001 (Based on 2 partial tracts)
A) FHA, FSA/RHS & VA Home Purchase Loans
B) Conventional Home Purchase Loans
C) Refinancings
D) Home Improvement Loans
F) Non-occupant Loans on < 5 Family Dwellings (A B C & D)
Number
Average Value
Number
Average Value
Number
Average Value
Number
Average Value
Number
Average Value
LOANS ORIGINATED
13
$106,719
179
$113,699
152
$104,614
32
$34,180
13
$148,415
APPLICATIONS APPROVED, NOT ACCEPTED
0
$0
21
$66,832
21
$56,616
15
$23,337
3
$59,690
APPLICATIONS DENIED
0
$0
15
$36,243
60
$79,719
13
$12,533
2
$53,235
APPLICATIONS WITHDRAWN
2
$62,110
5
$119,376
27
$114,477
10
$33,555
2
$84,695
FILES CLOSED FOR INCOMPLETENESS
0
$0
0
$0
11
$138,002
2
$8,065
0
$0
Aggregated Statistics For Year 2000 (Based on 2 partial tracts)
A) FHA, FSA/RHS & VA Home Purchase Loans
B) Conventional Home Purchase Loans
C) Refinancings
D) Home Improvement Loans
F) Non-occupant Loans on < 5 Family Dwellings (A B C & D)
Number
Average Value
Number
Average Value
Number
Average Value
Number
Average Value
Number
Average Value
LOANS ORIGINATED
10
$106,149
126
$116,957
66
$83,764
21
$24,351
6
$102,977
APPLICATIONS APPROVED, NOT ACCEPTED
0
$0
34
$57,269
15
$52,268
6
$25,812
0
$0
APPLICATIONS DENIED
0
$0
47
$34,117
37
$101,806
6
$8,067
2
$70,980
APPLICATIONS WITHDRAWN
2
$98,405
5
$70,012
26
$89,036
3
$35,490
0
$0
FILES CLOSED FOR INCOMPLETENESS
0
$0
0
$0
3
$86,577
0
$0
0
$0
Aggregated Statistics For Year 1999 (Based on 1 partial tract)
A) FHA, FSA/RHS & VA Home Purchase Loans
B) Conventional Home Purchase Loans
C) Refinancings
D) Home Improvement Loans
F) Non-occupant Loans on < 5 Family Dwellings (A B C & D)
Detailed PMIC statistics for the following Tracts:0062.02
2005 - 2018 National Fire Incident Reporting System (NFIRS) incidents
According to the data from the years 2005 - 2018 the average number of fire incidents per year is 36. The highest number of reported fire incidents - 83 took place in 2012, and the least - 0 in 2006. The data has an increasing trend.
When looking into fire subcategories, the most incidents belonged to: Structure Fires (46.2%), and Outside Fires (27.0%).
Fire incident types reported to NFIRS in Zip Code 18031


 Nearest zip codes: 18195, 18051, 19538, 18087, 19539, 19562.


 : $72,940 in 12 contracts from 2002 to 2006


 According to the data from the years 2005 - 2018 the average number of fire incidents per year is 36. The highest number of reported fire incidents - 83 took place in 2012, and the least - 0 in 2006. The data has an increasing trend.
 When looking into fire subcategories, the most incidents belonged to: Structure Fires (46.2%), and Outside Fires (27.0%).