Estimated zip code population in 2022: 1,446 Zip code population in 2010: 1,438 Zip code population in 2000: 1,486
Houses and condos: 719 Renter-occupied apartments: 93
% of renters here:
15%
State:
31%
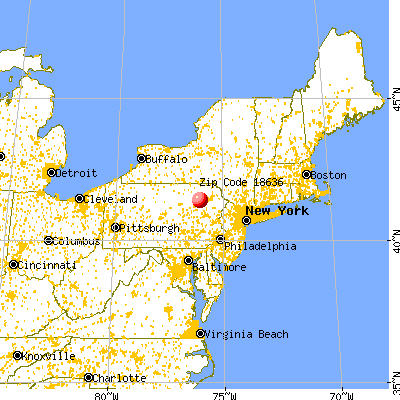
March 2022 cost of living index in zip code 18636: 91.4 (less than average, U.S. average is 100)
Land area: 44.5 sq. mi. Water area: 0.1 sq. mi.
Population density: 33 people per square mile
(very low).
OSM Map
General Map
Google Map
MSN Map
OSM Map
General Map
Google Map
MSN Map
OSM Map
General Map
Google Map
MSN Map
OSM Map
General Map
Google Map
MSN Map
Please wait while loading the map...
Real estate property taxes paid for housing units in 2022:
This zip code:
1.2% ($1,611)
Pennsylvania:
1.3% ($3,094)
Median real estate property taxes paid for housing units with mortgages in 2022: $2,072 (1.2%) Median real estate property taxes paid for housing units with no mortgage in 2022: $1,423 (1.1%)
Business Search- 14 Million verified businesses
Males: 691
(47.8%)
Females: 754
(52.2%)
For population 25 years and over in 18636:
High school or higher: 88.8%
Bachelor's degree or higher: 14.8%
Graduate or professional degree: 3.0%
Unemployed: 7.0%
Mean travel time to work (commute): 33.4 minutes
For population 15 years and over in 18636:
Never married: 24.5%
Now married: 57.0%
Separated: 2.8%
Widowed: 10.0%
Divorced: 5.7%
Zip code 18636 compared to state average:
Median house value below state average.
Black race population percentage significantly below state average.
Hispanic race population percentage significantly below state average.
Median age above state average.
Foreign-born population percentage significantly below state average.
Renting percentage below state average.
Length of stay since moving in significantly above state average.
Number of college students below state average.
Percentage of population with a bachelor's degree or higher below state average.
Averages for the 2020 tax year for zip code 18636, filed in 2021:
Average Adjusted Gross Income (AGI) in 2020: $47,237 (Individual Income Tax Returns)
Here:
$47,237
State:
$75,707
Salary/wage: $43,806 (reported on 76.5% of returns)
Here:
$43,806
State:
$62,806
(% of AGI for various income ranges: 817.1% for AGIs below $25k, 3184.3% for AGIs $25k-50k, 5274.0% for AGIs $50k-75k, 8404.0% for AGIs $75k-100k, 18640.0% for AGIs $100k-200k)
Taxable interest for individuals: $319 (reported on 23.5% of returns)
This zip code:
$319
Pennsylvania:
$1,633
(% of AGI for various income ranges: 2.4% for AGIs below $25k, 10.0% for AGIs $25k-50k, 6.0% for AGIs $50k-75k, 30.0% for AGIs $75k-100k, 30.0% for AGIs $100k-200k)
Ordinary dividends: $2,058 (reported on 17.6% of returns)
Here:
$2,058
State:
$7,382
(% of AGI for various income ranges: 32.4% for AGIs below $25k, 22.9% for AGIs $25k-50k, 109.0% for AGIs $50k-75k, 127.5% for AGIs $100k-200k)
Net capital gain/loss in AGI: +$3,586 (reported on 10.3% of returns)
Here:
+$3,586
State:
+$23,522
(% of AGI for various income ranges: 9.4% for AGIs below $25k, 144.0% for AGIs $50k-75k, 182.0% for AGIs $75k-100k)
Profit/loss from business: +$7,600 (reported on 10.3% of returns)
Here:
+$7,600
State:
+$16,274
(% of AGI for various income ranges: 123.5% for AGIs below $25k, 110.0% for AGIs $25k-50k, 168.0% for AGIs $50k-75k)
Taxable individual retirement arrangement distribution: $17,043 (reported on 10.3% of returns)
18636:
$17,043
Pennsylvania:
$18,583
(% of AGI for various income ranges: 212.4% for AGIs below $25k, 832.0% for AGIs $50k-75k)
Earned income credit: $2,060 (reported on 14.7% of returns)
Here:
$2,060
State:
$2,100
(% of AGI for various income ranges: 68.8% for AGIs below $25k, 63.6% for AGIs $25k-50k)
Percentage of individuals using paid preparers for their 2020 taxes: 88.2%
Here:
88%
State:
92%
(% for various income ranges: 87.5% for AGIs below $25k, 88.9% for AGIs $25k-50k, 91.7% for AGIs $50k-75k, 85.7% for AGIs $75k-100k, 85.7% for AGIs $100k-200k)
Averages for the 2012 tax year for zip code 18636, filed in 2013:
Average Adjusted Gross Income (AGI) in 2012: $40,994 (Individual Income Tax Returns)
Here:
$40,994
State:
$61,346
Salary/wage: $36,732 (reported on 81.5% of returns)
Here:
$36,732
State:
$51,902
(% of AGI for various income ranges: 66.7% for AGIs below $25k, 81.7% for AGIs $25k-50k, 74.7% for AGIs $50k-75k, 72.2% for AGIs $75k-100k, 66.6% for AGIs $100k-200k)
Taxable interest for individuals: $471 (reported on 32.3% of returns)
This zip code:
$471
Pennsylvania:
$1,588
(% of AGI for various income ranges: 0.8% for AGIs below $25k, 0.4% for AGIs $25k-50k, 0.2% for AGIs $50k-75k, 0.4% for AGIs $75k-100k, 0.3% for AGIs $100k-200k)
Ordinary dividends: $1,527 (reported on 23.1% of returns)
Here:
$1,527
State:
$5,827
(% of AGI for various income ranges: 1.3% for AGIs below $25k, 1.0% for AGIs $25k-50k, 0.4% for AGIs $50k-75k, 1.8% for AGIs $75k-100k)
Net capital gain/loss in AGI: +$783 (reported on 9.2% of returns)
Here:
+$783
State:
+$14,495
Profit/loss from business: +$4,917 (reported on 9.2% of returns)
Here:
+$4,917
State:
+$16,268
Taxable individual retirement arrangement distribution: $17,788 (reported on 12.3% of returns)
18636:
$17,788
Pennsylvania:
$14,550
(% of AGI for various income ranges: 5.1% for AGIs below $25k, 10.5% for AGIs $25k-50k, 11.7% for AGIs $75k-100k)
Total itemized deductions: $15,023 (21% of AGI, reported on 20.0% of returns)
Here:
$15,023
State:
$23,538
Here:
21.3% of AGI
State:
18.4% of AGI
(% of AGI for various income ranges: 7.9% for AGIs $25k-50k, 7.3% for AGIs $50k-75k, 9.6% for AGIs $75k-100k, 8.5% for AGIs $100k-200k)
Charity contributions: $2,189 (reported on 13.8% of returns)
Here:
$2,189
State:
$4,025
(% of AGI for various income ranges: 1.2% for AGIs $50k-75k, 1.1% for AGIs $75k-100k, 1.0% for AGIs $100k-200k)
Taxes paid: $4,954 (reported on 20.0% of returns)
18636:
$4,954
State:
$9,982
(% of AGI for various income ranges: 1.7% for AGIs $25k-50k, 2.4% for AGIs $50k-75k, 3.1% for AGIs $75k-100k, 3.8% for AGIs $100k-200k)
Earned income credit: $2,155 (reported on 16.9% of returns)
Here:
$2,155
State:
$2,106
(% of AGI for various income ranges: 5.9% for AGIs below $25k, 1.0% for AGIs $25k-50k)
Percentage of individuals using paid preparers for their 2012 taxes: 52.3%
Here:
52%
State:
53%
(% for various income ranges: 44.4% for AGIs below $25k, 56.2% for AGIs $25k-50k, 54.5% for AGIs $50k-75k, 57.1% for AGIs $75k-100k, 75.0% for AGIs $100k-200k)
Averages for the 2004 tax year for zip code 18636, filed in 2005:
Average Adjusted Gross Income (AGI) in 2004: $36,752 (Individual Income Tax Returns)
Here:
$36,752
State:
$48,049
Salary/wage: $32,127 (reported on 84.4% of returns)
Here:
$32,127
State:
$42,646
(% of AGI for various income ranges: 72.3% for AGIs below $10k, 73.2% for AGIs $10k-25k, 76.3% for AGIs $25k-50k, 83.9% for AGIs $50k-75k, 67.2% for AGIs $75k-100k, 54.9% for AGIs over 100k)
Taxable interest for individuals: $565 (reported on 43.9% of returns)
This zip code:
$565
Pennsylvania:
$1,657
(% of AGI for various income ranges: 1.9% for AGIs below $10k, 2.1% for AGIs $10k-25k, 0.5% for AGIs $25k-50k, 0.4% for AGIs $50k-75k, 0.4% for AGIs $75k-100k, 0.2% for AGIs over 100k)
Taxable dividends: $1,109 (reported on 26.2% of returns)
Here:
$1,109
State:
$3,566
(% of AGI for various income ranges: 2.5% for AGIs below $10k, 1.1% for AGIs $10k-25k, 0.6% for AGIs $25k-50k, 0.6% for AGIs $50k-75k, 1.2% for AGIs $75k-100k, 0.6% for AGIs over 100k)
Net capital gain/loss: +$1,053 (reported on 11.4% of returns)
Here:
+$1,053
State:
+$9,716
(% of AGI for various income ranges: 0.2% for AGIs $10k-25k, 0.7% for AGIs $25k-50k, 0.4% for AGIs $50k-75k, 0.1% for AGIs $75k-100k)
Profit/loss from business: +$4,744 (reported on 12.9% of returns)
Here:
+$4,744
State:
+$14,267
(% of AGI for various income ranges: 10.7% for AGIs below $10k, 4.8% for AGIs $10k-25k, 3.3% for AGIs $25k-50k, -0.1% for AGIs $50k-75k)
Total itemized deductions: $14,136 (21% of AGI, reported on 22.1% of returns)
Here:
$14,136
State:
$18,804
Here:
21.4% of AGI
State:
19.5% of AGI
(% of AGI for various income ranges: 5.4% for AGIs $10k-25k, 8.4% for AGIs $25k-50k, 9.7% for AGIs $50k-75k, 8.9% for AGIs $75k-100k, 9.9% for AGIs over 100k)
Charity contributions deductions: $1,636 (2% of AGI, reported on 19.4% of returns)
Here:
$1,636
State:
$3,337
Here:
2.4% of AGI
State:
3.3% of AGI
(% of AGI for various income ranges: 0.6% for AGIs $10k-25k, 0.8% for AGIs $25k-50k, 0.9% for AGIs $50k-75k, 1.0% for AGIs $75k-100k, 1.2% for AGIs over 100k)
Total tax: $4,548 (reported on 75.2% of returns)
18636:
$4,548
State:
$8,008
(% of AGI for various income ranges: 3.8% for AGIs below $10k, 4.3% for AGIs $10k-25k, 7.2% for AGIs $25k-50k, 8.6% for AGIs $50k-75k, 10.7% for AGIs $75k-100k, 18.7% for AGIs over 100k)
Earned income credit: $1,660 (reported on 15.9% of returns)
Here:
$1,660
State:
$1,643
Percentage of individuals using paid preparers for their 2004 taxes: 56.1%
Here:
56%
State:
56%
(% for various income ranges: 41.4% for AGIs below $10k, 54.4% for AGIs $10k-25k, 56.0% for AGIs $25k-50k, 66.9% for AGIs $50k-75k, 63.6% for AGIs $75k-100k, 81.8% for AGIs over 100k)
Household received Food Stamps/SNAP in the past 12 months: 71 Household did not receive Food Stamps/SNAP in the past 12 months: 558
Women who had a birth in the past 12 months: 17 (9 now married, 6 unmarried) Women who did not have a birth in the past 12 months: 316 (152 now married, 163 unmarried)
Housing units in zip code 18636 with a mortgage: 171 (10 second mortgage, 10 both second mortgage and home equity loan) Houses without a mortgage: 9
Median monthly owner costs for units with a mortgage: $1,391 Median monthly owner costs for units without a mortgage: $434
Residents with income below the poverty level in 2022:
This zip code:
14.3%
Whole state:
11.8%
Residents with income below 50% of the poverty level in 2022:
This zip code:
9.2%
Whole state:
6.1%
Median number of rooms in houses and condos:
Here:
5.8
State:
6.8
Median number of rooms in apartments:
Here:
5.8
State:
4.3
Notable locations in this zip code not listed on our city pages
Streams, rivers, and creeks: Beaver Run (A), York Run (B), Windfall Run (C), Sugar Run (D), Hettesheimer Run (E), Stone Run (F), Broad Hollow Run (G), Cider Run (H), South Run (I). Display/hide their locations on the map
Size of family households: 213 2-persons, 86 3-persons, 54 4-persons, 31 5-persons, 9 6-persons
Size of nonfamily households: 201 1-person, 28 2-persons, 5 4-persons
174 married couples with children.
38 single-parent households (38 women).
99.6% of residents of 18636 zip code speak English at home.
0.2% of residents speak Spanish at home (100% very well).
Foreign born population: 41 (2.9%) (0.0% of them are naturalized citizens)
:
2.9%
Whole state:
7.5%
19%Irish
12%Polish
11%German
10%English
7%American
6%Italian
3%Eastern European
Year of entry for the foreign-born population
492010 or later
32000 to 2009
01990 to 1999
0Before 1990
Housing units lacking complete plumbing facilities: 2.7% Housing units lacking complete kitchen facilities: 0.3%
52.3%Fuel oil, kerosene, etc.
19.8%Bottled, tank, or LP gas
10.5%Coal or coke
9.6%Electricity
8.1%Wood
Population in 1990: 1,653.
Place of birth for U.S.-born residents:
This state: 1,274
Northeast: 73
Midwest: 7
South: 10
West: 24
71% of the 18636 zip code residents lived in the same house 5 years ago. Out of people who lived in different houses, 50% lived in this county. Out of people who lived in different counties, 50% lived in Pennsylvania.
95% of the 18636 zip code residents lived in the same house 1 year ago. Out of people who lived in different houses, 72% moved from this county. Out of people who lived in different houses, 13% moved from different state. Out of people who lived in different houses, 17% moved from abroad.
Private vs. public school enrollment:
Students in private schools in grades 1 to 8 (elementary and middle school): 8
Here:
7.8%
Pennsylvania:
15.7%
Students in private schools in grades 9 to 12 (high school): 2
Here:
2.8%
Pennsylvania:
13.4%
Students in private undergraduate colleges: 24
Here:
75.6%
Pennsylvania:
39.8%
Occupation by median earnings in the past 12 months ($)
116,290Health diagnosing and treating practitioners and other technical occupations
76,581Production occupations
70,259Transportation occupations
66,265Management occupations
53,784Building and grounds cleaning and maintenance occupations
53,631Construction and extraction occupations
Top industries in this zip code by the number of employees in 2005:
Health Care and Social Assistance: Offices of Physicians (except Mental Health Specialists) (20-49 employees: 1 establishment)
Construction: All Other Specialty Trade Contractors (10-19: 1)
Finance and Insurance: Commercial Banking (5-9: 1)
Construction: New Single-Family Housing Construction (except Operative Builders) (1-4: 1)
Construction: Site Preparation Contractors (1-4: 1)
Other Services (except Public Administration): Cemeteries and Crematories (1-4: 1)
Fatal accident statistics in 2013:
Fatal accident count: 1
Vehicles involved in fatal accidents: 1
Fatal accidents caused by drunken drivers: 1
Fatalities: 1
Persons involved in fatal accidents: 1
Pedestrians involved in fatal accidents: 0
Fatal accident statistics in 2012:
Fatal accident count: 1
Vehicles involved in fatal accidents: 1
Fatal accidents caused by drunken drivers: 0
Fatalities: 1
Persons involved in fatal accidents: 1
Pedestrians involved in fatal accidents: 1
Home Mortgage Disclosure Act Aggregated Statistics For Year 2009 (Based on 2 partial tracts)
A) FHA, FSA/RHS & VA Home Purchase Loans
B) Conventional Home Purchase Loans
C) Refinancings
D) Home Improvement Loans
F) Non-occupant Loans on < 5 Family Dwellings (A B C & D)
G) Loans On Manufactured Home Dwelling (A B C & D)
Number
Average Value
Number
Average Value
Number
Average Value
Number
Average Value
Number
Average Value
Number
Average Value
LOANS ORIGINATED
6
$141,897
11
$137,079
40
$172,028
9
$52,522
9
$169,726
2
$57,700
APPLICATIONS APPROVED, NOT ACCEPTED
0
$0
2
$183,780
4
$219,042
3
$20,800
1
$150,440
0
$0
APPLICATIONS DENIED
3
$118,247
4
$124,588
36
$143,226
6
$16,668
2
$89,755
2
$87,615
APPLICATIONS WITHDRAWN
2
$110,270
1
$106,000
7
$148,003
0
$0
0
$0
0
$0
FILES CLOSED FOR INCOMPLETENESS
0
$0
1
$77,790
3
$176,660
0
$0
0
$0
0
$0
Aggregated Statistics For Year 2008 (Based on 2 partial tracts)
A) FHA, FSA/RHS & VA Home Purchase Loans
B) Conventional Home Purchase Loans
C) Refinancings
D) Home Improvement Loans
F) Non-occupant Loans on < 5 Family Dwellings (A B C & D)
G) Loans On Manufactured Home Dwelling (A B C & D)
Number
Average Value
Number
Average Value
Number
Average Value
Number
Average Value
Number
Average Value
Number
Average Value
LOANS ORIGINATED
3
$116,823
13
$133,678
38
$141,829
15
$29,177
8
$147,025
3
$34,477
APPLICATIONS APPROVED, NOT ACCEPTED
0
$0
1
$17,100
4
$127,580
2
$23,080
0
$0
1
$77,790
APPLICATIONS DENIED
1
$70,090
2
$179,080
32
$152,235
9
$83,200
1
$65,820
2
$27,780
APPLICATIONS WITHDRAWN
0
$0
2
$64,535
9
$168,491
1
$102,580
0
$0
1
$64,960
FILES CLOSED FOR INCOMPLETENESS
0
$0
0
$0
6
$172,242
1
$115,400
0
$0
0
$0
Aggregated Statistics For Year 2007 (Based on 2 partial tracts)
A) FHA, FSA/RHS & VA Home Purchase Loans
B) Conventional Home Purchase Loans
C) Refinancings
D) Home Improvement Loans
F) Non-occupant Loans on < 5 Family Dwellings (A B C & D)
G) Loans On Manufactured Home Dwelling (A B C & D)
Number
Average Value
Number
Average Value
Number
Average Value
Number
Average Value
Number
Average Value
Number
Average Value
LOANS ORIGINATED
2
$112,835
25
$133,930
36
$127,128
15
$27,525
6
$182,642
2
$93,600
APPLICATIONS APPROVED, NOT ACCEPTED
0
$0
6
$90,467
7
$119,306
1
$68,380
0
$0
4
$26,712
APPLICATIONS DENIED
1
$106,850
13
$91,464
40
$147,218
11
$72,814
1
$164,980
9
$40,081
APPLICATIONS WITHDRAWN
0
$0
2
$120,955
15
$120,299
7
$53,730
0
$0
0
$0
FILES CLOSED FOR INCOMPLETENESS
0
$0
3
$213,700
7
$177,799
0
$0
0
$0
0
$0
Aggregated Statistics For Year 2006 (Based on 2 partial tracts)
A) FHA, FSA/RHS & VA Home Purchase Loans
B) Conventional Home Purchase Loans
C) Refinancings
D) Home Improvement Loans
F) Non-occupant Loans on < 5 Family Dwellings (A B C & D)
G) Loans On Manufactured Home Dwelling (A B C & D)
Number
Average Value
Number
Average Value
Number
Average Value
Number
Average Value
Number
Average Value
Number
Average Value
LOANS ORIGINATED
2
$104,285
17
$163,418
29
$138,713
14
$67,896
3
$52,713
0
$0
APPLICATIONS APPROVED, NOT ACCEPTED
0
$0
6
$95,025
10
$107,363
0
$0
2
$41,885
1
$58,130
APPLICATIONS DENIED
1
$75,220
2
$130,355
22
$120,643
9
$36,187
0
$0
2
$27,355
APPLICATIONS WITHDRAWN
0
$0
3
$251,880
12
$232,363
2
$18,380
1
$17,100
0
$0
FILES CLOSED FOR INCOMPLETENESS
0
$0
3
$68,100
12
$134,418
0
$0
2
$213,700
0
$0
Aggregated Statistics For Year 2005 (Based on 2 partial tracts)
B) Conventional Home Purchase Loans
C) Refinancings
D) Home Improvement Loans
F) Non-occupant Loans on < 5 Family Dwellings (A B C & D)
G) Loans On Manufactured Home Dwelling (A B C & D)
Number
Average Value
Number
Average Value
Number
Average Value
Number
Average Value
Number
Average Value
LOANS ORIGINATED
18
$202,683
37
$168,881
10
$35,303
5
$214,042
2
$40,605
APPLICATIONS APPROVED, NOT ACCEPTED
4
$266,912
9
$79,401
1
$47,010
2
$158,995
0
$0
APPLICATIONS DENIED
7
$62,034
27
$115,050
7
$26,499
3
$26,213
3
$44,163
APPLICATIONS WITHDRAWN
3
$100,297
26
$150,116
0
$0
1
$427,400
0
$0
FILES CLOSED FOR INCOMPLETENESS
0
$0
1
$100,010
0
$0
0
$0
0
$0
Aggregated Statistics For Year 2004 (Based on 2 partial tracts)
B) Conventional Home Purchase Loans
C) Refinancings
D) Home Improvement Loans
F) Non-occupant Loans on < 5 Family Dwellings (A B C & D)
G) Loans On Manufactured Home Dwelling (A B C & D)
Number
Average Value
Number
Average Value
Number
Average Value
Number
Average Value
Number
Average Value
LOANS ORIGINATED
18
$179,651
41
$102,951
12
$47,299
5
$181,388
1
$80,350
APPLICATIONS APPROVED, NOT ACCEPTED
3
$253,590
9
$115,018
2
$81,205
1
$273,540
0
$0
APPLICATIONS DENIED
7
$118,696
44
$102,226
7
$23,324
3
$46,443
3
$44,450
APPLICATIONS WITHDRAWN
2
$125,655
19
$151,479
2
$23,935
0
$0
0
$0
FILES CLOSED FOR INCOMPLETENESS
2
$165,405
6
$85,622
0
$0
0
$0
0
$0
Aggregated Statistics For Year 2003 (Based on 2 partial tracts)
A) FHA, FSA/RHS & VA Home Purchase Loans
B) Conventional Home Purchase Loans
C) Refinancings
D) Home Improvement Loans
F) Non-occupant Loans on < 5 Family Dwellings (A B C & D)
Number
Average Value
Number
Average Value
Number
Average Value
Number
Average Value
Number
Average Value
LOANS ORIGINATED
1
$58,980
20
$119,800
76
$104,207
11
$55,951
9
$123,851
APPLICATIONS APPROVED, NOT ACCEPTED
1
$80,350
0
$0
24
$100,866
3
$61,547
0
$0
APPLICATIONS DENIED
0
$0
5
$120,698
42
$90,914
11
$37,378
1
$149,590
APPLICATIONS WITHDRAWN
0
$0
1
$141,900
19
$98,077
0
$0
0
$0
FILES CLOSED FOR INCOMPLETENESS
0
$0
0
$0
3
$158,137
0
$0
0
$0
Aggregated Statistics For Year 2002 (Based on 2 partial tracts)
A) FHA, FSA/RHS & VA Home Purchase Loans
B) Conventional Home Purchase Loans
C) Refinancings
D) Home Improvement Loans
F) Non-occupant Loans on < 5 Family Dwellings (A B C & D)
Number
Average Value
Number
Average Value
Number
Average Value
Number
Average Value
Number
Average Value
LOANS ORIGINATED
1
$101,720
9
$176,943
33
$83,149
4
$40,602
3
$76,647
APPLICATIONS APPROVED, NOT ACCEPTED
1
$58,130
1
$113,690
6
$116,538
3
$25,643
1
$63,260
APPLICATIONS DENIED
0
$0
1
$55,560
23
$97,893
3
$31,057
2
$135,485
APPLICATIONS WITHDRAWN
0
$0
2
$56,845
13
$74,631
0
$0
0
$0
FILES CLOSED FOR INCOMPLETENESS
0
$0
0
$0
2
$129,500
0
$0
0
$0
Aggregated Statistics For Year 2001 (Based on 2 partial tracts)
A) FHA, FSA/RHS & VA Home Purchase Loans
B) Conventional Home Purchase Loans
C) Refinancings
D) Home Improvement Loans
F) Non-occupant Loans on < 5 Family Dwellings (A B C & D)
Number
Average Value
Number
Average Value
Number
Average Value
Number
Average Value
Number
Average Value
LOANS ORIGINATED
2
$55,990
12
$115,327
45
$78,888
11
$31,316
2
$102,150
APPLICATIONS APPROVED, NOT ACCEPTED
0
$0
3
$69,810
12
$79,425
5
$22,396
0
$0
APPLICATIONS DENIED
0
$0
2
$89,325
22
$78,486
11
$38,622
1
$148,740
APPLICATIONS WITHDRAWN
0
$0
1
$76,930
20
$110,227
2
$68,385
0
$0
FILES CLOSED FOR INCOMPLETENESS
0
$0
0
$0
3
$168,680
3
$21,653
0
$0
Aggregated Statistics For Year 2000 (Based on 2 partial tracts)
A) FHA, FSA/RHS & VA Home Purchase Loans
B) Conventional Home Purchase Loans
C) Refinancings
D) Home Improvement Loans
F) Non-occupant Loans on < 5 Family Dwellings (A B C & D)
Number
Average Value
Number
Average Value
Number
Average Value
Number
Average Value
Number
Average Value
LOANS ORIGINATED
6
$76,505
15
$110,725
29
$54,294
20
$29,704
3
$100,297
APPLICATIONS APPROVED, NOT ACCEPTED
0
$0
5
$78,470
9
$60,216
3
$13,107
0
$0
APPLICATIONS DENIED
0
$0
5
$93,344
28
$71,406
7
$26,621
1
$182,930
APPLICATIONS WITHDRAWN
2
$69,665
1
$53,000
15
$89,298
1
$94,880
1
$119,670
FILES CLOSED FOR INCOMPLETENESS
0
$0
0
$0
3
$124,230
1
$21,370
0
$0
Aggregated Statistics For Year 1999 (Based on 1 partial tract)
A) FHA, FSA/RHS & VA Home Purchase Loans
B) Conventional Home Purchase Loans
C) Refinancings
D) Home Improvement Loans
F) Non-occupant Loans on < 5 Family Dwellings (A B C & D)


 Nearest zip codes: 18618, 18656, 18629, 18612, 18621, 18708.


