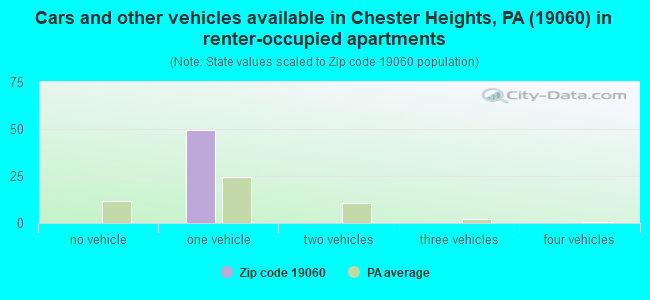
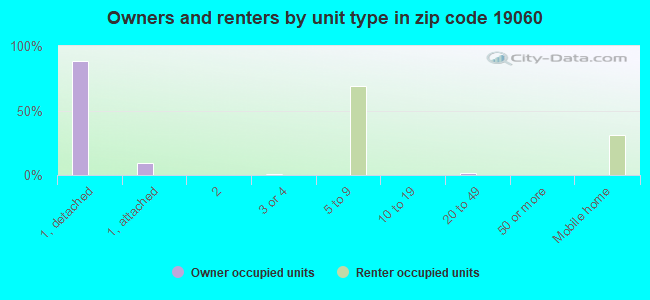
Houses and condos: 3,830 Renter-occupied apartments: 49
% of renters here:
1%
State:
31%
March 2022 cost of living index in zip code 19060: 95.1 (less than average, U.S. average is 100)
Land area: 7.8 sq. mi. Water area: 0.0 sq. mi.
Population density: 1,430 people per square mile
(low).
OSM Map
Google Map
MSN Map
OSM Map
General Map
Google Map
MSN Map
OSM Map
Google Map
MSN Map
OSM Map
Google Map
MSN Map
Please wait while loading the map...
Real estate property taxes paid for housing units in 2022:
This zip code:
1.7% ($8,733)
Pennsylvania:
1.3% ($3,094)
Median real estate property taxes paid for housing units with mortgages in 2022: $9,219 (1.7%) Median real estate property taxes paid for housing units with no mortgage in 2022: $7,723 (1.6%)
Business Search- 14 Million verified businesses
Males: 5,904
(52.6%)
Females: 5,318
(47.4%)
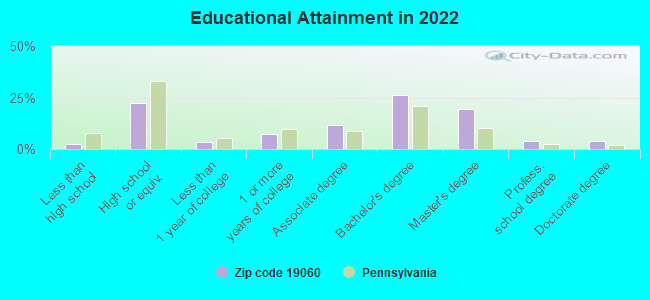
For population 25 years and over in 19060:
High school or higher: 98.9%
Bachelor's degree or higher: 53.8%
Graduate or professional degree: 27.3%
Unemployed: 2.6%
Mean travel time to work (commute): 30.9 minutes
For population 15 years and over in 19060:
Never married: 28.3%
Now married: 61.6%
Separated: 0.0%
Widowed: 6.9%
Divorced: 3.3%
Zip code 19060 compared to state average:
Median household income above state average.
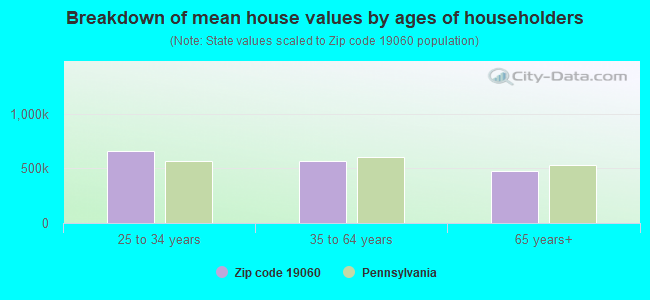
Median house value above state average.
Black race population percentage significantly below state average.
Hispanic race population percentage significantly below state average.
Median age above state average.
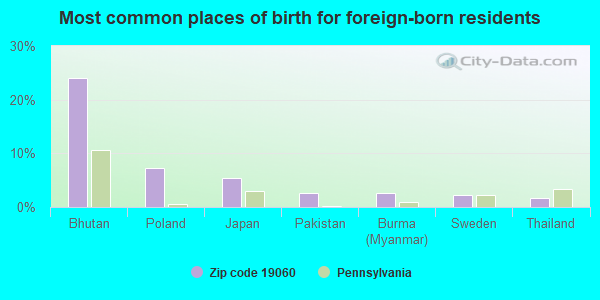
Foreign-born population percentage above state average.
Renting percentage significantly below state average.
Length of stay since moving in significantly above state average.
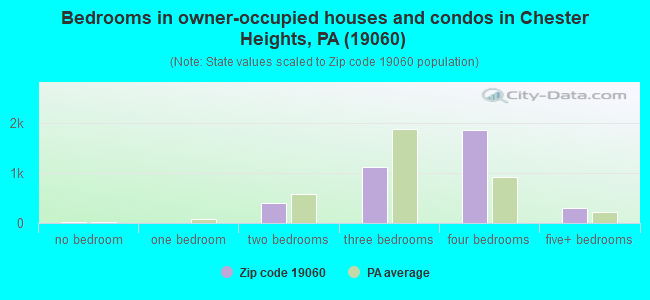
Number of rooms per house above state average.
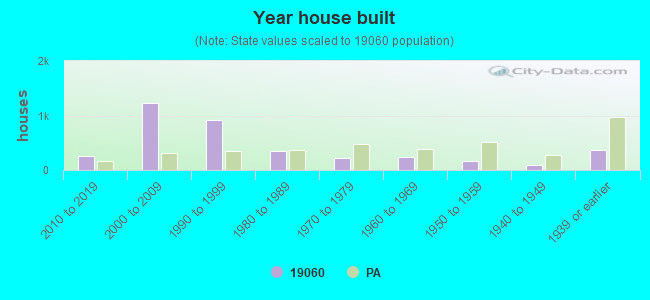
House age significantly below state average.
Percentage of population with a bachelor's degree or higher above state average.
Estimated median house/condo value in 2022: $528,335
19060:
$528,335
Pennsylvania:
$245,500
According to our research of Pennsylvania and other state lists, there were 3 registered sex offenders living in 19060 zip code as of May 05, 2024. The ratio of all residents to sex offenders in zip code 19060 is 3,761 to 1. The ratio of registered sex offenders to all residents in this zip code is much lower than the state average.
Median resident age:
This zip code:
47.5 years
Pennsylvania median age:
40.9 years
Average household size:
This zip code:
3.0 people
Pennsylvania:
2.4 people
Averages for the 2020 tax year for zip code 19060, filed in 2021:
Average Adjusted Gross Income (AGI) in 2020: $155,128 (Individual Income Tax Returns)
Here:
$155,128
State:
$75,707
Salary/wage: $130,070 (reported on 77.4% of returns)
Here:
$130,070
State:
$62,806
(% of AGI for various income ranges: 983.0% for AGIs below $25k, 3174.7% for AGIs $25k-50k, 5628.9% for AGIs $50k-75k, 8230.0% for AGIs $75k-100k, 17316.8% for AGIs $100k-200k, 85110.9% for AGIs over 200k)
Taxable interest for individuals: $1,878 (reported on 55.0% of returns)
This zip code:
$1,878
Pennsylvania:
$1,633
(% of AGI for various income ranges: 40.4% for AGIs below $25k, 73.5% for AGIs $25k-50k, 99.7% for AGIs $50k-75k, 143.6% for AGIs $75k-100k, 191.6% for AGIs $100k-200k, 683.3% for AGIs over 200k)
Ordinary dividends: $6,786 (reported on 45.1% of returns)
Here:
$6,786
State:
$7,382
(% of AGI for various income ranges: 70.1% for AGIs below $25k, 141.2% for AGIs $25k-50k, 271.4% for AGIs $50k-75k, 441.4% for AGIs $75k-100k, 591.2% for AGIs $100k-200k, 2164.0% for AGIs over 200k)
Net capital gain/loss in AGI: +$20,987 (reported on 39.1% of returns)
Here:
+$20,987
State:
+$23,522
(% of AGI for various income ranges: 28.8% for AGIs below $25k, 95.1% for AGIs $25k-50k, 213.2% for AGIs $50k-75k, 442.5% for AGIs $75k-100k, 602.4% for AGIs $100k-200k, 8884.4% for AGIs over 200k)
Profit/loss from business: +$29,886 (reported on 14.6% of returns)
Here:
+$29,886
State:
+$16,274
(% of AGI for various income ranges: 103.8% for AGIs below $25k, 219.0% for AGIs $25k-50k, 244.1% for AGIs $50k-75k, 242.9% for AGIs $75k-100k, 679.5% for AGIs $100k-200k, 3677.8% for AGIs over 200k)
Taxable individual retirement arrangement distribution: $30,988 (reported on 16.5% of returns)
19060:
$30,988
Pennsylvania:
$18,583
(% of AGI for various income ranges: 114.1% for AGIs below $25k, 294.3% for AGIs $25k-50k, 664.3% for AGIs $50k-75k, 1118.6% for AGIs $75k-100k, 1282.5% for AGIs $100k-200k, 2643.6% for AGIs over 200k)
Self-employed (Keogh) retirement plans: $28,945 (reported on 1.9% of returns)
19060:
$28,945
Pennsylvania:
$25,407
(% of AGI for various income ranges: 51.3% for AGIs $100k-200k, 622.0% for AGIs over 200k)
Total itemized deductions: $33,242 (reported on 21.7% of returns)
Here:
$33,242
State:
$34,850
(% of AGI for various income ranges: 118.5% for AGIs below $25k, 302.7% for AGIs $25k-50k, 611.9% for AGIs $50k-75k, 1017.5% for AGIs $75k-100k, 1425.1% for AGIs $100k-200k, 5187.1% for AGIs over 200k)
Charity contributions: $7,864 (reported on 18.9% of returns)
Here:
$7,864
State:
$12,392
(% of AGI for various income ranges: 8.1% for AGIs below $25k, 40.4% for AGIs $25k-50k, 60.0% for AGIs $50k-75k, 132.1% for AGIs $75k-100k, 214.0% for AGIs $100k-200k, 1357.8% for AGIs over 200k)
Taxes paid: $9,218 (reported on 21.7% of returns)
19060:
$9,218
State:
$8,200
(% of AGI for various income ranges: 34.0% for AGIs below $25k, 94.3% for AGIs $25k-50k, 193.0% for AGIs $50k-75k, 366.8% for AGIs $75k-100k, 451.5% for AGIs $100k-200k, 1259.3% for AGIs over 200k)
Earned income credit: $1,584 (reported on 3.3% of returns)
Here:
$1,584
State:
$2,100
(% of AGI for various income ranges: 24.8% for AGIs below $25k, 23.5% for AGIs $25k-50k)
Percentage of individuals using paid preparers for their 2020 taxes: 89.9%
Here:
90%
State:
92%
(% for various income ranges: 86.4% for AGIs below $25k, 91.5% for AGIs $25k-50k, 89.3% for AGIs $50k-75k, 91.8% for AGIs $75k-100k, 90.4% for AGIs $100k-200k, 91.7% for AGIs over 200k)
Averages for the 2012 tax year for zip code 19060, filed in 2013:
Average Adjusted Gross Income (AGI) in 2012: $117,974 (Individual Income Tax Returns)
Here:
$117,974
State:
$61,346
Salary/wage: $106,198 (reported on 81.4% of returns)
Here:
$106,198
State:
$51,902
(% of AGI for various income ranges: 69.3% for AGIs below $25k, 66.3% for AGIs $25k-50k, 58.0% for AGIs $50k-75k, 62.7% for AGIs $75k-100k, 78.1% for AGIs $100k-200k, 73.9% for AGIs over 200k)
Taxable interest for individuals: $1,382 (reported on 60.3% of returns)
This zip code:
$1,382
Pennsylvania:
$1,588
(% of AGI for various income ranges: 2.6% for AGIs below $25k, 1.3% for AGIs $25k-50k, 1.4% for AGIs $50k-75k, 1.2% for AGIs $75k-100k, 0.7% for AGIs $100k-200k, 0.5% for AGIs over 200k)
Ordinary dividends: $4,377 (reported on 43.7% of returns)
Here:
$4,377
State:
$5,827
(% of AGI for various income ranges: 4.1% for AGIs below $25k, 2.8% for AGIs $25k-50k, 3.0% for AGIs $50k-75k, 2.2% for AGIs $75k-100k, 1.4% for AGIs $100k-200k, 1.3% for AGIs over 200k)
Net capital gain/loss in AGI: +$5,426 (reported on 35.2% of returns)
Here:
+$5,426
State:
+$14,495
(% of AGI for various income ranges: 0.7% for AGIs $25k-50k, 0.8% for AGIs $50k-75k, 0.6% for AGIs $75k-100k, 1.1% for AGIs $100k-200k, 2.4% for AGIs over 200k)
Profit/loss from business: +$26,614 (reported on 14.0% of returns)
Here:
+$26,614
State:
+$16,268
(% of AGI for various income ranges: 4.6% for AGIs below $25k, 4.6% for AGIs $25k-50k, 2.4% for AGIs $50k-75k, 3.5% for AGIs $75k-100k, 2.6% for AGIs $100k-200k, 3.4% for AGIs over 200k)
Taxable individual retirement arrangement distribution: $21,556 (reported on 16.7% of returns)
19060:
$21,556
Pennsylvania:
$14,550
(% of AGI for various income ranges: 6.9% for AGIs below $25k, 5.7% for AGIs $25k-50k, 5.9% for AGIs $50k-75k, 5.6% for AGIs $75k-100k, 3.8% for AGIs $100k-200k, 1.5% for AGIs over 200k)
Self-employment retirement plans: $26,260 (reported on 1.9% of returns)
19060:
$26,260
Pennsylvania:
$20,922
(% of AGI for various income ranges: 0.2% for AGIs $100k-200k, 0.7% for AGIs over 200k)
Total itemized deductions: $31,100 (18% of AGI, reported on 60.7% of returns)
Here:
$31,100
State:
$23,538
Here:
17.8% of AGI
State:
18.4% of AGI
(% of AGI for various income ranges: 23.3% for AGIs below $25k, 17.4% for AGIs $25k-50k, 20.8% for AGIs $50k-75k, 19.4% for AGIs $75k-100k, 19.2% for AGIs $100k-200k, 12.5% for AGIs over 200k)
Charity contributions: $3,337 (reported on 55.0% of returns)
Here:
$3,337
State:
$4,025
(% of AGI for various income ranges: 1.5% for AGIs below $25k, 1.4% for AGIs $25k-50k, 1.6% for AGIs $50k-75k, 2.0% for AGIs $75k-100k, 1.9% for AGIs $100k-200k, 1.3% for AGIs over 200k)
Taxes paid: $15,954 (reported on 60.5% of returns)
19060:
$15,954
State:
$9,982
(% of AGI for various income ranges: 7.9% for AGIs below $25k, 7.1% for AGIs $25k-50k, 8.6% for AGIs $50k-75k, 9.0% for AGIs $75k-100k, 9.3% for AGIs $100k-200k, 7.4% for AGIs over 200k)
Earned income credit: $1,653 (reported on 3.6% of returns)
Here:
$1,653
State:
$2,106
(% of AGI for various income ranges: 1.8% for AGIs below $25k, 0.3% for AGIs $25k-50k)
Percentage of individuals using paid preparers for their 2012 taxes: 56.1%
Here:
56%
State:
53%
(% for various income ranges: 47.1% for AGIs below $25k, 57.6% for AGIs $25k-50k, 65.3% for AGIs $50k-75k, 60.8% for AGIs $75k-100k, 55.4% for AGIs $100k-200k, 63.6% for AGIs over 200k)
Likely homosexual households (counted as self-reported same-sex unmarried-partner households)
Lesbian couples: 0.4% of all households
Gay men: 0.2% of all households
Household received Food Stamps/SNAP in the past 12 months: 142 Household did not receive Food Stamps/SNAP in the past 12 months: 3,545
Women who had a birth in the past 12 months: 63 (55 now married, 9 unmarried) Women who did not have a birth in the past 12 months: 1,858 (1,017 now married, 831 unmarried)
Housing units in zip code 19060 with a mortgage: 2,245 (276 second mortgage, 40 home equity loan, 228 both second mortgage and home equity loan) Houses without a mortgage: 122
Median monthly owner costs for units with a mortgage: $2,967 Median monthly owner costs for units without a mortgage: $1,101
Residents with income below the poverty level in 2022:
This zip code:
1.8%
Whole state:
11.8%
Residents with income below 50% of the poverty level in 2022:
This zip code:
1.2%
Whole state:
6.1%
Median number of rooms in houses and condos:
Here:
8.3
State:
6.8
Notable locations in this zip code not listed on our city pages
Notable locations in zip code 19060: Bethel Township Building (A), Bethel Township Hose Company 1 Station 66 (B), Bethel Township Police Department (C). Display/hide their locations on the map
In group quarters: 59 (-1 institutionalized population)
Size of family households: 1,094 2-persons, 733 3-persons, 963 4-persons, 262 5-persons, 77 6-persons, 17 7-or-more-persons
Size of nonfamily households: 470 1-person, 33 2-persons
1,994 married couples with children.
133 single-parent households (101 men, 32 women).
85.9% of residents of 19060 zip code speak English at home.
0.4% of residents speak Spanish at home (100% very well).
3.9% of residents speak other Indo-European language at home (62% very well, 23% well, 15% not well).
9.7% of residents speak Asian or Pacific Island language at home (63% very well, 28% well, 8% not well, 1% not at all).
Foreign born population: 1,268 (11.3%) (74.4% of them are naturalized citizens)
This zip code:
11.3%
Whole state:
7.5%
24%Bhutan
7%Poland
5%Japan
3%Pakistan
3%Burma (Myanmar)
2%Sweden
2%Thailand
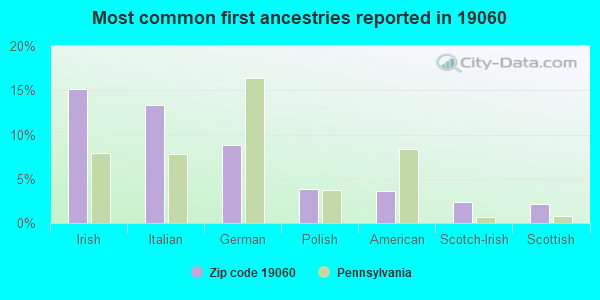
15%Irish
13%Italian
9%German
4%Polish
4%American
2%Scotch-Irish
2%Scottish
Year of entry for the foreign-born population
1932010 or later
2762000 to 2009
4531990 to 1999
293Before 1990
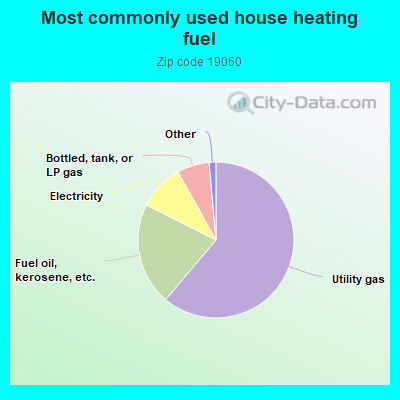
61.3%Utility gas
21.3%Fuel oil, kerosene, etc.
9.5%Electricity
6.7%Bottled, tank, or LP gas
0.7%Wood
0.7%Other fuel
Place of birth for U.S.-born residents:
This state: 7,784
Northeast: 625
Midwest: 220
South: 981
West: 342
98% of the 19060 zip code residents lived in the same house 1 year ago. Out of people who lived in different houses, 41% moved from this county. Out of people who lived in different houses, 43% moved from different county within same state. Out of people who lived in different houses, 21% moved from different state. Out of people who lived in different houses, 13% moved from abroad.
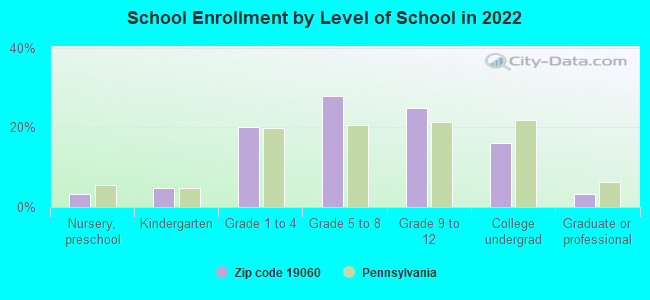
Private vs. public school enrollment:
Students in private schools in grades 1 to 8 (elementary and middle school): 40
Here:
3.3%
Pennsylvania:
15.7%
Students in private schools in grades 9 to 12 (high school): 74
Here:
11.4%
Pennsylvania:
13.4%
Students in private undergraduate colleges: 129
Here:
31.1%
Pennsylvania:
39.8%
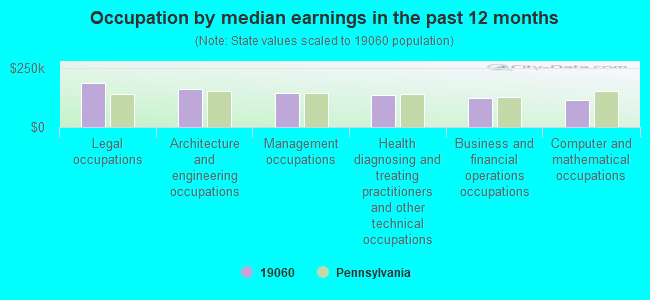
Occupation by median earnings in the past 12 months ($)
185,401Legal occupations
158,240Architecture and engineering occupations
143,265Management occupations
133,608Health diagnosing and treating practitioners and other technical occupations
124,010Business and financial operations occupations
111,954Computer and mathematical occupations
Fatal accident statistics in 2014:
Fatal accident count: 1
Vehicles involved in fatal accidents: 1
Fatal accidents caused by drunken drivers: 1
Fatalities: 1
Persons involved in fatal accidents: 1
Pedestrians involved in fatal accidents: 0
Fatal accident statistics in 2012:
Fatal accident count: 2
Vehicles involved in fatal accidents: 2
Fatal accidents caused by drunken drivers: 1
Fatalities: 2
Persons involved in fatal accidents: 2
Pedestrians involved in fatal accidents: 1
2011 - 2018 National Fire Incident Reporting System (NFIRS) incidents
According to the data from the years 2011 - 2018 the average number of fire incidents per year is 15. The highest number of reported fires - 36 took place in 2017, and the least - 1 in 2014. The data has a growing trend.
When looking into fire subcategories, the most reports belonged to: Structure Fires (62.2%), and Outside Fires (25.2%).
Fire incident types reported to NFIRS in Zip Code 19060


 According to the data from the years 2011 - 2018 the average number of fire incidents per year is 15. The highest number of reported fires - 36 took place in 2017, and the least - 1 in 2014. The data has a growing trend.
 When looking into fire subcategories, the most reports belonged to: Structure Fires (62.2%), and Outside Fires (25.2%).