Estimated zip code population in 2022: 1,072 Zip code population in 2010: 535 Zip code population in 2000: 573
Houses and condos: 555 Renter-occupied apartments: 24
% of renters here:
5%
State:
32%
March 2022 cost of living index in zip code 20629: 159.2 (very high, U.S. average is 100)
Land area: 0.4 sq. mi. Water area: 0.2 sq. mi.
Population density: 2,486 people per square mile
(low).
OSM Map
General Map
Google Map
MSN Map
OSM Map
General Map
Google Map
MSN Map
OSM Map
General Map
Google Map
MSN Map
OSM Map
General Map
Google Map
MSN Map
Please wait while loading the map...
Real estate property taxes paid for housing units in 2022:
This zip code:
0.8% ($3,758)
Maryland:
0.9% ($3,777)
Median real estate property taxes paid for housing units with mortgages in 2022: $3,628 (0.7%) Median real estate property taxes paid for housing units with no mortgage in 2022: $4,099 (0.7%)
Business Search- 14 Million verified businesses
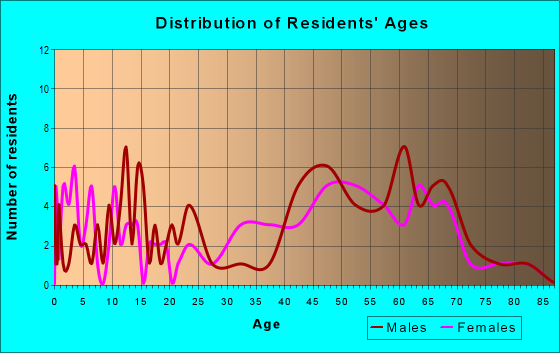
Males: 619
(57.7%)
Females: 453
(42.3%)
For population 25 years and over in 20629:
High school or higher: 95.9%
Bachelor's degree or higher: 48.4%
Graduate or professional degree: 29.0%
Mean travel time to work (commute): 19.0 minutes
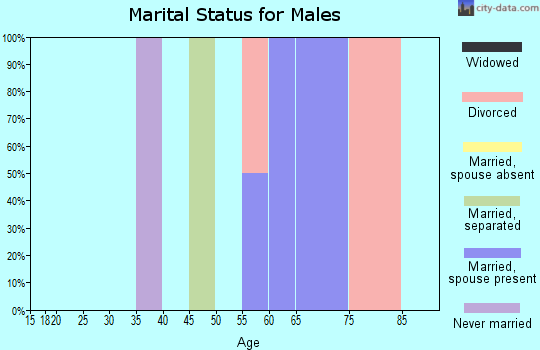
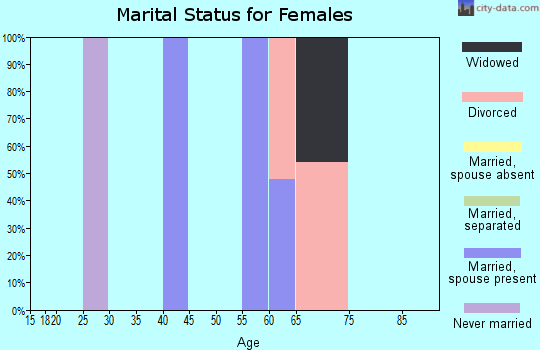
For population 15 years and over in 20629:
Never married: 22.3%
Now married: 61.2%
Separated: 0.7%
Widowed: 4.5%
Divorced: 11.4%
Zip code 20629 compared to state average:
Unemployed percentage significantly below state average.
Black race population percentage significantly below state average.
Hispanic race population percentage below state average.
Median age significantly above state average.
Renting percentage significantly below state average.
Length of stay since moving in significantly below state average.
Estimated median house/condo value in 2022: $493,100
20629:
$493,100
Maryland:
$398,100
Median resident age:
This zip code:
56.0 years
Maryland median age:
39.7 years
Average household size:
This zip code:
2.2 people
Maryland:
2.5 people
Averages for the 2004 tax year for zip code 20629, filed in 2005:
Average Adjusted Gross Income (AGI) in 2004: $81,899 (Individual Income Tax Returns)
Here:
$81,899
State:
$60,339
Salary/wage: $64,789 (reported on 75.7% of returns)
Here:
$64,789
State:
$52,211
(% of AGI for various income ranges: 96.9% for AGIs below $10k, 71.7% for AGIs $10k-25k, 64.8% for AGIs $25k-50k, 58.3% for AGIs $50k-75k, 77.4% for AGIs $75k-100k, 55.0% for AGIs over 100k)
Taxable interest for individuals: $1,927 (reported on 56.8% of returns)
This zip code:
$1,927
Maryland:
$1,701
(% of AGI for various income ranges: 4.1% for AGIs below $10k, 0.8% for AGIs $25k-50k, 0.5% for AGIs $50k-75k, 0.6% for AGIs $75k-100k, 1.8% for AGIs over 100k)
Taxable dividends: $532 (reported on 27.8% of returns)
Here:
$532
State:
$4,235
Net capital gain/loss: +$3,200 (reported on 23.7% of returns)
Here:
+$3,200
State:
+$15,888
Profit/loss from business: +$2,217 (reported on 13.6% of returns)
Here:
+$2,217
State:
+$12,221
Total itemized deductions: $21,796 (22% of AGI, reported on 58.0% of returns)
Here:
$21,796
State:
$22,960
Here:
22.5% of AGI
State:
23.3% of AGI
(% of AGI for various income ranges: 21.7% for AGIs $25k-50k, 22.3% for AGIs $50k-75k, 19.8% for AGIs $75k-100k, 13.4% for AGIs over 100k)
Charity contributions deductions: $3,185 (3% of AGI, reported on 54.4% of returns)
Here:
$3,185
State:
$4,031
Here:
3.2% of AGI
State:
3.9% of AGI
(% of AGI for various income ranges: 2.1% for AGIs $25k-50k, 4.5% for AGIs $50k-75k, 3.4% for AGIs $75k-100k, 1.5% for AGIs over 100k)
Total tax: $12,496 (reported on 83.4% of returns)
20629:
$12,496
State:
$10,167
(% of AGI for various income ranges: 3.1% for AGIs $10k-25k, 7.2% for AGIs $25k-50k, 9.7% for AGIs $50k-75k, 9.4% for AGIs $75k-100k, 15.3% for AGIs over 100k)
Percentage of individuals using paid preparers for their 2004 taxes: 53.3%
Here:
53%
State:
55%
(% for various income ranges: 47.8% for AGIs below $10k, 70.8% for AGIs $10k-25k, 74.1% for AGIs $25k-50k, 78.6% for AGIs $50k-75k, 43.5% for AGIs over 100k)
Household received Food Stamps/SNAP in the past 12 months: 10 Household did not receive Food Stamps/SNAP in the past 12 months: 432
Women who did not have a birth in the past 12 months: 126 (65 now married, 60 unmarried)
Housing units in zip code 20629 with a mortgage: 322 (37 second mortgage, 39 both second mortgage and home equity loan) Median monthly owner costs for units with a mortgage: $2,646 Median monthly owner costs for units without a mortgage: $1,288
Residents with income below the poverty level in 2022:
This zip code:
1.2%
Whole state:
9.6%
Median number of rooms in houses and condos:
Here:
6.0
State:
7.3
Notable locations in this zip code not listed on our city pages
In group quarters: 92 (-1 institutionalized population)
Size of family households: 241 2-persons, 87 4-persons
Size of nonfamily households: 88 1-person, 32 2-persons
105 married couples with children.
0 single-parent households ().
89.6% of residents of 20629 zip code speak English at home.
5.3% of residents speak other Indo-European language at home (100% very well).
5.2% of residents speak Asian or Pacific Island language at home (50% very well, 50% not well).
Foreign born population: 160 (14.9%) (75.4% of them are naturalized citizens)
This zip code:
14.9%
Whole state:
16.7%
18%Thailand
16%France
13%Georgia
4%Japan
24%English
8%German
4%Irish
3%American
3%Polish
2%French
1%Scotch-Irish
Year of entry for the foreign-born population
102010 or later
542000 to 2009
581990 to 1999
33Before 1990
Housing units lacking complete plumbing facilities: 8.2%
61.2%Electricity
39.0%Utility gas
Place of birth for U.S.-born residents:
This state: 260
Northeast: 116
Midwest: 24
South: 404
West: 87
34% of the 20629 zip code residents lived in the same house 5 years ago. Out of people who lived in different houses, 54% lived in this county. Out of people who lived in different counties, 50% lived in Maryland.
90% of the 20629 zip code residents lived in the same house 1 year ago. Out of people who lived in different houses, 27% moved from this county. Out of people who lived in different houses, 41% moved from different county within same state. Out of people who lived in different houses, 23% moved from different state. Out of people who lived in different houses, 10% moved from abroad.
Private vs. public school enrollment:
Students in private schools in grades 1 to 8 (elementary and middle school): 47
Here:
51.0%
Maryland:
15.2%
Students in private schools in grades 9 to 12 (high school):
Here:
0.0%
Maryland:
14.4%
Students in private undergraduate colleges: 7
Here:
25.1%
Maryland:
20.2%
Occupation by median earnings in the past 12 months ($)
150,771Management occupations
62,311Computer and mathematical occupations
16,645Business and financial operations occupations
Companies with federal contracts located in this zip code:
CONNIE L. REEVES (774 BELLE FIELD RD in DOWELL, MD) : $4,000 in 2 contractsin 2000
$4,000 with Army for ADP Facility Operation and Maintenance Services. Signed on 2000-09-14. Completion date: 2001-07-02.
$0, same as above.Signed on 2000-09-14. Completion date: 2001-07-02.
Top industries in this zip code by the number of employees in 2005:
Real Estate and Rental and Leasing: Lessors of Nonresidential Buildings (except Miniwarehouses) (10-19 employees: 1 establishment)
Construction: Other Heavy and Civil Engineering Construction (5-9: 1, 1-4: 1)
Accommodation and Food Services: Full-Service Restaurants (1-4: 2)
Other Services (except Public Administration): Other Personal and Household Goods Repair and Maintenance (1-4: 2)
Professional, Scientific, and Technical Services: Computer Systems Design Services (1-4: 1)
Professional, Scientific, and Technical Services: Other Computer Related Services (1-4: 1)
Arts, Entertainment, and Recreation: Marinas (1-4: 1)
Construction: New Single-Family Housing Construction (except Operative Builders) (1-4: 1)
People in group quarters in 2000:
127 people in nursing homes
Home Mortgage Disclosure Act Aggregated Statistics For Year 2009 (Based on 2 partial tracts)
A) FHA, FSA/RHS & VA Home Purchase Loans
B) Conventional Home Purchase Loans
C) Refinancings
F) Non-occupant Loans on < 5 Family Dwellings (A B C & D)
Number
Average Value
Number
Average Value
Number
Average Value
Number
Average Value
LOANS ORIGINATED
2
$256,370
3
$218,177
12
$249,158
2
$225,065
APPLICATIONS APPROVED, NOT ACCEPTED
0
$0
0
$0
1
$314,270
0
$0
APPLICATIONS DENIED
1
$155,850
0
$0
4
$305,872
1
$157,360
APPLICATIONS WITHDRAWN
1
$115,250
0
$0
3
$285,973
0
$0
FILES CLOSED FOR INCOMPLETENESS
0
$0
0
$0
1
$137,090
0
$0
Aggregated Statistics For Year 2008 (Based on 2 partial tracts)
A) FHA, FSA/RHS & VA Home Purchase Loans
B) Conventional Home Purchase Loans
C) Refinancings
D) Home Improvement Loans
F) Non-occupant Loans on < 5 Family Dwellings (A B C & D)
Number
Average Value
Number
Average Value
Number
Average Value
Number
Average Value
Number
Average Value
LOANS ORIGINATED
2
$221,590
3
$234,080
8
$237,986
1
$93,690
2
$261,660
APPLICATIONS APPROVED, NOT ACCEPTED
0
$0
0
$0
1
$225,900
0
$0
0
$0
APPLICATIONS DENIED
0
$0
1
$130,140
7
$250,936
1
$116,820
1
$177,910
APPLICATIONS WITHDRAWN
0
$0
0
$0
3
$219,520
0
$0
0
$0
FILES CLOSED FOR INCOMPLETENESS
0
$0
0
$0
1
$207,930
0
$0
0
$0
Aggregated Statistics For Year 2007 (Based on 2 partial tracts)
A) FHA, FSA/RHS & VA Home Purchase Loans
B) Conventional Home Purchase Loans
C) Refinancings
D) Home Improvement Loans
F) Non-occupant Loans on < 5 Family Dwellings (A B C & D)
Number
Average Value
Number
Average Value
Number
Average Value
Number
Average Value
Number
Average Value
LOANS ORIGINATED
1
$218,790
6
$258,450
10
$248,534
2
$148,595
2
$278,265
APPLICATIONS APPROVED, NOT ACCEPTED
0
$0
1
$216,330
2
$236,850
1
$60,930
0
$0
APPLICATIONS DENIED
0
$0
1
$280,340
11
$251,445
2
$120,175
1
$227,530
APPLICATIONS WITHDRAWN
0
$0
1
$243,100
4
$274,245
0
$0
0
$0
FILES CLOSED FOR INCOMPLETENESS
0
$0
0
$0
2
$259,475
0
$0
0
$0
Aggregated Statistics For Year 2006 (Based on 2 partial tracts)
A) FHA, FSA/RHS & VA Home Purchase Loans
B) Conventional Home Purchase Loans
C) Refinancings
D) Home Improvement Loans
F) Non-occupant Loans on < 5 Family Dwellings (A B C & D)
Number
Average Value
Number
Average Value
Number
Average Value
Number
Average Value
Number
Average Value
LOANS ORIGINATED
1
$147,670
10
$202,087
19
$235,256
2
$90,665
4
$219,170
APPLICATIONS APPROVED, NOT ACCEPTED
0
$0
1
$172,700
3
$174,087
1
$74,700
0
$0
APPLICATIONS DENIED
0
$0
1
$216,940
10
$238,112
2
$125,495
1
$177,580
APPLICATIONS WITHDRAWN
0
$0
1
$260,400
8
$214,151
1
$50,680
0
$0
FILES CLOSED FOR INCOMPLETENESS
0
$0
0
$0
2
$200,060
0
$0
0
$0
Aggregated Statistics For Year 2005 (Based on 2 partial tracts)
A) FHA, FSA/RHS & VA Home Purchase Loans
B) Conventional Home Purchase Loans
C) Refinancings
D) Home Improvement Loans
F) Non-occupant Loans on < 5 Family Dwellings (A B C & D)
Number
Average Value
Number
Average Value
Number
Average Value
Number
Average Value
Number
Average Value
LOANS ORIGINATED
1
$355,600
19
$225,082
23
$215,870
3
$120,287
8
$230,405
APPLICATIONS APPROVED, NOT ACCEPTED
0
$0
1
$239,680
3
$226,633
0
$0
1
$182,110
APPLICATIONS DENIED
0
$0
2
$193,760
9
$185,367
2
$48,470
1
$226,130
APPLICATIONS WITHDRAWN
0
$0
2
$249,985
9
$201,619
1
$210,730
1
$255,980
FILES CLOSED FOR INCOMPLETENESS
0
$0
0
$0
2
$206,080
0
$0
0
$0
Aggregated Statistics For Year 2004 (Based on 2 partial tracts)
A) FHA, FSA/RHS & VA Home Purchase Loans
B) Conventional Home Purchase Loans
C) Refinancings
D) Home Improvement Loans
F) Non-occupant Loans on < 5 Family Dwellings (A B C & D)
Number
Average Value
Number
Average Value
Number
Average Value
Number
Average Value
Number
Average Value
LOANS ORIGINATED
2
$167,300
12
$193,088
20
$183,641
2
$90,215
5
$203,650
APPLICATIONS APPROVED, NOT ACCEPTED
0
$0
1
$171,580
2
$179,650
0
$0
0
$0
APPLICATIONS DENIED
0
$0
2
$160,075
6
$180,040
2
$64,765
1
$131,100
APPLICATIONS WITHDRAWN
0
$0
2
$170,435
9
$179,872
1
$32,870
1
$228,760
FILES CLOSED FOR INCOMPLETENESS
0
$0
0
$0
1
$152,100
0
$0
0
$0
Aggregated Statistics For Year 2003 (Based on 2 partial tracts)
A) FHA, FSA/RHS & VA Home Purchase Loans
B) Conventional Home Purchase Loans
C) Refinancings
D) Home Improvement Loans
F) Non-occupant Loans on < 5 Family Dwellings (A B C & D)
Number
Average Value
Number
Average Value
Number
Average Value
Number
Average Value
Number
Average Value
LOANS ORIGINATED
3
$165,387
8
$191,009
36
$168,303
2
$71,510
4
$202,902
APPLICATIONS APPROVED, NOT ACCEPTED
0
$0
1
$124,770
5
$150,786
0
$0
1
$88,030
APPLICATIONS DENIED
0
$0
1
$129,810
8
$150,276
1
$21,500
0
$0
APPLICATIONS WITHDRAWN
0
$0
1
$104,100
8
$160,448
0
$0
0
$0
FILES CLOSED FOR INCOMPLETENESS
0
$0
0
$0
1
$156,130
0
$0
0
$0
Aggregated Statistics For Year 2002 (Based on 2 partial tracts)
A) FHA, FSA/RHS & VA Home Purchase Loans
B) Conventional Home Purchase Loans
C) Refinancings
D) Home Improvement Loans
F) Non-occupant Loans on < 5 Family Dwellings (A B C & D)
Number
Average Value
Number
Average Value
Number
Average Value
Number
Average Value
Number
Average Value
LOANS ORIGINATED
3
$147,447
8
$158,571
21
$163,525
1
$19,710
5
$133,964
APPLICATIONS APPROVED, NOT ACCEPTED
0
$0
1
$77,780
2
$184,995
0
$0
0
$0
APPLICATIONS DENIED
0
$0
0
$0
6
$133,897
1
$11,370
0
$0
APPLICATIONS WITHDRAWN
0
$0
0
$0
5
$129,438
0
$0
0
$0
FILES CLOSED FOR INCOMPLETENESS
0
$0
0
$0
1
$217,060
0
$0
0
$0
Aggregated Statistics For Year 2001 (Based on 2 partial tracts)
A) FHA, FSA/RHS & VA Home Purchase Loans
B) Conventional Home Purchase Loans
C) Refinancings
D) Home Improvement Loans
F) Non-occupant Loans on < 5 Family Dwellings (A B C & D)
Number
Average Value
Number
Average Value
Number
Average Value
Number
Average Value
Number
Average Value
LOANS ORIGINATED
4
$126,098
6
$146,150
14
$143,596
1
$26,150
2
$162,960
APPLICATIONS APPROVED, NOT ACCEPTED
0
$0
0
$0
2
$113,290
0
$0
0
$0
APPLICATIONS DENIED
0
$0
0
$0
5
$108,516
1
$38,920
0
$0
APPLICATIONS WITHDRAWN
0
$0
1
$93,630
4
$169,455
0
$0
0
$0
FILES CLOSED FOR INCOMPLETENESS
0
$0
0
$0
1
$77,340
0
$0
0
$0
Aggregated Statistics For Year 2000 (Based on 2 partial tracts)
A) FHA, FSA/RHS & VA Home Purchase Loans
B) Conventional Home Purchase Loans
C) Refinancings
D) Home Improvement Loans
F) Non-occupant Loans on < 5 Family Dwellings (A B C & D)
Number
Average Value
Number
Average Value
Number
Average Value
Number
Average Value
Number
Average Value
LOANS ORIGINATED
3
$116,910
4
$151,102
5
$100,980
1
$41,220
3
$101,863
APPLICATIONS APPROVED, NOT ACCEPTED
0
$0
1
$86,350
1
$77,730
0
$0
0
$0
APPLICATIONS DENIED
0
$0
1
$39,260
5
$68,768
1
$19,880
0
$0
APPLICATIONS WITHDRAWN
0
$0
0
$0
2
$110,010
0
$0
0
$0
FILES CLOSED FOR INCOMPLETENESS
0
$0
0
$0
0
$0
0
$0
0
$0
Aggregated Statistics For Year 1999 (Based on 1 partial tract)
A) FHA, FSA/RHS & VA Home Purchase Loans
B) Conventional Home Purchase Loans
C) Refinancings
D) Home Improvement Loans
F) Non-occupant Loans on < 5 Family Dwellings (A B C & D)


 Nearest zip codes: 20688, 20657, 20670, 20634, 20619, 20653.


 : $4,000 in 2 contracts in 2000


