Estimated zip code population in 2022: 1,783 Zip code population in 2010: 1,591 Zip code population in 2000: 1,521
Houses and condos: 981 Renter-occupied apartments: 142
% of renters here:
18%
State:
32%
March 2022 cost of living index in zip code 21530: 91.8 (less than average, U.S. average is 100)
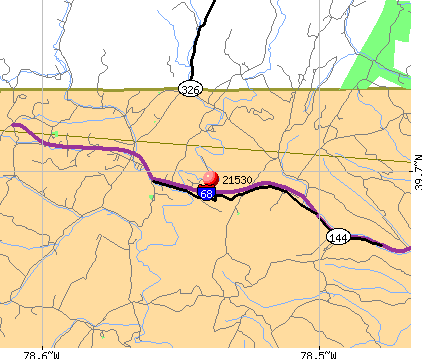
Land area: 56.4 sq. mi. Water area: 0.2 sq. mi.
Population density: 32 people per square mile
(very low).
OSM Map
General Map
Google Map
MSN Map
OSM Map
General Map
Google Map
MSN Map
OSM Map
General Map
Google Map
MSN Map
OSM Map
General Map
Google Map
MSN Map
Please wait while loading the map...
Real estate property taxes paid for housing units in 2022:
This zip code:
0.8% ($1,589)
Maryland:
0.9% ($3,777)
Median real estate property taxes paid for housing units with mortgages in 2022: $2,089 (0.9%) Median real estate property taxes paid for housing units with no mortgage in 2022: $1,362 (0.7%)
Business Search- 14 Million verified businesses
Males: 983
(55.1%)
Females: 800
(44.9%)
For population 25 years and over in 21530:
High school or higher: 85.5%
Bachelor's degree or higher: 20.0%
Graduate or professional degree: 11.8%
Unemployed: 1.0%
Mean travel time to work (commute): 28.0 minutes
For population 15 years and over in 21530:
Never married: 27.0%
Now married: 55.3%
Separated: 0.0%
Widowed: 6.3%
Divorced: 11.4%
Zip code 21530 compared to state average:
Median household income below state average.
Median house value below state average.
Unemployed percentage significantly below state average.
Black race population percentage significantly below state average.
Hispanic race population percentage significantly below state average.
Median age above state average.
Foreign-born population percentage significantly below state average.
Renting percentage below state average.
Length of stay since moving in significantly above state average.
Number of college students below state average.
Percentage of population with a bachelor's degree or higher below state average.
Estimated median house/condo value in 2022: $207,682
21530:
$207,682
Maryland:
$398,100
According to our research of Maryland and other state lists, there were 2 registered sex offenders living in 21530 zip code as of June 17, 2024. The ratio of all residents to sex offenders in zip code 21530 is 769 to 1. The ratio of registered sex offenders to all residents in this zip code is near the state average.
Median resident age:
This zip code:
47.6 years
Maryland median age:
39.7 years
Average household size:
This zip code:
2.2 people
Maryland:
2.5 people
Averages for the 2020 tax year for zip code 21530, filed in 2021:
Average Adjusted Gross Income (AGI) in 2020: $58,090 (Individual Income Tax Returns)
Here:
$58,090
State:
$86,905
Salary/wage: $55,362 (reported on 73.2% of returns)
Here:
$55,362
State:
$73,953
(% of AGI for various income ranges: 1129.3% for AGIs below $25k, 2807.9% for AGIs $25k-50k, 6685.0% for AGIs $50k-75k, 10754.0% for AGIs $75k-100k, 20918.3% for AGIs $100k-200k)
Taxable interest for individuals: $607 (reported on 39.4% of returns)
This zip code:
$607
Maryland:
$1,528
(% of AGI for various income ranges: 16.4% for AGIs below $25k, 62.1% for AGIs $25k-50k, 42.5% for AGIs $50k-75k, 24.0% for AGIs $75k-100k, 23.3% for AGIs $100k-200k)
Ordinary dividends: $2,173 (reported on 15.5% of returns)
Here:
$2,173
State:
$8,028
(% of AGI for various income ranges: 66.4% for AGIs $25k-50k, 47.5% for AGIs $50k-75k, 180.0% for AGIs $100k-200k)
Net capital gain/loss in AGI: +$4,110 (reported on 14.1% of returns)
Here:
+$4,110
State:
+$25,238
(% of AGI for various income ranges: 10.0% for AGIs below $25k, 50.0% for AGIs $50k-75k, 595.0% for AGIs $100k-200k)
Profit/loss from business: +$5,989 (reported on 12.7% of returns)
Here:
+$5,989
State:
+$11,398
(% of AGI for various income ranges: 64.3% for AGIs below $25k, 135.7% for AGIs $25k-50k, 518.0% for AGIs $75k-100k)
Taxable individual retirement arrangement distribution: $16,662 (reported on 11.3% of returns)
21530:
$16,662
Maryland:
$20,944
(% of AGI for various income ranges: 222.9% for AGIs below $25k, 337.5% for AGIs $50k-75k, 1502.0% for AGIs $75k-100k)
Total itemized deductions: $26,600 (reported on 5.6% of returns)
Here:
$26,600
State:
$30,672
(% of AGI for various income ranges: 2128.0% for AGIs $75k-100k)
Charity contributions: $5,767 (reported on 4.2% of returns)
Here:
$5,767
State:
$9,065
(% of AGI for various income ranges: 346.0% for AGIs $75k-100k)
Taxes paid: $8,600 (reported on 5.6% of returns)
21530:
$8,600
State:
$8,475
(% of AGI for various income ranges: 688.0% for AGIs $75k-100k)
Earned income credit: $2,243 (reported on 9.9% of returns)
Here:
$2,243
State:
$2,151
(% of AGI for various income ranges: 55.0% for AGIs below $25k, 57.1% for AGIs $25k-50k)
Percentage of individuals using paid preparers for their 2020 taxes: 93.0%
Here:
93%
State:
90%
(% for various income ranges: 95.2% for AGIs below $25k, 94.4% for AGIs $25k-50k, 92.3% for AGIs $50k-75k, 87.5% for AGIs $75k-100k, 90.9% for AGIs $100k-200k)
Averages for the 2012 tax year for zip code 21530, filed in 2013:
Average Adjusted Gross Income (AGI) in 2012: $44,563 (Individual Income Tax Returns)
Here:
$44,563
State:
$72,703
Salary/wage: $40,682 (reported on 78.5% of returns)
Here:
$40,682
State:
$62,228
(% of AGI for various income ranges: 66.6% for AGIs below $25k, 67.4% for AGIs $25k-50k, 66.9% for AGIs $50k-75k, 74.1% for AGIs $75k-100k, 80.7% for AGIs $100k-200k)
Taxable interest for individuals: $767 (reported on 46.2% of returns)
This zip code:
$767
Maryland:
$1,413
(% of AGI for various income ranges: 1.8% for AGIs below $25k, 0.5% for AGIs $25k-50k, 1.9% for AGIs $50k-75k, 0.4% for AGIs $75k-100k)
Ordinary dividends: $1,588 (reported on 12.3% of returns)
Here:
$1,588
State:
$6,933
(% of AGI for various income ranges: 0.7% for AGIs below $25k, 1.3% for AGIs $25k-50k, 0.2% for AGIs $75k-100k)
Net capital gain/loss in AGI: +$400 (reported on 9.2% of returns)
Here:
+$400
State:
+$14,830
Profit/loss from business: +$11,322 (reported on 13.8% of returns)
Here:
+$11,322
State:
+$12,606
(% of AGI for various income ranges: 4.0% for AGIs below $25k, 5.4% for AGIs $25k-50k, 2.8% for AGIs $50k-75k, 5.2% for AGIs $75k-100k)
Taxable individual retirement arrangement distribution: $9,633 (reported on 9.2% of returns)
21530:
$9,633
Maryland:
$17,065
Total itemized deductions: $18,468 (24% of AGI, reported on 29.2% of returns)
Here:
$18,468
State:
$27,886
Here:
23.9% of AGI
State:
22.8% of AGI
(% of AGI for various income ranges: 12.1% for AGIs $25k-50k, 10.2% for AGIs $50k-75k, 15.1% for AGIs $75k-100k, 17.0% for AGIs $100k-200k)
Charity contributions: $2,479 (reported on 21.5% of returns)
Here:
$2,479
State:
$4,452
(% of AGI for various income ranges: 1.3% for AGIs $25k-50k, 1.6% for AGIs $50k-75k, 1.7% for AGIs $75k-100k, 0.8% for AGIs $100k-200k)
Taxes paid: $7,105 (reported on 29.2% of returns)
21530:
$7,105
State:
$11,690
(% of AGI for various income ranges: 3.1% for AGIs $25k-50k, 3.6% for AGIs $50k-75k, 5.7% for AGIs $75k-100k, 8.7% for AGIs $100k-200k)
Earned income credit: $2,360 (reported on 15.4% of returns)
Here:
$2,360
State:
$2,199
(% of AGI for various income ranges: 5.4% for AGIs below $25k, 0.8% for AGIs $25k-50k)
Percentage of individuals using paid preparers for their 2012 taxes: 56.9%
Here:
57%
State:
52%
(% for various income ranges: 48.0% for AGIs below $25k, 57.9% for AGIs $25k-50k, 66.7% for AGIs $50k-75k, 62.5% for AGIs $75k-100k, 75.0% for AGIs $100k-200k)
Averages for the 2004 tax year for zip code 21530, filed in 2005:
Average Adjusted Gross Income (AGI) in 2004: $34,409 (Individual Income Tax Returns)
Here:
$34,409
State:
$60,339
Salary/wage: $32,316 (reported on 79.3% of returns)
Here:
$32,316
State:
$52,211
(% of AGI for various income ranges: 68.2% for AGIs below $10k, 64.0% for AGIs $10k-25k, 77.0% for AGIs $25k-50k, 78.8% for AGIs $50k-75k, 80.0% for AGIs $75k-100k, 66.4% for AGIs over 100k)
Taxable interest for individuals: $879 (reported on 52.1% of returns)
This zip code:
$879
Maryland:
$1,701
(% of AGI for various income ranges: 4.7% for AGIs below $10k, 2.2% for AGIs $10k-25k, 1.0% for AGIs $25k-50k, 1.9% for AGIs $50k-75k, 0.2% for AGIs $75k-100k, 0.5% for AGIs over 100k)
Taxable dividends: $1,342 (reported on 16.3% of returns)
Here:
$1,342
State:
$4,235
(% of AGI for various income ranges: 3.3% for AGIs below $10k, 1.1% for AGIs $10k-25k, 0.3% for AGIs $25k-50k, 0.3% for AGIs $50k-75k, 1.5% for AGIs $75k-100k)
Net capital gain/loss: +$1,705 (reported on 11.4% of returns)
Here:
+$1,705
State:
+$15,888
(% of AGI for various income ranges: -2.4% for AGIs below $10k, 0.4% for AGIs $10k-25k, 0.7% for AGIs $25k-50k, 0.1% for AGIs $50k-75k, 2.2% for AGIs $75k-100k)
Profit/loss from business: +$6,282 (reported on 16.1% of returns)
Here:
+$6,282
State:
+$12,221
(% of AGI for various income ranges: 6.0% for AGIs below $10k, 6.9% for AGIs $10k-25k, 3.2% for AGIs $25k-50k, 3.4% for AGIs $50k-75k)
IRA payment deduction: $2,500 (reported on 2.1% of returns)
21530:
$2,500
Maryland:
$2,968
Total itemized deductions: $14,658 (22% of AGI, reported on 22.7% of returns)
Here:
$14,658
State:
$22,960
Here:
22.1% of AGI
State:
23.3% of AGI
(% of AGI for various income ranges: 5.5% for AGIs $10k-25k, 7.3% for AGIs $25k-50k, 10.6% for AGIs $50k-75k, 13.1% for AGIs $75k-100k, 16.4% for AGIs over 100k)
Charity contributions deductions: $1,855 (3% of AGI, reported on 18.2% of returns)
Here:
$1,855
State:
$4,031
Here:
2.7% of AGI
State:
3.9% of AGI
(% of AGI for various income ranges: 0.5% for AGIs $10k-25k, 0.9% for AGIs $25k-50k, 0.8% for AGIs $50k-75k, 1.6% for AGIs $75k-100k, 1.6% for AGIs over 100k)
Total tax: $3,836 (reported on 75.8% of returns)
21530:
$3,836
State:
$10,167
(% of AGI for various income ranges: 2.2% for AGIs below $10k, 4.2% for AGIs $10k-25k, 6.6% for AGIs $25k-50k, 8.4% for AGIs $50k-75k, 10.2% for AGIs $75k-100k, 17.1% for AGIs over 100k)
Earned income credit: $1,495 (reported on 14.2% of returns)
Here:
$1,495
State:
$1,700
Percentage of individuals using paid preparers for their 2004 taxes: 60.3%
Here:
60%
State:
55%
(% for various income ranges: 56.2% for AGIs below $10k, 57.8% for AGIs $10k-25k, 59.4% for AGIs $25k-50k, 70.8% for AGIs $50k-75k, 61.0% for AGIs $75k-100k, 68.4% for AGIs over 100k)
Household received Food Stamps/SNAP in the past 12 months: 140 Household did not receive Food Stamps/SNAP in the past 12 months: 661
Women who had a birth in the past 12 months: 24 (13 now married, 10 unmarried) Women who did not have a birth in the past 12 months: 274 (114 now married, 160 unmarried)
Housing units in zip code 21530 with a mortgage: 205 (2 second mortgage, 2 both second mortgage and home equity loan) Median monthly owner costs for units with a mortgage: $1,198 Median monthly owner costs for units without a mortgage: $408
Residents with income below the poverty level in 2022:
This zip code:
13.6%
Whole state:
9.6%
Residents with income below 50% of the poverty level in 2022:
This zip code:
2.3%
Whole state:
4.7%
Median number of rooms in houses and condos:
Here:
6.4
State:
7.3
Median number of rooms in apartments:
Here:
5.5
State:
4.2
Notable locations in this zip code not listed on our city pages
Churches in zip code 21530 include: Glendale Church (A), Flintstone United Methodist Church (B), Rush Baptist Church (C). Display/hide their locations on the map
Cemeteries: Robinette Cemetery (1), Lashley Cemetery (2), Browning Cemetery (3), Robinette Family Cemetery (4), Rush Cemetery (5), Fairview Cemetery (6), Green Meadow Cemetery (7). Display/hide their locations on the map
Streams, rivers, and creeks: Big Divide Run (A), Black Sulphur Run (B), Murley Branch (C), Piclic Run (D), White Sulphur Run (E), Flintstone Creek (F). Display/hide their locations on the map
In group quarters: 12 (-1 institutionalized population)
Size of family households: 293 2-persons, 111 3-persons, 76 4-persons, 14 5-persons, 24 6-persons, 13 7-or-more-persons
Size of nonfamily households: 264 1-person
263 married couples with children.
92 single-parent households (17 men, 75 women).
94.7% of residents of 21530 zip code speak English at home.
2.6% of residents speak Spanish at home (50% very well, 50% well).
1.4% of residents speak other Indo-European language at home (100% very well).
Foreign born population: 31 (1.7%) (100.0% of them are naturalized citizens)
This zip code:
1.7%
Whole state:
16.7%
77%Honduras
32%German
22%American
18%Swiss
6%English
2%Scottish
2%Norwegian
2%European
Year of entry for the foreign-born population
02010 or later
02000 to 2009
211990 to 1999
6Before 1990
Facilities with environmental interests located in this zip code:
ALLEGANY AGGREGATES - QUARRY (21235 NATIONAL PIKE, NORTHEAST in FLINTSTONE, MD)
AIR MINOR (AIRS/AFS) STATE MASTER (Maryland Permits tracking) - National Pollutant Discharge Elimination System Permit, OIL CONTROL STATE MASTER (Maryland Air Emissions Database) - AIR MAJOR CRITERIA AND HAZARDOUS AIR POLLUTANT INVENTORY (Inventory of air pollution sources) National Pollutant Discharge Elimination System NON-MAJOR (Tracking pollutant discharge elimination systems) - permit Business SIC classification: CRUSHED AND BROKEN LIMESTONE; CRUSHED AND BROKEN STONE; CONSTRUCTION SAND AND GRAVEL; ASPHALT PAVING MIXTURES AND BLOCKS Business NAICS classification: ASPHALT PAVING MIXTURE AND BLOCK MANUFACTURING. Alternative names: ALLEGANY AGGREGATES - FLINTSTONE, ALLEGHANY AGGREGATES,INC., BEDROCK QUARRY
QUARRY RIDGE ASPHALT (OLD ROUTE 40 in FLINTSTONE, MD)
Conditionally Exempt Small Quantity Generators, less than 100 kg/month of hazardous waste (Resource Conservation and Recovery Act (tracking hazardous waste)) - notification Organizations: QUARRY RIDGE CORPORATION (CONTACT/OWNER)
Housing units lacking complete plumbing facilities: 4.0% Housing units lacking complete kitchen facilities: 7.2%
29.9%Wood
29.3%Electricity
26.1%Fuel oil, kerosene, etc.
9.6%Bottled, tank, or LP gas
3.6%Other fuel
1.5%Utility gas
Population in 1990: 1,102. Population change in the 1990s: +419 (+38.0%).
Place of birth for U.S.-born residents:
This state: 1,233
Northeast: 230
Midwest: 26
South: 231
West: 14
69% of the 21530 zip code residents lived in the same house 5 years ago. Out of people who lived in different houses, 54% lived in this county. Out of people who lived in different counties, 50% lived in Maryland.
97% of the 21530 zip code residents lived in the same house 1 year ago. Out of people who lived in different houses, 32% moved from this county. Out of people who lived in different houses, 35% moved from different county within same state. Out of people who lived in different houses, 51% moved from different state.
Private vs. public school enrollment:
Students in private schools in grades 1 to 8 (elementary and middle school): 73
Here:
45.9%
Maryland:
15.2%
Students in private schools in grades 9 to 12 (high school): 24
Here:
17.8%
Maryland:
14.4%
Students in private undergraduate colleges:
Here:
0.0%
Maryland:
20.2%
Occupation by median earnings in the past 12 months ($)
63,594Law enforcement workers including supervisors
47,976Installation, maintenance, and repair occupations
32,500Sales and related occupations
24,587Office and administrative support occupations
20,171Transportation occupations
10,379Construction and extraction occupations
Companies with federal contracts located in this zip code:
CUSTOM ANLYTICAL ENGRG SYSTEMS (13000 TENSOR LN NE in FLINTSTONE, MD; small business) : $12,688,303 in 50 contractsfrom 2000 to 2006
Contracts for Services -- Engineering Development (R&D), Other Defense -- Advanced Development (R&D), Ammunition -- Applied Research and Exploratory Development (R&D), Ammunition -- Advanced Development (R&D), and moreby Navy Signed by year:2000: $682,125; 2001: $917,542; 2002: $1,639,494; 2003: $2,003,272; 2004: $2,168,311; 2005: $3,813,621; 2006: $1,463,938.
Biggest contracts:
$1,650,000 with Navy for Services -- Engineering Development (R&D). Signed on 2005-01-31. Completion date: 2005-07-31.
$1,463,938, same as above.Signed on 2006-03-15. Completion date: 2006-06-30.
$1,100,000, same as above.Signed on 2004-06-18. Completion date: 2005-12-31.
$1,083,590, same as above.Signed on 2005-09-22. Completion date: 2005-12-31.
CRESTLINE HOTELS & RESORTS INT (16701 LAKEVIEW ROAD N E in FLINTSTONE, MD) : $706,247 in 29 contractsfrom 2001 to 2006
Contracts for Lease or Rental of Facilities -- Conference Space and Facilities, Lodging - Hotel/Motel, ADP Central Processing Unit (CPU, Computer), Digital, Defense Missile and Space Systems -- Advanced Development (R&D), and moreby National Institute of Standards and Technology, National Institutes of Health, Alcohol and Tobacco Tax and Trade Bureau, Army, and others Signed by year:2000: $0; 2001: $72,000; 2002: $69,876; 2003: $0; 2004: $225,258; 2005: $240,259; 2006: $98,854.
Biggest contracts:
$78,542 with National Institute of Standards and Technology for Lease or Rental of Facilities -- Conference Space and Facilities. Signed on 2006-05-02. Completion date: 2006-06-08.
$75,332 with National Institutes of Health for Lodging - Hotel/Motel. Signed on 2004-07-30. Completion date: 2004-11-30.
$75,332, same as above.Signed on 2004-07-30. Completion date: 2004-11-30.
$72,000 with Alcohol and Tobacco Tax and Trade Bureau for ADP Central Processing Unit (CPU, Computer), Digital. Taking place in DC. Signed on 2001-12-15. Completion date: 2001-12-15.
Top industries in this zip code by the number of employees in 2005:
Accommodation and Food Services: Hotels (except Casino Hotels) and Motels (100-249 employees: 1 establishment)
Professional, Scientific, and Technical Services: Research and Development in the Physical, Engineering, and Life Sciences (20-49: 1)
Accommodation and Food Services: Full-Service Restaurants (10-19: 1)
Construction: New Single-Family Housing Construction (except Operative Builders) (5-9: 1, 1-4: 1)
Arts, Entertainment, and Recreation: Promoters of Performing Arts, Sports, and Similar Events without Facilities (5-9: 1)
Administrative and Support and Waste Management and Remediation Services: Landscaping Services (5-9: 1)
Construction: Painting and Wall Covering Contractors (5-9: 1)
People in group quarters in 2010:
39 people in correctional facilities intended for juveniles
People in group quarters in 2000:
81 people in training schools for juvenile delinquents
Fatal accident statistics in 2012:
Fatal accident count: 1
Vehicles involved in fatal accidents: 2
Fatal accidents caused by drunken drivers: 1
Fatalities: 1
Persons involved in fatal accidents: 4
Pedestrians involved in fatal accidents: 0
Fatal accident statistics in 2010:
Fatal accident count: 5
Vehicles involved in fatal accidents: 8
Fatal accidents caused by drunken drivers: 1
Fatalities: 7
Persons involved in fatal accidents: 14
Pedestrians involved in fatal accidents: 1
Home Mortgage Disclosure Act Aggregated Statistics For Year 2009 (Based on 2 partial tracts)
A) FHA, FSA/RHS & VA Home Purchase Loans
B) Conventional Home Purchase Loans
C) Refinancings
D) Home Improvement Loans
F) Non-occupant Loans on < 5 Family Dwellings (A B C & D)
G) Loans On Manufactured Home Dwelling (A B C & D)
Number
Average Value
Number
Average Value
Number
Average Value
Number
Average Value
Number
Average Value
Number
Average Value
LOANS ORIGINATED
4
$131,288
7
$184,663
43
$150,520
9
$41,244
3
$185,697
3
$137,227
APPLICATIONS APPROVED, NOT ACCEPTED
1
$89,520
0
$0
5
$160,112
0
$0
1
$224,660
0
$0
APPLICATIONS DENIED
0
$0
1
$120,310
18
$140,491
2
$25,090
1
$82,680
1
$115,750
APPLICATIONS WITHDRAWN
1
$82,110
1
$78,690
13
$135,401
1
$57,020
2
$117,745
1
$127,150
FILES CLOSED FOR INCOMPLETENESS
0
$0
0
$0
1
$169,920
1
$61,010
0
$0
1
$59,870
Aggregated Statistics For Year 2008 (Based on 2 partial tracts)
A) FHA, FSA/RHS & VA Home Purchase Loans
B) Conventional Home Purchase Loans
C) Refinancings
D) Home Improvement Loans
F) Non-occupant Loans on < 5 Family Dwellings (A B C & D)
G) Loans On Manufactured Home Dwelling (A B C & D)
Number
Average Value
Number
Average Value
Number
Average Value
Number
Average Value
Number
Average Value
Number
Average Value
LOANS ORIGINATED
2
$108,340
11
$186,922
35
$135,040
10
$56,678
2
$105,485
6
$125,633
APPLICATIONS APPROVED, NOT ACCEPTED
0
$0
1
$48,470
7
$151,836
0
$0
1
$48,470
0
$0
APPLICATIONS DENIED
1
$98,640
3
$169,540
26
$178,714
8
$66,500
3
$43,717
3
$116,700
APPLICATIONS WITHDRAWN
1
$110,620
2
$272,270
10
$190,162
2
$282,250
0
$0
0
$0
FILES CLOSED FOR INCOMPLETENESS
1
$86,670
1
$188,170
4
$197,148
0
$0
1
$286,240
1
$91,230
Aggregated Statistics For Year 2007 (Based on 2 partial tracts)
A) FHA, FSA/RHS & VA Home Purchase Loans
B) Conventional Home Purchase Loans
C) Refinancings
D) Home Improvement Loans
F) Non-occupant Loans on < 5 Family Dwellings (A B C & D)
G) Loans On Manufactured Home Dwelling (A B C & D)
Number
Average Value
Number
Average Value
Number
Average Value
Number
Average Value
Number
Average Value
Number
Average Value
LOANS ORIGINATED
1
$90,660
13
$148,252
43
$118,509
14
$56,409
2
$139,130
6
$85,435
APPLICATIONS APPROVED, NOT ACCEPTED
0
$0
3
$221,617
10
$129,606
2
$47,895
1
$148,820
1
$70,130
APPLICATIONS DENIED
1
$38,770
3
$107,767
50
$137,703
9
$70,324
1
$99,790
8
$100,711
APPLICATIONS WITHDRAWN
1
$89,520
1
$132,860
18
$127,947
2
$100,070
0
$0
2
$55,025
FILES CLOSED FOR INCOMPLETENESS
0
$0
0
$0
7
$166,091
0
$0
0
$0
0
$0
Aggregated Statistics For Year 2006 (Based on 2 partial tracts)
A) FHA, FSA/RHS & VA Home Purchase Loans
B) Conventional Home Purchase Loans
C) Refinancings
D) Home Improvement Loans
F) Non-occupant Loans on < 5 Family Dwellings (A B C & D)
G) Loans On Manufactured Home Dwelling (A B C & D)
Number
Average Value
Number
Average Value
Number
Average Value
Number
Average Value
Number
Average Value
Number
Average Value
LOANS ORIGINATED
1
$123,160
24
$134,543
44
$103,478
14
$54,169
6
$126,300
7
$80,806
APPLICATIONS APPROVED, NOT ACCEPTED
1
$75,270
5
$64,660
4
$81,110
2
$98,930
2
$58,730
1
$33,070
APPLICATIONS DENIED
0
$0
7
$83,249
40
$136,420
7
$35,679
2
$74,410
2
$76,975
APPLICATIONS WITHDRAWN
1
$76,980
5
$93,170
26
$121,431
3
$56,070
1
$59,300
1
$76,980
FILES CLOSED FOR INCOMPLETENESS
1
$96,360
1
$115,750
6
$120,217
1
$22,810
1
$31,360
0
$0
Aggregated Statistics For Year 2005 (Based on 2 partial tracts)
A) FHA, FSA/RHS & VA Home Purchase Loans
B) Conventional Home Purchase Loans
C) Refinancings
D) Home Improvement Loans
F) Non-occupant Loans on < 5 Family Dwellings (A B C & D)
G) Loans On Manufactured Home Dwelling (A B C & D)
Number
Average Value
Number
Average Value
Number
Average Value
Number
Average Value
Number
Average Value
Number
Average Value
LOANS ORIGINATED
1
$73,560
12
$114,990
42
$114,895
13
$39,914
3
$89,900
3
$87,050
APPLICATIONS APPROVED, NOT ACCEPTED
0
$0
3
$255,450
11
$78,739
1
$9,690
1
$35,920
1
$18,250
APPLICATIONS DENIED
0
$0
5
$37,406
46
$119,457
7
$33,967
1
$80,400
3
$39,913
APPLICATIONS WITHDRAWN
0
$0
6
$90,377
43
$113,815
4
$133,428
2
$126,585
2
$59,870
FILES CLOSED FOR INCOMPLETENESS
0
$0
0
$0
4
$167,782
1
$5,700
0
$0
0
$0
Aggregated Statistics For Year 2004 (Based on 2 partial tracts)
A) FHA, FSA/RHS & VA Home Purchase Loans
B) Conventional Home Purchase Loans
C) Refinancings
D) Home Improvement Loans
F) Non-occupant Loans on < 5 Family Dwellings (A B C & D)
G) Loans On Manufactured Home Dwelling (A B C & D)
Number
Average Value
Number
Average Value
Number
Average Value
Number
Average Value
Number
Average Value
Number
Average Value
LOANS ORIGINATED
0
$0
19
$102,186
49
$90,196
9
$30,981
5
$68,880
3
$86,860
APPLICATIONS APPROVED, NOT ACCEPTED
0
$0
2
$63,005
9
$100,989
1
$17,680
1
$100,360
1
$60,440
APPLICATIONS DENIED
1
$19,960
5
$54,968
40
$103,947
10
$32,844
5
$53,370
3
$33,453
APPLICATIONS WITHDRAWN
1
$102,070
1
$141,980
32
$103,046
2
$49,035
2
$61,580
1
$22,810
FILES CLOSED FOR INCOMPLETENESS
0
$0
0
$0
3
$108,527
1
$17,110
0
$0
0
$0
Aggregated Statistics For Year 2003 (Based on 2 partial tracts)
A) FHA, FSA/RHS & VA Home Purchase Loans
B) Conventional Home Purchase Loans
C) Refinancings
D) Home Improvement Loans
F) Non-occupant Loans on < 5 Family Dwellings (A B C & D)
Number
Average Value
Number
Average Value
Number
Average Value
Number
Average Value
Number
Average Value
LOANS ORIGINATED
2
$74,410
21
$103,586
62
$92,428
6
$14,540
7
$67,610
APPLICATIONS APPROVED, NOT ACCEPTED
0
$0
2
$47,040
21
$98,047
1
$17,110
2
$67,855
APPLICATIONS DENIED
0
$0
5
$48,468
52
$89,993
2
$32,215
1
$44,480
APPLICATIONS WITHDRAWN
0
$0
1
$136,850
35
$109,755
0
$0
1
$57,020
FILES CLOSED FOR INCOMPLETENESS
0
$0
1
$30,790
10
$104,119
0
$0
0
$0
Aggregated Statistics For Year 2002 (Based on 2 partial tracts)
A) FHA, FSA/RHS & VA Home Purchase Loans
B) Conventional Home Purchase Loans
C) Refinancings
D) Home Improvement Loans
F) Non-occupant Loans on < 5 Family Dwellings (A B C & D)
Number
Average Value
Number
Average Value
Number
Average Value
Number
Average Value
Number
Average Value
LOANS ORIGINATED
1
$108,910
15
$103,777
39
$90,092
9
$16,599
3
$105,677
APPLICATIONS APPROVED, NOT ACCEPTED
0
$0
1
$66,710
7
$117,706
2
$7,985
1
$105,490
APPLICATIONS DENIED
0
$0
9
$42,004
35
$84,699
6
$21,478
2
$82,680
APPLICATIONS WITHDRAWN
0
$0
1
$37,630
25
$93,558
1
$2,280
1
$23,380
FILES CLOSED FOR INCOMPLETENESS
0
$0
0
$0
2
$88,380
0
$0
0
$0
Aggregated Statistics For Year 2001 (Based on 2 partial tracts)
A) FHA, FSA/RHS & VA Home Purchase Loans
B) Conventional Home Purchase Loans
C) Refinancings
D) Home Improvement Loans
F) Non-occupant Loans on < 5 Family Dwellings (A B C & D)
Number
Average Value
Number
Average Value
Number
Average Value
Number
Average Value
Number
Average Value
LOANS ORIGINATED
2
$66,430
11
$86,982
42
$76,868
6
$19,387
3
$84,580
APPLICATIONS APPROVED, NOT ACCEPTED
0
$0
1
$53,030
9
$72,859
1
$6,270
1
$86,100
APPLICATIONS DENIED
1
$51,890
3
$31,930
26
$65,463
5
$20,300
0
$0
APPLICATIONS WITHDRAWN
0
$0
1
$74,130
23
$107,073
2
$23,950
0
$0
FILES CLOSED FOR INCOMPLETENESS
0
$0
1
$64,430
3
$80,397
0
$0
0
$0
Aggregated Statistics For Year 2000 (Based on 2 partial tracts)
A) FHA, FSA/RHS & VA Home Purchase Loans
B) Conventional Home Purchase Loans
C) Refinancings
D) Home Improvement Loans
F) Non-occupant Loans on < 5 Family Dwellings (A B C & D)
Number
Average Value
Number
Average Value
Number
Average Value
Number
Average Value
Number
Average Value
LOANS ORIGINATED
3
$72,227
22
$82,783
47
$69,261
10
$15,110
3
$68,803
APPLICATIONS APPROVED, NOT ACCEPTED
1
$132,860
5
$62,152
10
$80,797
2
$28,225
0
$0
APPLICATIONS DENIED
2
$123,165
24
$55,381
42
$78,688
7
$19,794
9
$37,823
APPLICATIONS WITHDRAWN
0
$0
3
$67,473
11
$66,817
1
$11,970
0
$0
FILES CLOSED FOR INCOMPLETENESS
0
$0
1
$131,150
6
$55,500
0
$0
1
$42,770
Aggregated Statistics For Year 1999 (Based on 1 partial tract)
A) FHA, FSA/RHS & VA Home Purchase Loans
B) Conventional Home Purchase Loans
C) Refinancings
D) Home Improvement Loans
F) Non-occupant Loans on < 5 Family Dwellings (A B C & D)
Detailed PMIC statistics for the following Tracts:0001.00
2002 - 2018 National Fire Incident Reporting System (NFIRS) incidents
According to the data from the years 2002 - 2018 the average number of fire incidents per year is 24. The highest number of fires - 48 took place in 2018, and the least - 1 in 2006. The data has a rising trend.
When looking into fire subcategories, the most reports belonged to: Structure Fires (38.6%), and Mobile Property/Vehicle Fires (32.3%).
Fire incident types reported to NFIRS in Zip Code 21530

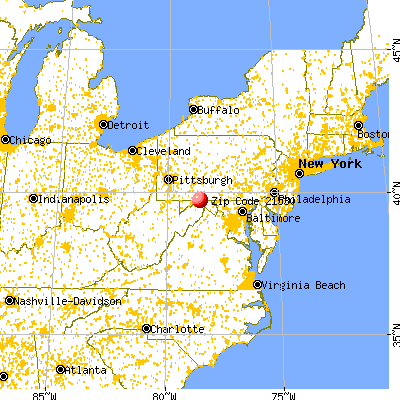


 Nearest zip codes: 21555, 21766, 17211, 15535, 25431, 26722.


 According to the data from the years 2002 - 2018 the average number of fire incidents per year is 24. The highest number of fires - 48 took place in 2018, and the least - 1 in 2006. The data has a rising trend.
 When looking into fire subcategories, the most reports belonged to: Structure Fires (38.6%), and Mobile Property/Vehicle Fires (32.3%).