Estimated zip code population in 2022: 1,836 Zip code population in 2010: 2,098 Zip code population in 2000: 1,695
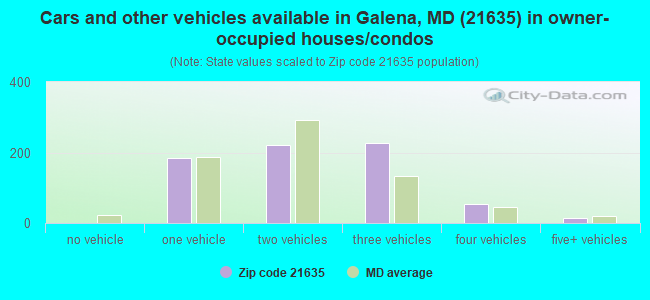
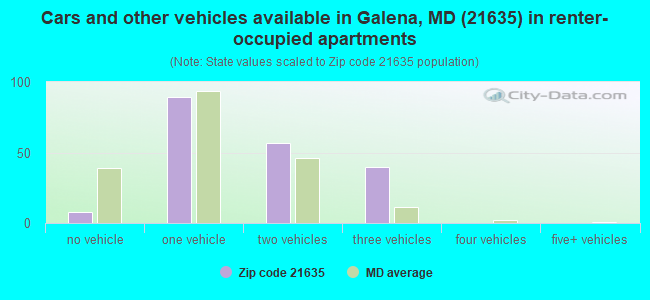
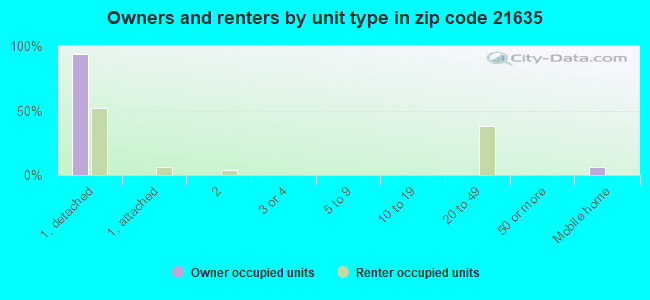
Houses and condos: 1,021 Renter-occupied apartments: 192
% of renters here:
22%
State:
32%
March 2022 cost of living index in zip code 21635: 89.2 (less than average, U.S. average is 100)
Land area: 30.8 sq. mi. Water area: 1.6 sq. mi.
Population density: 60 people per square mile
(very low).
OSM Map
General Map
Google Map
MSN Map
OSM Map
General Map
Google Map
MSN Map
OSM Map
General Map
Google Map
MSN Map
OSM Map
General Map
Google Map
MSN Map
Please wait while loading the map...
Real estate property taxes paid for housing units in 2022:
This zip code:
0.8% ($2,868)
Maryland:
0.9% ($3,777)
Median real estate property taxes paid for housing units with mortgages in 2022: $2,990 (0.9%) Median real estate property taxes paid for housing units with no mortgage in 2022: $2,729 (0.8%)
Business Search- 14 Million verified businesses
Males: 945
(51.5%)
Females: 891
(48.5%)
For population 25 years and over in 21635:
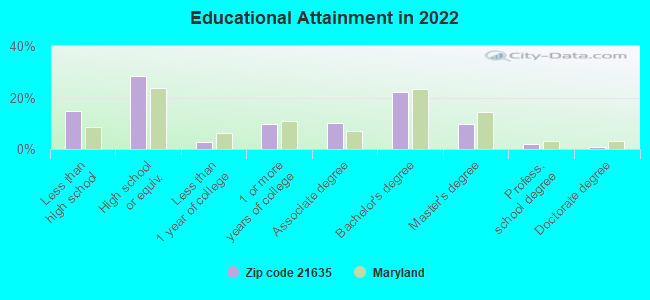
High school or higher: 84.2%
Bachelor's degree or higher: 34.3%
Graduate or professional degree: 12.4%
Unemployed: 0.7%
Mean travel time to work (commute): 29.1 minutes
For population 15 years and over in 21635:
Never married: 26.5%
Now married: 57.7%
Separated: 2.2%
Widowed: 6.1%
Divorced: 7.6%
Zip code 21635 compared to state average:
Unemployed percentage significantly below state average.
Black race population percentage significantly below state average.
Median age significantly above state average.
Foreign-born population percentage significantly below state average.
Averages for the 2020 tax year for zip code 21635, filed in 2021:
Average Adjusted Gross Income (AGI) in 2020: $90,502 (Individual Income Tax Returns)
Here:
$90,502
State:
$86,905
Salary/wage: $75,918 (reported on 77.5% of returns)
Here:
$75,918
State:
$73,953
(% of AGI for various income ranges: 1104.4% for AGIs below $25k, 3708.7% for AGIs $25k-50k, 6893.6% for AGIs $50k-75k, 7711.4% for AGIs $75k-100k, 16260.0% for AGIs $100k-200k)
Taxable interest for individuals: $1,453 (reported on 44.1% of returns)
This zip code:
$1,453
Maryland:
$1,528
(% of AGI for various income ranges: 26.9% for AGIs below $25k, 11.3% for AGIs $25k-50k, 85.5% for AGIs $50k-75k, 18.6% for AGIs $75k-100k, 181.5% for AGIs $100k-200k)
Ordinary dividends: $7,882 (reported on 27.5% of returns)
Here:
$7,882
State:
$8,028
(% of AGI for various income ranges: 66.2% for AGIs below $25k, 54.7% for AGIs $25k-50k, 140.0% for AGIs $50k-75k, 278.6% for AGIs $75k-100k, 345.4% for AGIs $100k-200k)
Net capital gain/loss in AGI: +$19,448 (reported on 24.5% of returns)
Here:
+$19,448
State:
+$25,238
(% of AGI for various income ranges: 17.5% for AGIs below $25k, 49.3% for AGIs $25k-50k, 145.5% for AGIs $50k-75k, 134.3% for AGIs $75k-100k, 784.6% for AGIs $100k-200k)
Profit/loss from business: +$13,725 (reported on 15.7% of returns)
Here:
+$13,725
State:
+$11,398
(% of AGI for various income ranges: 198.1% for AGIs below $25k, 111.3% for AGIs $25k-50k, 190.9% for AGIs $50k-75k, 1155.4% for AGIs $100k-200k)
Taxable individual retirement arrangement distribution: $17,514 (reported on 13.7% of returns)
21635:
$17,514
Maryland:
$20,944
(% of AGI for various income ranges: 110.6% for AGIs below $25k, 159.3% for AGIs $25k-50k, 693.6% for AGIs $50k-75k, 979.2% for AGIs $100k-200k)
Total itemized deductions: $28,629 (reported on 16.7% of returns)
Here:
$28,629
State:
$30,672
(% of AGI for various income ranges: 340.0% for AGIs below $25k, 499.1% for AGIs $50k-75k, 952.9% for AGIs $75k-100k, 1237.7% for AGIs $100k-200k)
Charity contributions: $9,562 (reported on 12.7% of returns)
Here:
$9,562
State:
$9,065
(% of AGI for various income ranges: 46.0% for AGIs $25k-50k, 107.1% for AGIs $75k-100k, 273.8% for AGIs $100k-200k)
Taxes paid: $7,894 (reported on 16.7% of returns)
21635:
$7,894
State:
$8,475
(% of AGI for various income ranges: 58.1% for AGIs below $25k, 143.6% for AGIs $50k-75k, 302.9% for AGIs $75k-100k, 436.9% for AGIs $100k-200k)
Earned income credit: $1,612 (reported on 7.8% of returns)
Here:
$1,612
State:
$2,151
(% of AGI for various income ranges: 51.2% for AGIs below $25k, 31.3% for AGIs $25k-50k)
Percentage of individuals using paid preparers for their 2020 taxes: 92.2%
Here:
92%
State:
90%
(% for various income ranges: 88.5% for AGIs below $25k, 95.0% for AGIs $25k-50k, 94.1% for AGIs $50k-75k, 90.0% for AGIs $75k-100k, 90.9% for AGIs $100k-200k, 100.0% for AGIs over 200k)
Averages for the 2012 tax year for zip code 21635, filed in 2013:
Average Adjusted Gross Income (AGI) in 2012: $63,518 (Individual Income Tax Returns)
Here:
$63,518
State:
$72,703
Salary/wage: $53,597 (reported on 82.3% of returns)
Here:
$53,597
State:
$62,228
(% of AGI for various income ranges: 67.6% for AGIs below $25k, 73.8% for AGIs $25k-50k, 70.9% for AGIs $50k-75k, 67.9% for AGIs $75k-100k, 73.5% for AGIs $100k-200k, 58.2% for AGIs over 200k)
Taxable interest for individuals: $1,426 (reported on 47.9% of returns)
This zip code:
$1,426
Maryland:
$1,413
(% of AGI for various income ranges: 2.2% for AGIs below $25k, 1.7% for AGIs $25k-50k, 1.9% for AGIs $50k-75k, 1.3% for AGIs $75k-100k, 0.5% for AGIs $100k-200k, 0.4% for AGIs over 200k)
Ordinary dividends: $4,479 (reported on 29.2% of returns)
Here:
$4,479
State:
$6,933
(% of AGI for various income ranges: 1.4% for AGIs below $25k, 1.6% for AGIs $25k-50k, 3.1% for AGIs $50k-75k, 2.2% for AGIs $75k-100k, 2.7% for AGIs $100k-200k)
Net capital gain/loss in AGI: +$3,012 (reported on 16.7% of returns)
Here:
+$3,012
State:
+$14,830
(% of AGI for various income ranges: 0.6% for AGIs $75k-100k, 2.3% for AGIs $100k-200k)
Profit/loss from business: +$8,793 (reported on 15.6% of returns)
Here:
+$8,793
State:
+$12,606
(% of AGI for various income ranges: 4.8% for AGIs below $25k, 3.7% for AGIs $50k-75k, 2.0% for AGIs $75k-100k, 2.8% for AGIs $100k-200k)
Taxable individual retirement arrangement distribution: $17,921 (reported on 14.6% of returns)
21635:
$17,921
Maryland:
$17,065
(% of AGI for various income ranges: 5.1% for AGIs below $25k, 7.0% for AGIs $25k-50k, 3.9% for AGIs $75k-100k, 6.7% for AGIs $100k-200k)
Total itemized deductions: $23,349 (23% of AGI, reported on 44.8% of returns)
Here:
$23,349
State:
$27,886
Here:
22.5% of AGI
State:
22.8% of AGI
(% of AGI for various income ranges: 12.1% for AGIs below $25k, 11.6% for AGIs $25k-50k, 17.9% for AGIs $50k-75k, 17.2% for AGIs $75k-100k, 17.3% for AGIs $100k-200k, 17.6% for AGIs over 200k)
Charity contributions: $2,894 (reported on 36.5% of returns)
Here:
$2,894
State:
$4,452
(% of AGI for various income ranges: 0.9% for AGIs below $25k, 1.2% for AGIs $25k-50k, 1.9% for AGIs $50k-75k, 1.5% for AGIs $75k-100k, 1.7% for AGIs $100k-200k, 2.1% for AGIs over 200k)
Taxes paid: $9,749 (reported on 44.8% of returns)
21635:
$9,749
State:
$11,690
(% of AGI for various income ranges: 2.4% for AGIs below $25k, 3.8% for AGIs $25k-50k, 5.6% for AGIs $50k-75k, 6.9% for AGIs $75k-100k, 8.6% for AGIs $100k-200k, 8.2% for AGIs over 200k)
Earned income credit: $2,175 (reported on 8.3% of returns)
Here:
$2,175
State:
$2,199
(% of AGI for various income ranges: 3.6% for AGIs below $25k, 0.5% for AGIs $25k-50k)
Percentage of individuals using paid preparers for their 2012 taxes: 58.3%
Here:
58%
State:
52%
(% for various income ranges: 50.0% for AGIs below $25k, 55.6% for AGIs $25k-50k, 66.7% for AGIs $50k-75k, 53.8% for AGIs $75k-100k, 73.3% for AGIs $100k-200k, 66.7% for AGIs over 200k)
Averages for the 2004 tax year for zip code 21635, filed in 2005:
Average Adjusted Gross Income (AGI) in 2004: $54,236 (Individual Income Tax Returns)
Here:
$54,236
State:
$60,339
Salary/wage: $46,885 (reported on 81.0% of returns)
Here:
$46,885
State:
$52,211
(% of AGI for various income ranges: 127.0% for AGIs below $10k, 65.8% for AGIs $10k-25k, 68.4% for AGIs $25k-50k, 79.7% for AGIs $50k-75k, 85.5% for AGIs $75k-100k, 57.9% for AGIs over 100k)
Taxable interest for individuals: $1,164 (reported on 60.5% of returns)
This zip code:
$1,164
Maryland:
$1,701
(% of AGI for various income ranges: 7.7% for AGIs below $10k, 3.3% for AGIs $10k-25k, 1.9% for AGIs $25k-50k, 1.5% for AGIs $50k-75k, 0.2% for AGIs $75k-100k, 1.0% for AGIs over 100k)
Taxable dividends: $1,920 (reported on 32.5% of returns)
Here:
$1,920
State:
$4,235
(% of AGI for various income ranges: 9.0% for AGIs below $10k, 1.6% for AGIs $10k-25k, 1.6% for AGIs $25k-50k, 0.8% for AGIs $50k-75k, 0.2% for AGIs $75k-100k, 1.4% for AGIs over 100k)
Net capital gain/loss: +$10,803 (reported on 23.0% of returns)
Here:
+$10,803
State:
+$15,888
(% of AGI for various income ranges: 2.8% for AGIs below $10k, -1.0% for AGIs $10k-25k, -0.2% for AGIs $25k-50k, 0.3% for AGIs $50k-75k, -0.3% for AGIs $75k-100k, 11.5% for AGIs over 100k)
Profit/loss from business: +$11,196 (reported on 17.9% of returns)
Here:
+$11,196
State:
+$12,221
(% of AGI for various income ranges: -0.6% for AGIs below $10k, 4.1% for AGIs $10k-25k, 3.9% for AGIs $25k-50k, 4.7% for AGIs $50k-75k, 0.9% for AGIs $75k-100k, 4.4% for AGIs over 100k)
IRA payment deduction: $3,290 (reported on 3.5% of returns)
21635:
$3,290
Maryland:
$2,968
Total itemized deductions: $19,066 (22% of AGI, reported on 48.3% of returns)
Here:
$19,066
State:
$22,960
Here:
22.0% of AGI
State:
23.3% of AGI
(% of AGI for various income ranges: 23.2% for AGIs below $10k, 11.9% for AGIs $10k-25k, 16.4% for AGIs $25k-50k, 17.8% for AGIs $50k-75k, 19.3% for AGIs $75k-100k, 16.3% for AGIs over 100k)
Charity contributions deductions: $2,889 (3% of AGI, reported on 41.9% of returns)
Here:
$2,889
State:
$4,031
Here:
3.2% of AGI
State:
3.9% of AGI
(% of AGI for various income ranges: 1.4% for AGIs $10k-25k, 2.0% for AGIs $25k-50k, 2.0% for AGIs $50k-75k, 1.9% for AGIs $75k-100k, 2.8% for AGIs over 100k)
Total tax: $7,627 (reported on 80.7% of returns)
21635:
$7,627
State:
$10,167
(% of AGI for various income ranges: 3.0% for AGIs below $10k, 4.1% for AGIs $10k-25k, 7.3% for AGIs $25k-50k, 8.5% for AGIs $50k-75k, 9.6% for AGIs $75k-100k, 16.3% for AGIs over 100k)
Earned income credit: $1,492 (reported on 6.9% of returns)
Here:
$1,492
State:
$1,700
Percentage of individuals using paid preparers for their 2004 taxes: 62.1%
Here:
62%
State:
55%
(% for various income ranges: 50.0% for AGIs below $10k, 61.1% for AGIs $10k-25k, 55.0% for AGIs $25k-50k, 72.7% for AGIs $50k-75k, 64.0% for AGIs $75k-100k, 76.4% for AGIs over 100k)
Household received Food Stamps/SNAP in the past 12 months: 22 Household did not receive Food Stamps/SNAP in the past 12 months: 858
Women who had a birth in the past 12 months: 22 (11 now married, 10 unmarried) Women who did not have a birth in the past 12 months: 372 (159 now married, 213 unmarried)
Housing units in zip code 21635 with a mortgage: 403 (22 second mortgage, 22 both second mortgage and home equity loan) Houses without a mortgage: 33
Median monthly owner costs for units with a mortgage: $2,082 Median monthly owner costs for units without a mortgage: $743
Residents with income below the poverty level in 2022:
This zip code:
4.7%
Whole state:
9.6%
Residents with income below 50% of the poverty level in 2022:
This zip code:
1.9%
Whole state:
4.7%
Median number of rooms in houses and condos:
Here:
7.0
State:
7.3
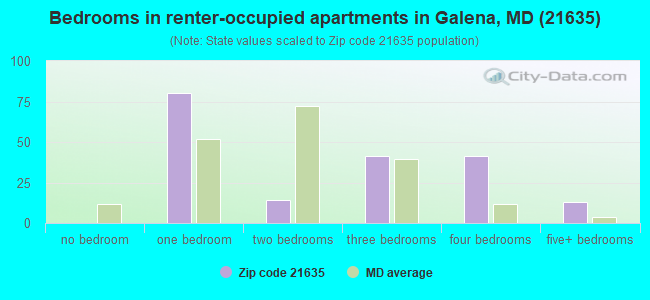
Median number of rooms in apartments:
Here:
6.2
State:
4.2
Notable locations in this zip code not listed on our city pages
Notable locations in zip code 21635: Galena Wastewater Treatment Plant (A), Fox Hole Landing (B), Galena Town Hall (C), Galena Volunteer Fire Company Incorporated Station 3 (D). Display/hide their locations on the map
232 married couples with children.
54 single-parent households (4 men, 50 women).
90.0% of residents of 21635 zip code speak English at home.
8.6% of residents speak Spanish at home (69% very well, 31% not well).
0.6% of residents speak other Indo-European language at home (100% very well).
0.3% of residents speak Asian or Pacific Island language at home (83% very well, 17% well).
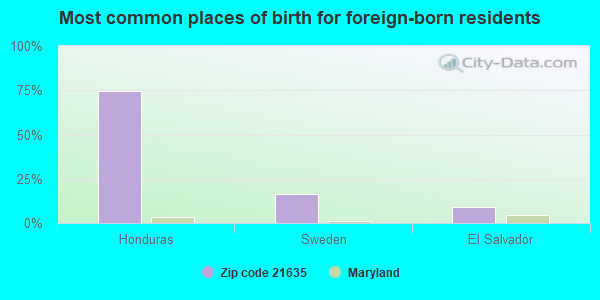
Foreign born population: 67 (3.7%) (28.7% of them are naturalized citizens)
This zip code:
3.7%
Whole state:
16.7%
75%Honduras
16%Sweden
9%El Salvador
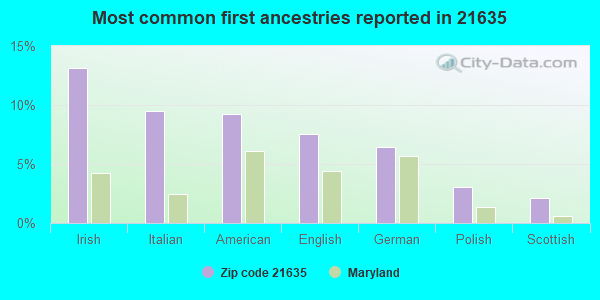
13%Irish
10%Italian
9%American
8%English
6%German
3%Polish
2%Scottish
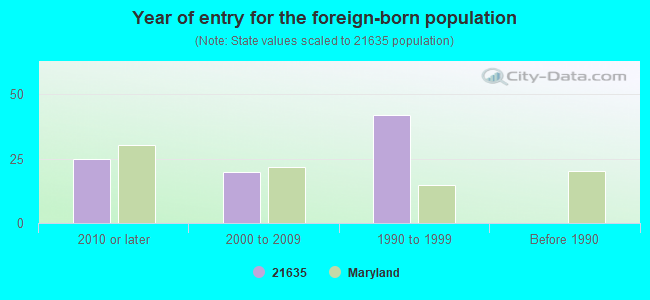
Year of entry for the foreign-born population
252010 or later
202000 to 2009
421990 to 1999
0Before 1990
Facilities with environmental interests located in this zip code:
MOBIL (ROUTE 213 & ROUTE 313 in GALENA, MD)
AIR MINOR (AIRS/AFS) STATE MASTER (Maryland Air Emissions Database) - AIR MINOR Business SIC classification: GASOLINE SERVICE STATIONS Alternative names: MOBIL - ROUTE 213 & ROUTE 313
Housing units lacking complete plumbing facilities: 0.7%
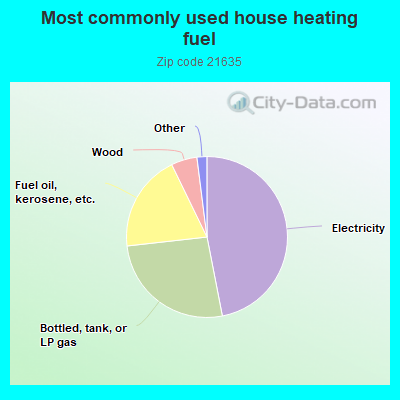
47.0%Electricity
26.3%Bottled, tank, or LP gas
19.6%Fuel oil, kerosene, etc.
5.2%Wood
0.7%Other fuel
0.7%No fuel used
0.6%Utility gas
Population in 1990: 1,087. Population change in the 1990s: +608 (+55.9%).
Place of birth for U.S.-born residents:
This state: 529
Northeast: 312
Midwest: 48
South: 782
West: 33
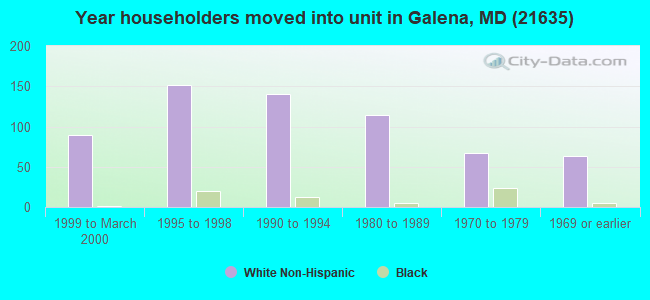
65% of the 21635 zip code residents lived in the same house 5 years ago. Out of people who lived in different houses, 38% lived in this county. Out of people who lived in different counties, 50% lived in Maryland.
90% of the 21635 zip code residents lived in the same house 1 year ago. Out of people who lived in different houses, 38% moved from this county. Out of people who lived in different houses, 23% moved from different county within same state. Out of people who lived in different houses, 36% moved from different state.
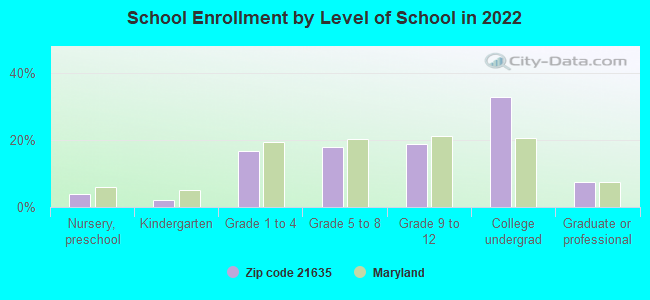
Private vs. public school enrollment:
Students in private schools in grades 1 to 8 (elementary and middle school): 7
Here:
6.1%
Maryland:
15.2%
Students in private schools in grades 9 to 12 (high school):
Here:
0.0%
Maryland:
14.4%
Students in private undergraduate colleges:
Here:
0.0%
Maryland:
20.2%
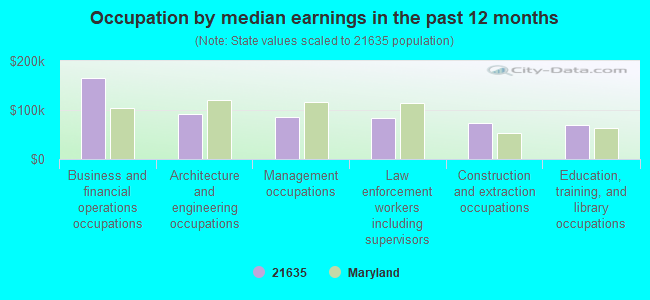
Occupation by median earnings in the past 12 months ($)
165,395Business and financial operations occupations
91,880Architecture and engineering occupations
85,862Management occupations
83,782Law enforcement workers including supervisors
73,159Construction and extraction occupations
70,339Education, training, and library occupations
Top industries in this zip code by the number of employees in 2005:
Accommodation and Food Services: Cafeterias (20-49 employees: 1 establishment)
Accommodation and Food Services: Limited-Service Restaurants (10-19: 1, 5-9: 1)
Mining: Construction Sand and Gravel Mining (10-19: 1)
Professional, Scientific, and Technical Services: Research and Development in the Physical, Engineering, and Life Sciences (10-19: 1)
Finance and Insurance: Commercial Banking (5-9: 2)
Arts, Entertainment, and Recreation: Marinas (5-9: 2)
People in group quarters in 2000:
12 people in homes for the mentally retarded
5 people in agriculture workers' dormitories on farms
Fatal accident statistics in 2012:
Fatal accident count: 1
Vehicles involved in fatal accidents: 1
Fatal accidents caused by drunken drivers: 1
Fatalities: 1
Persons involved in fatal accidents: 1
Pedestrians involved in fatal accidents: 0
Fatal accident statistics in 2010:
Fatal accident count: 1
Vehicles involved in fatal accidents: 2
Fatal accidents caused by drunken drivers: 0
Fatalities: 1
Persons involved in fatal accidents: 4
Pedestrians involved in fatal accidents: 0
2002 - 2018 National Fire Incident Reporting System (NFIRS) incidents
According to the data from the years 2002 - 2018 the average number of fire incidents per year is 21. The highest number of fire incidents - 49 took place in 2007, and the least - 5 in 2016. The data has a decreasing trend.
When looking into fire subcategories, the most incidents belonged to: Structure Fires (39.8%), and Outside Fires (34.3%).
Fire incident types reported to NFIRS in Zip Code 21635


 Nearest zip codes: 21650, 21930, 21913, 21651, 21912, 21645.


 According to the data from the years 2002 - 2018 the average number of fire incidents per year is 21. The highest number of fire incidents - 49 took place in 2007, and the least - 5 in 2016. The data has a decreasing trend.
 When looking into fire subcategories, the most incidents belonged to: Structure Fires (39.8%), and Outside Fires (34.3%).