Estimated zip code population in 2022: 3,166 Zip code population in 2010: 2,614 Zip code population in 2000: 2,514
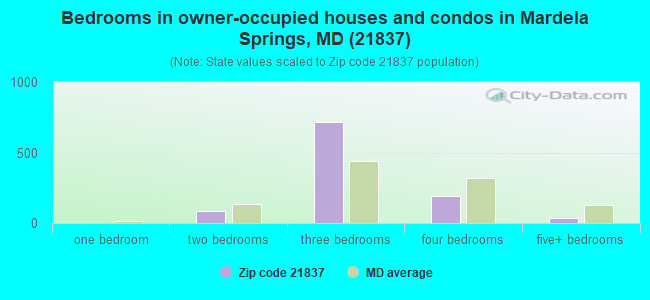
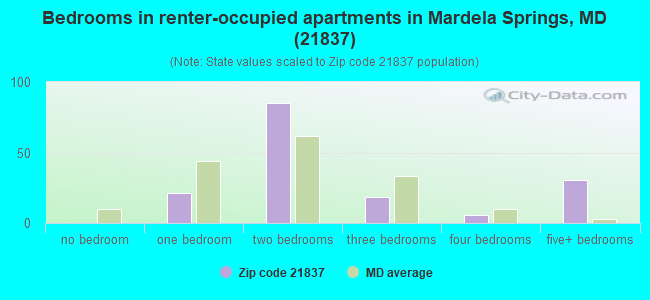
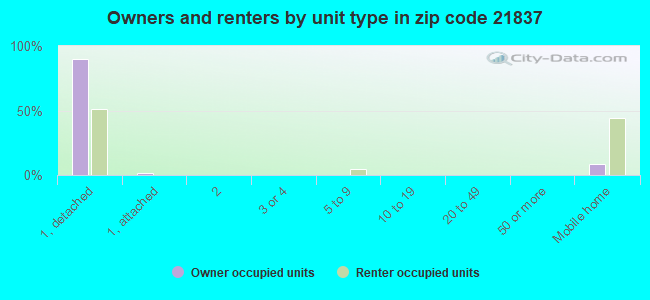
Houses and condos: 1,283 Renter-occupied apartments: 160
% of renters here:
13%
State:
32%
March 2022 cost of living index in zip code 21837: 90.9 (less than average, U.S. average is 100)
Land area: 44.4 sq. mi. Water area: 3.3 sq. mi.
Population density: 71 people per square mile
(very low).
OSM Map
General Map
Google Map
MSN Map
OSM Map
General Map
Google Map
MSN Map
OSM Map
General Map
Google Map
MSN Map
OSM Map
General Map
Google Map
MSN Map
Please wait while loading the map...
Real estate property taxes paid for housing units in 2022:
This zip code:
0.7% ($1,401)
Maryland:
0.9% ($3,777)
Median real estate property taxes paid for housing units with mortgages in 2022: $1,433 (0.6%) Median real estate property taxes paid for housing units with no mortgage in 2022: $1,346 (0.9%)
Business Search- 14 Million verified businesses
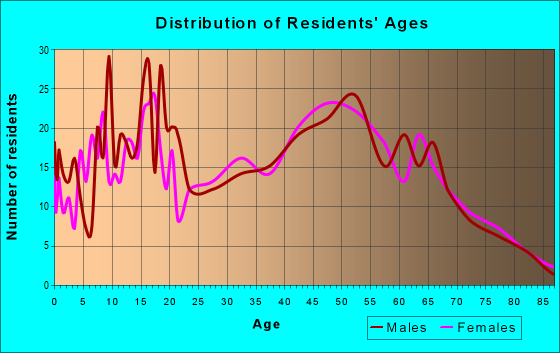
Males: 1,473
(46.5%)
Females: 1,692
(53.5%)
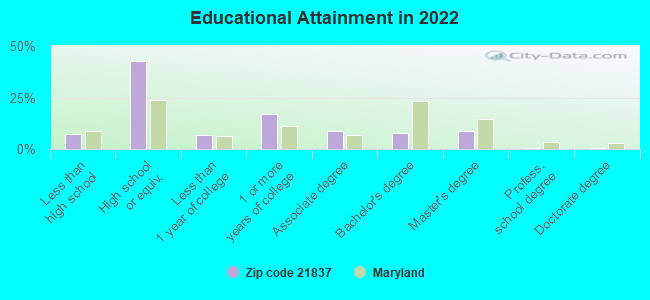
For population 25 years and over in 21837:
High school or higher: 91.2%
Bachelor's degree or higher: 17.4%
Graduate or professional degree: 9.7%
Unemployed: 2.7%
Mean travel time to work (commute): 27.4 minutes
For population 15 years and over in 21837:
Never married: 30.8%
Now married: 49.9%
Separated: 0.9%
Widowed: 4.9%
Divorced: 13.5%
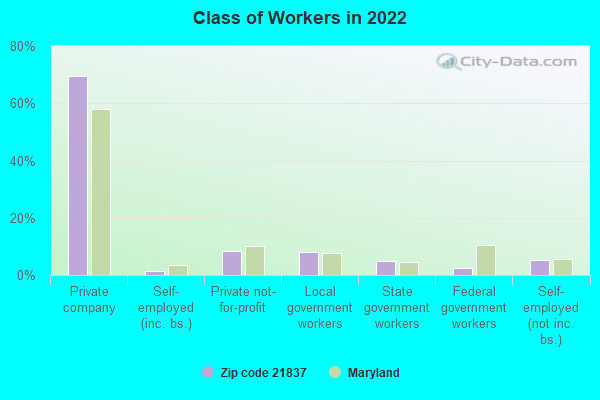
Zip code 21837 compared to state average:
Median house value below state average.
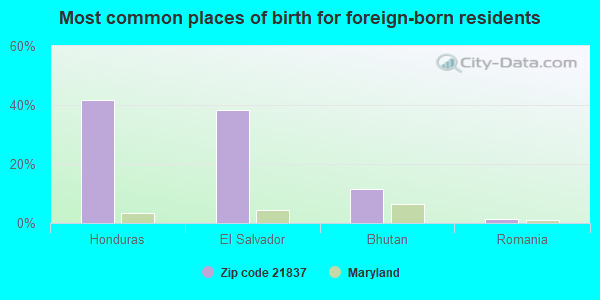
Foreign-born population percentage significantly below state average.
Renting percentage significantly below state average.
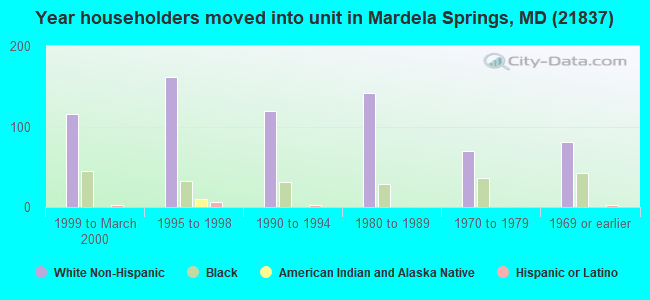
Length of stay since moving in significantly above state average.
Percentage of population with a bachelor's degree or higher significantly below state average.
Averages for the 2020 tax year for zip code 21837, filed in 2021:
Average Adjusted Gross Income (AGI) in 2020: $54,402 (Individual Income Tax Returns)
Here:
$54,402
State:
$86,905
Salary/wage: $48,376 (reported on 82.7% of returns)
Here:
$48,376
State:
$73,953
(% of AGI for various income ranges: 1187.2% for AGIs below $25k, 3366.9% for AGIs $25k-50k, 6748.5% for AGIs $50k-75k, 9035.6% for AGIs $75k-100k, 20327.0% for AGIs $100k-200k)
Taxable interest for individuals: $479 (reported on 26.8% of returns)
This zip code:
$479
Maryland:
$1,528
(% of AGI for various income ranges: 5.9% for AGIs below $25k, 9.0% for AGIs $25k-50k, 20.0% for AGIs $50k-75k, 26.7% for AGIs $75k-100k, 68.0% for AGIs $100k-200k)
Ordinary dividends: $2,669 (reported on 10.2% of returns)
Here:
$2,669
State:
$8,028
(% of AGI for various income ranges: 15.2% for AGIs $25k-50k, 41.5% for AGIs $50k-75k, 43.3% for AGIs $75k-100k, 210.0% for AGIs $100k-200k)
Net capital gain/loss in AGI: +$5,020 (reported on 7.9% of returns)
Here:
+$5,020
State:
+$25,238
(% of AGI for various income ranges: 7.6% for AGIs $25k-50k, 120.8% for AGIs $50k-75k, 323.0% for AGIs $100k-200k)
Profit/loss from business: +$8,763 (reported on 15.0% of returns)
Here:
+$8,763
State:
+$11,398
(% of AGI for various income ranges: 102.8% for AGIs below $25k, 104.1% for AGIs $25k-50k, 116.9% for AGIs $50k-75k, 102.2% for AGIs $75k-100k, 790.0% for AGIs $100k-200k)
Taxable individual retirement arrangement distribution: $11,850 (reported on 7.9% of returns)
21837:
$11,850
Maryland:
$20,944
(% of AGI for various income ranges: 106.6% for AGIs $25k-50k, 320.8% for AGIs $50k-75k, 459.0% for AGIs $100k-200k)
Total itemized deductions: $24,878 (reported on 7.1% of returns)
Here:
$24,878
State:
$30,672
(% of AGI for various income ranges: 192.1% for AGIs $25k-50k, 675.6% for AGIs $75k-100k, 1074.0% for AGIs $100k-200k)
Charity contributions: $5,350 (reported on 4.7% of returns)
Here:
$5,350
State:
$9,065
(% of AGI for various income ranges: 139.2% for AGIs $50k-75k, 140.0% for AGIs $100k-200k)
Taxes paid: $6,933 (reported on 7.1% of returns)
21837:
$6,933
State:
$8,475
(% of AGI for various income ranges: 40.0% for AGIs $25k-50k, 220.0% for AGIs $75k-100k, 310.0% for AGIs $100k-200k)
Earned income credit: $2,464 (reported on 19.7% of returns)
Here:
$2,464
State:
$2,151
(% of AGI for various income ranges: 117.8% for AGIs below $25k, 82.4% for AGIs $25k-50k)
Percentage of individuals using paid preparers for their 2020 taxes: 92.9%
Here:
93%
State:
90%
(% for various income ranges: 90.7% for AGIs below $25k, 94.3% for AGIs $25k-50k, 94.4% for AGIs $50k-75k, 92.3% for AGIs $75k-100k, 93.8% for AGIs $100k-200k, 100.0% for AGIs over 200k)
Averages for the 2012 tax year for zip code 21837, filed in 2013:
Average Adjusted Gross Income (AGI) in 2012: $43,521 (Individual Income Tax Returns)
Here:
$43,521
State:
$72,703
Salary/wage: $40,096 (reported on 85.3% of returns)
Here:
$40,096
State:
$62,228
(% of AGI for various income ranges: 73.8% for AGIs below $25k, 79.7% for AGIs $25k-50k, 74.4% for AGIs $50k-75k, 76.6% for AGIs $75k-100k, 84.4% for AGIs $100k-200k)
Taxable interest for individuals: $481 (reported on 31.0% of returns)
This zip code:
$481
Maryland:
$1,413
(% of AGI for various income ranges: 0.8% for AGIs below $25k, 0.4% for AGIs $25k-50k, 0.3% for AGIs $50k-75k, 0.3% for AGIs $75k-100k, 0.2% for AGIs $100k-200k)
Ordinary dividends: $787 (reported on 12.9% of returns)
Here:
$787
State:
$6,933
(% of AGI for various income ranges: 0.2% for AGIs below $25k, 0.2% for AGIs $25k-50k, 0.1% for AGIs $50k-75k, 0.3% for AGIs $75k-100k, 0.3% for AGIs $100k-200k)
Net capital gain/loss in AGI: +$233 (reported on 5.2% of returns)
Here:
+$233
State:
+$14,830
Profit/loss from business: +$7,235 (reported on 17.2% of returns)
Here:
+$7,235
State:
+$12,606
(% of AGI for various income ranges: 6.5% for AGIs below $25k, 2.2% for AGIs $25k-50k, 3.6% for AGIs $50k-75k, 4.7% for AGIs $75k-100k)
Taxable individual retirement arrangement distribution: $10,030 (reported on 8.6% of returns)
21837:
$10,030
Maryland:
$17,065
(% of AGI for various income ranges: 2.3% for AGIs below $25k, 2.9% for AGIs $25k-50k, 2.6% for AGIs $50k-75k, 2.9% for AGIs $75k-100k)
Total itemized deductions: $18,505 (24% of AGI, reported on 32.8% of returns)
Here:
$18,505
State:
$27,886
Here:
24.4% of AGI
State:
22.8% of AGI
(% of AGI for various income ranges: 5.3% for AGIs below $25k, 10.1% for AGIs $25k-50k, 15.6% for AGIs $50k-75k, 18.1% for AGIs $75k-100k, 17.1% for AGIs $100k-200k)
Charity contributions: $2,766 (reported on 25.0% of returns)
Here:
$2,766
State:
$4,452
(% of AGI for various income ranges: 1.5% for AGIs $25k-50k, 1.8% for AGIs $50k-75k, 2.4% for AGIs $75k-100k, 1.7% for AGIs $100k-200k)
Taxes paid: $6,668 (reported on 31.9% of returns)
21837:
$6,668
State:
$11,690
(% of AGI for various income ranges: 0.7% for AGIs below $25k, 2.5% for AGIs $25k-50k, 4.8% for AGIs $50k-75k, 6.7% for AGIs $75k-100k, 7.7% for AGIs $100k-200k)
Earned income credit: $2,508 (reported on 22.4% of returns)
Here:
$2,508
State:
$2,199
(% of AGI for various income ranges: 7.7% for AGIs below $25k, 1.5% for AGIs $25k-50k)
Percentage of individuals using paid preparers for their 2012 taxes: 53.4%
Here:
53%
State:
52%
(% for various income ranges: 46.8% for AGIs below $25k, 50.0% for AGIs $25k-50k, 62.5% for AGIs $50k-75k, 63.6% for AGIs $75k-100k, 70.0% for AGIs $100k-200k)
Averages for the 2004 tax year for zip code 21837, filed in 2005:
Average Adjusted Gross Income (AGI) in 2004: $35,810 (Individual Income Tax Returns)
Here:
$35,810
State:
$60,339
Salary/wage: $33,300 (reported on 86.5% of returns)
Here:
$33,300
State:
$52,211
(% of AGI for various income ranges: 111.3% for AGIs below $10k, 80.4% for AGIs $10k-25k, 83.2% for AGIs $25k-50k, 81.7% for AGIs $50k-75k, 86.4% for AGIs $75k-100k, 63.2% for AGIs over 100k)
Taxable interest for individuals: $811 (reported on 35.6% of returns)
This zip code:
$811
Maryland:
$1,701
(% of AGI for various income ranges: 8.0% for AGIs below $10k, 1.3% for AGIs $10k-25k, 0.6% for AGIs $25k-50k, 0.9% for AGIs $50k-75k, 0.4% for AGIs $75k-100k, 0.3% for AGIs over 100k)
Taxable dividends: $1,181 (reported on 15.1% of returns)
Here:
$1,181
State:
$4,235
(% of AGI for various income ranges: 1.9% for AGIs below $10k, 0.8% for AGIs $10k-25k, 0.4% for AGIs $25k-50k, 0.2% for AGIs $50k-75k, 0.2% for AGIs $75k-100k, 1.0% for AGIs over 100k)
Net capital gain/loss: +$5,207 (reported on 10.3% of returns)
Here:
+$5,207
State:
+$15,888
(% of AGI for various income ranges: -0.7% for AGIs below $10k, 0.1% for AGIs $10k-25k, 1.0% for AGIs $25k-50k, 0.2% for AGIs $50k-75k, 0.8% for AGIs $75k-100k, 6.6% for AGIs over 100k)
Profit/loss from business: +$6,751 (reported on 16.8% of returns)
Here:
+$6,751
State:
+$12,221
(% of AGI for various income ranges: 13.4% for AGIs below $10k, 3.8% for AGIs $10k-25k, 3.8% for AGIs $25k-50k, 4.7% for AGIs $50k-75k, 0.8% for AGIs $75k-100k, 0.7% for AGIs over 100k)
IRA payment deduction: $2,241 (reported on 2.5% of returns)
21837:
$2,241
Maryland:
$2,968
Total itemized deductions: $15,300 (23% of AGI, reported on 31.8% of returns)
Here:
$15,300
State:
$22,960
Here:
23.3% of AGI
State:
23.3% of AGI
(% of AGI for various income ranges: 5.8% for AGIs $10k-25k, 12.3% for AGIs $25k-50k, 16.3% for AGIs $50k-75k, 19.6% for AGIs $75k-100k, 13.8% for AGIs over 100k)
Charity contributions deductions: $2,359 (4% of AGI, reported on 27.5% of returns)
Here:
$2,359
State:
$4,031
Here:
3.6% of AGI
State:
3.9% of AGI
(% of AGI for various income ranges: 0.9% for AGIs $10k-25k, 1.6% for AGIs $25k-50k, 2.4% for AGIs $50k-75k, 2.0% for AGIs $75k-100k, 2.2% for AGIs over 100k)
Total tax: $4,156 (reported on 73.7% of returns)
21837:
$4,156
State:
$10,167
(% of AGI for various income ranges: 3.7% for AGIs below $10k, 3.7% for AGIs $10k-25k, 6.7% for AGIs $25k-50k, 8.3% for AGIs $50k-75k, 9.6% for AGIs $75k-100k, 16.1% for AGIs over 100k)
Earned income credit: $1,680 (reported on 20.8% of returns)
Here:
$1,680
State:
$1,700
Percentage of individuals using paid preparers for their 2004 taxes: 55.0%
Here:
55%
State:
55%
(% for various income ranges: 49.3% for AGIs below $10k, 51.5% for AGIs $10k-25k, 52.5% for AGIs $25k-50k, 68.4% for AGIs $50k-75k, 62.1% for AGIs $75k-100k, 69.2% for AGIs over 100k)
Household received Food Stamps/SNAP in the past 12 months: 138 Household did not receive Food Stamps/SNAP in the past 12 months: 1,060
Women who had a birth in the past 12 months: 61 (48 now married, 12 unmarried) Women who did not have a birth in the past 12 months: 567 (226 now married, 340 unmarried)
Housing units in zip code 21837 with a mortgage: 646 (46 second mortgage, 8 home equity loan, 39 both second mortgage and home equity loan) Houses without a mortgage: 23
Median monthly owner costs for units with a mortgage: $1,280 Median monthly owner costs for units without a mortgage: $459
Residents with income below the poverty level in 2022:
This zip code:
4.7%
Whole state:
9.6%
Residents with income below 50% of the poverty level in 2022:
This zip code:
2.7%
Whole state:
4.7%
Median number of rooms in houses and condos:
Here:
6.7
State:
7.3
Median number of rooms in apartments:
Here:
3.3
State:
4.2
Notable locations in this zip code not listed on our city pages
Notable locations in zip code 21837: Camphels Wharf (A), Athaloo Landing (B), Camp Merrill (C), Mardela Springs Volunteer Fire Department (D), Mardella Springs Town Hall (E). Display/hide their locations on the map
Churches in zip code 21837 include: Snethen United Methodist Church (A), Mardela Apostolic Church (B), John Wesley United Methodist Church (C), Gateway Church of Christ (D), Barren Creek Presbyterian Church (E), Emmanuel Church (F), First Baptist Church (G), Mount Nebo United Methodist Church (H), Mount Pleasant Church (I). Display/hide their locations on the map
Streams, rivers, and creeks: Barren Creek (A), Big Ridges (B), Birdcage Creek (C), Bratton Creek (D), Bridge Creek (E), Tom Fitchs Gut (F), Den Creek (G), Mockingbird Creek (H), Mill Branch (I). Display/hide their locations on the map
In group quarters: 6 (-1 institutionalized population)
Size of family households: 385 2-persons, 180 3-persons, 107 4-persons, 104 5-persons, 21 6-persons, 6 7-or-more-persons
Size of nonfamily households: 292 1-person, 67 2-persons, 34 3-persons
467 married couples with children.
174 single-parent households (135 men, 39 women).
91.9% of residents of 21837 zip code speak English at home.
4.9% of residents speak Spanish at home (68% very well, 32% well).
2.1% of residents speak other Indo-European language at home (100% very well).
Foreign born population: 154 (4.9%) (66.3% of them are naturalized citizens)
This zip code:
4.9%
Whole state:
16.7%
42%Honduras
38%El Salvador
12%Bhutan
1%Romania
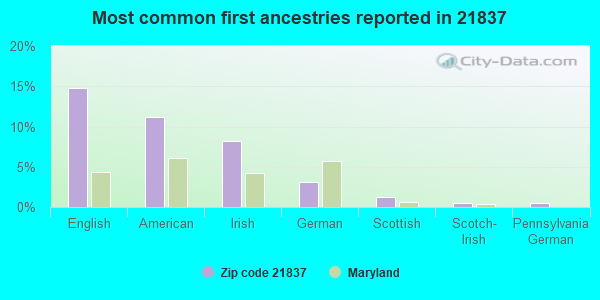
15%English
11%American
8%Irish
3%German
1%Scottish
0%Scotch-Irish
0%Pennsylvania German
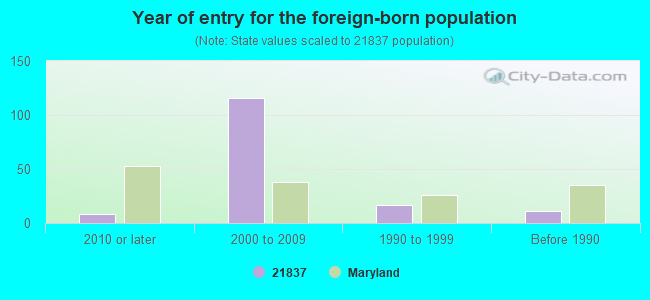
Year of entry for the foreign-born population
82010 or later
1162000 to 2009
171990 to 1999
11Before 1990
Facilities with environmental interests located in this zip code:
MARDELA HIGH SCHOOL (24940 DELMAR ROAD in MARDELA SPRINGS, MD)
AIR MINOR (AIRS/AFS) STATE MASTER (Maryland Permits tracking) - NPDES NON-MAJOR STATE MASTER (Maryland Air Emissions Database) - AIR MINOR National Pollutant Discharge Elimination System NON-MAJOR (Tracking pollutant discharge elimination systems) - permit Business SIC classification: ELEMENTARY AND SECONDARY SCHOOLS Alternative names: MARDELA HIGH SCHOOL WWTP, MARDELA MIDDLE & HIGH, WICOMICO CO BD OF EDUC.MARDELA
NORTHWESTERN ELEMENTARY SCHOOL (9975 SHARPTOWN ROAD in MARDELA SPRINGS, MD)
AIR MINOR (AIRS/AFS) STATE MASTER (Maryland Air Emissions Database) - AIR MINOR (National Center for Education Statistics) - STATE ID-220106 Business SIC classification: ELEMENTARY AND SECONDARY SCHOOLS Organizations: WICOMICO COUNTY BOARD OF EDUCATION (SCHOOL DISTRICT)
PERDUE RESEARCH FARM #16 (23417 TAYLORS TRAIL in MARDELA SPRINGS, MD)
AIR MINOR (AIRS/AFS) STATE MASTER (Maryland Air Emissions Database) - AIR MAJOR Business SIC classification: BROILER, FRYER, AND ROASTER CHICKENS; POULTRY SLAUGHTERING AND PROCESSING Alternative names: PERDUE FARMS
Housing units lacking complete plumbing facilities: 0.6% Housing units lacking complete kitchen facilities: 0.4%
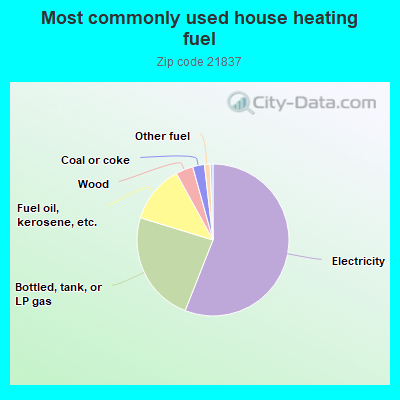
56.1%Electricity
23.8%Bottled, tank, or LP gas
12.3%Fuel oil, kerosene, etc.
3.7%Wood
2.5%Coal or coke
1.2%Other fuel
Population in 1990: 3,039.
Place of birth for U.S.-born residents:
This state: 2,284
Northeast: 139
Midwest: 29
South: 502
West: 24
62% of the 21837 zip code residents lived in the same house 5 years ago. Out of people who lived in different houses, 67% lived in this county. Out of people who lived in different counties, 50% lived in Maryland.
95% of the 21837 zip code residents lived in the same house 1 year ago. Out of people who lived in different houses, 27% moved from this county. Out of people who lived in different houses, 58% moved from different county within same state. Out of people who lived in different houses, 25% moved from different state.
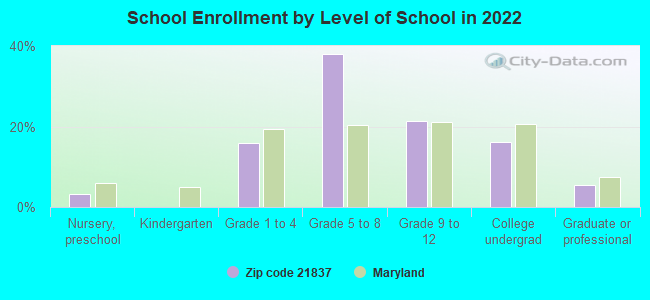
Private vs. public school enrollment:
Students in private schools in grades 1 to 8 (elementary and middle school): 4
Here:
1.5%
Maryland:
15.2%
Students in private schools in grades 9 to 12 (high school): 2
Here:
1.5%
Maryland:
14.4%
Students in private undergraduate colleges:
Here:
0.0%
Maryland:
20.2%
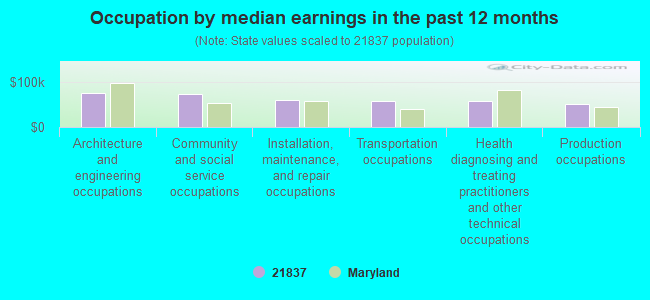
Occupation by median earnings in the past 12 months ($)
73,758Architecture and engineering occupations
72,479Community and social service occupations
58,670Installation, maintenance, and repair occupations
58,123Transportation occupations
57,098Health diagnosing and treating practitioners and other technical occupations
51,480Production occupations
Companies with federal contracts located in this zip code:
J G PARKS & SON INC (24360 OCEAN GATEWAY in MARDELA SPRING, MD; small business) : $23,163 in 2 contractsfrom 2005 to 2006
$18,253 with Air Force for Diesel Engines and Components. Signed on 2006-02-10. Completion date: 2006-04-21.
$4,910 with Air Force for Diesel Engines and Components. Taking place in DE. Signed on 2005-10-31. Completion date: 2005-11-25.
Top industries in this zip code by the number of employees in 2005:
Other Services (except Public Administration): General Automotive Repair (20-49 employees: 1 establishment, 1-4 employees: 1 establishment)
Health Care and Social Assistance: Offices of Physicians, Mental Health Specialists (20-49: 1)
Construction: All Other Specialty Trade Contractors (10-19: 1)
Construction: Plumbing, Heating, and Air-Conditioning Contractors (5-9: 1, 1-4: 1)
Administrative and Support and Waste Management and Remediation Services: Other Services to Buildings and Dwellings (5-9: 1)
People in group quarters in 2010:
6 people in group homes for juveniles (non-correctional)
People in group quarters in 2000:
3 people in homes or halfway houses for drug/alcohol abuse
Fatal accident statistics in 2010:
Fatal accident count: 1
Vehicles involved in fatal accidents: 1
Fatal accidents caused by drunken drivers: 0
Fatalities: 1
Persons involved in fatal accidents: 1
Pedestrians involved in fatal accidents: 0
Home Mortgage Disclosure Act Aggregated Statistics For Year 2009 (Based on 2 partial tracts)
A) FHA, FSA/RHS & VA Home Purchase Loans
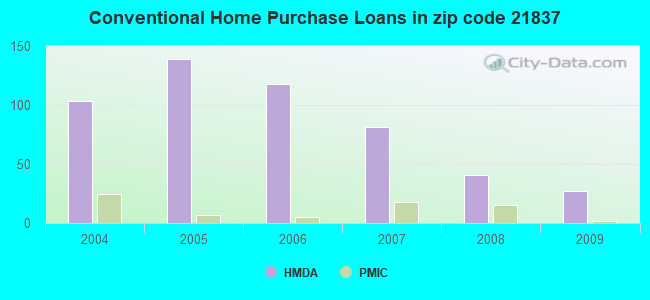
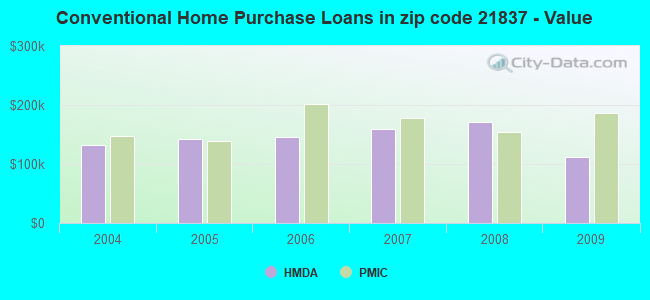
B) Conventional Home Purchase Loans
C) Refinancings
D) Home Improvement Loans
F) Non-occupant Loans on < 5 Family Dwellings (A B C & D)
G) Loans On Manufactured Home Dwelling (A B C & D)
Number
Average Value
Number
Average Value
Number
Average Value
Number
Average Value
Number
Average Value
Number
Average Value
LOANS ORIGINATED
25
$177,295
27
$112,082
116
$159,530
7
$62,537
15
$102,587
7
$78,646
APPLICATIONS APPROVED, NOT ACCEPTED
2
$146,750
3
$53,617
17
$160,651
2
$3,315
2
$40,625
2
$242,095
APPLICATIONS DENIED
3
$184,060
5
$52,730
70
$197,468
3
$88,990
3
$70,197
2
$72,130
APPLICATIONS WITHDRAWN
3
$165,820
0
$0
28
$190,456
2
$315,060
0
$0
2
$211,420
FILES CLOSED FOR INCOMPLETENESS
0
$0
0
$0
5
$113,420
0
$0
0
$0
0
$0
Aggregated Statistics For Year 2008 (Based on 2 partial tracts)
A) FHA, FSA/RHS & VA Home Purchase Loans
B) Conventional Home Purchase Loans
C) Refinancings
D) Home Improvement Loans
F) Non-occupant Loans on < 5 Family Dwellings (A B C & D)
G) Loans On Manufactured Home Dwelling (A B C & D)
Number
Average Value
Number
Average Value
Number
Average Value
Number
Average Value
Number
Average Value
Number
Average Value
LOANS ORIGINATED
27
$158,880
41
$171,159
118
$175,263
33
$70,850
25
$109,839
12
$138,598
APPLICATIONS APPROVED, NOT ACCEPTED
0
$0
3
$121,050
22
$123,687
3
$13,817
0
$0
3
$60,800
APPLICATIONS DENIED
2
$131,000
15
$150,454
111
$158,993
27
$69,337
8
$101,565
5
$79,926
APPLICATIONS WITHDRAWN
0
$0
5
$235,796
40
$164,991
5
$64,338
7
$58,037
0
$0
FILES CLOSED FOR INCOMPLETENESS
2
$103,635
2
$66,330
5
$189,034
2
$84,570
0
$0
0
$0
Aggregated Statistics For Year 2007 (Based on 2 partial tracts)
A) FHA, FSA/RHS & VA Home Purchase Loans
B) Conventional Home Purchase Loans
C) Refinancings
D) Home Improvement Loans
F) Non-occupant Loans on < 5 Family Dwellings (A B C & D)
G) Loans On Manufactured Home Dwelling (A B C & D)
Number
Average Value
Number
Average Value
Number
Average Value
Number
Average Value
Number
Average Value
Number
Average Value
LOANS ORIGINATED
5
$135,310
81
$160,088
153
$155,231
46
$76,493
33
$89,392
10
$90,869
APPLICATIONS APPROVED, NOT ACCEPTED
0
$0
7
$148,764
10
$135,641
2
$24,875
5
$133,982
0
$0
APPLICATIONS DENIED
2
$106,125
15
$117,179
121
$144,209
38
$64,975
8
$82,910
12
$72,546
APPLICATIONS WITHDRAWN
0
$0
3
$140,393
66
$172,327
3
$155,317
2
$55,550
2
$119,390
FILES CLOSED FOR INCOMPLETENESS
0
$0
3
$258,127
15
$192,683
2
$41,455
3
$80,700
0
$0
Aggregated Statistics For Year 2006 (Based on 2 partial tracts)
A) FHA, FSA/RHS & VA Home Purchase Loans
B) Conventional Home Purchase Loans
C) Refinancings
D) Home Improvement Loans
F) Non-occupant Loans on < 5 Family Dwellings (A B C & D)
G) Loans On Manufactured Home Dwelling (A B C & D)
Number
Average Value
Number
Average Value
Number
Average Value
Number
Average Value
Number
Average Value
Number
Average Value
LOANS ORIGINATED
10
$160,845
118
$146,132
227
$142,196
41
$84,326
30
$138,570
22
$105,823
APPLICATIONS APPROVED, NOT ACCEPTED
0
$0
20
$117,981
30
$172,232
10
$70,805
2
$55,550
7
$73,434
APPLICATIONS DENIED
0
$0
27
$114,293
126
$161,872
30
$48,419
13
$123,217
15
$96,175
APPLICATIONS WITHDRAWN
3
$159,187
13
$143,881
99
$153,794
10
$128,511
0
$0
2
$30,675
FILES CLOSED FOR INCOMPLETENESS
0
$0
5
$71,966
27
$169,382
2
$99,490
0
$0
0
$0
Aggregated Statistics For Year 2005 (Based on 2 partial tracts)
A) FHA, FSA/RHS & VA Home Purchase Loans
B) Conventional Home Purchase Loans
C) Refinancings
D) Home Improvement Loans
E) Loans on Dwellings For 5+ Families
F) Non-occupant Loans on < 5 Family Dwellings (A B C & D)
G) Loans On Manufactured Home Dwelling (A B C & D)
Number
Average Value
Number
Average Value
Number
Average Value
Number
Average Value
Number
Average Value
Number
Average Value
Number
Average Value
LOANS ORIGINATED
10
$152,886
139
$141,758
196
$130,126
33
$65,072
2
$298,475
33
$91,905
13
$88,905
APPLICATIONS APPROVED, NOT ACCEPTED
0
$0
10
$82,744
17
$91,494
3
$60,800
0
$0
0
$0
3
$43,113
APPLICATIONS DENIED
0
$0
17
$63,597
106
$115,965
36
$44,587
0
$0
3
$33,717
18
$57,484
APPLICATIONS WITHDRAWN
2
$73,790
33
$105,622
99
$122,255
13
$105,615
0
$0
12
$104,743
5
$49,414
FILES CLOSED FOR INCOMPLETENESS
2
$75,450
7
$90,727
15
$132,103
0
$0
0
$0
0
$0
5
$65,996
Aggregated Statistics For Year 2004 (Based on 2 partial tracts)
A) FHA, FSA/RHS & VA Home Purchase Loans
B) Conventional Home Purchase Loans
C) Refinancings
D) Home Improvement Loans
F) Non-occupant Loans on < 5 Family Dwellings (A B C & D)
G) Loans On Manufactured Home Dwelling (A B C & D)
Detailed PMIC statistics for the following Tracts:0107.01
2002 - 2018 National Fire Incident Reporting System (NFIRS) incidents
According to the data from the years 2002 - 2018 the average number of fire incidents per year is 33. The highest number of fire incidents - 68 took place in 2010, and the least - 10 in 2003. The data has a growing trend.
When looking into fire subcategories, the most incidents belonged to: Structure Fires (46.5%), and Outside Fires (31.5%).
Fire incident types reported to NFIRS in Zip Code 21837
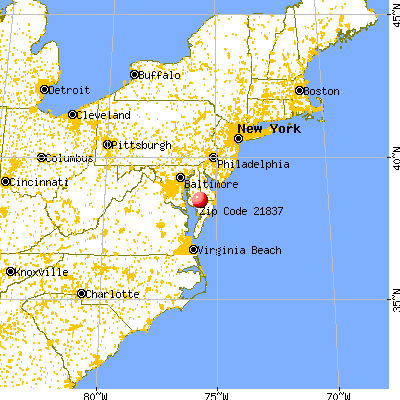


 Nearest zip codes: 21830, 21861, 21856, 21869, 21659, 21801.
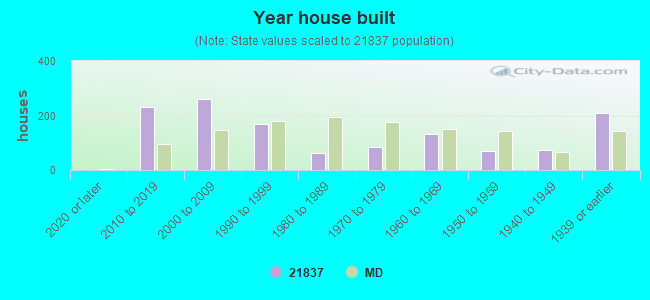


 According to the data from the years 2002 - 2018 the average number of fire incidents per year is 33. The highest number of fire incidents - 68 took place in 2010, and the least - 10 in 2003. The data has a growing trend.
 When looking into fire subcategories, the most incidents belonged to: Structure Fires (46.5%), and Outside Fires (31.5%).