Estimated zip code population in 2022: 9,795 Zip code population in 2010: 6,991 Zip code population in 2000: 4,401
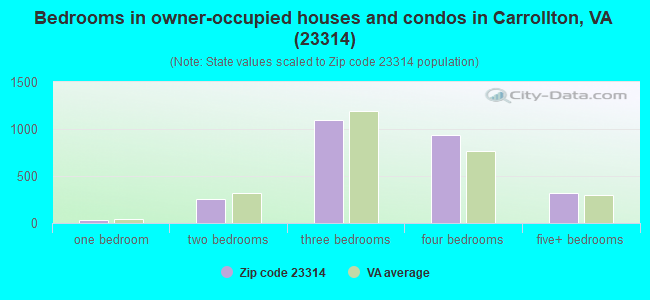
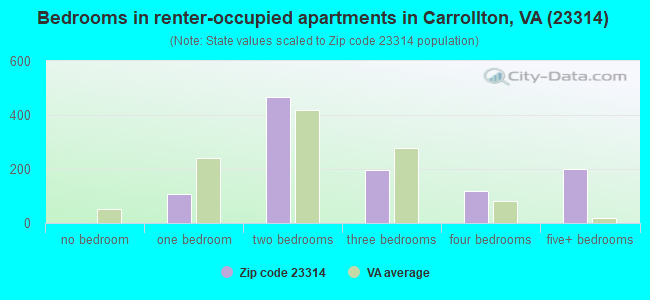
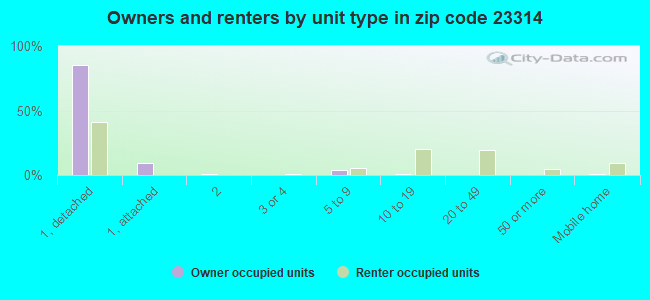
Houses and condos: 3,992 Renter-occupied apartments: 1,094
% of renters here:
29%
State:
33%
March 2022 cost of living index in zip code 23314: 97.3 (near average, U.S. average is 100)
Land area: 19.2 sq. mi. Water area: 16.6 sq. mi.
Population density: 511 people per square mile
(low).
OSM Map
General Map
Google Map
MSN Map
OSM Map
General Map
Google Map
MSN Map
OSM Map
General Map
Google Map
MSN Map
OSM Map
General Map
Google Map
MSN Map
Please wait while loading the map...
Real estate property taxes paid for housing units in 2022:
This zip code:
0.7% ($2,917)
Virginia:
0.7% ($2,617)
Median real estate property taxes paid for housing units with mortgages in 2022: $3,080 (0.7%) Median real estate property taxes paid for housing units with no mortgage in 2022: $2,664 (0.7%)
Business Search- 14 Million verified businesses
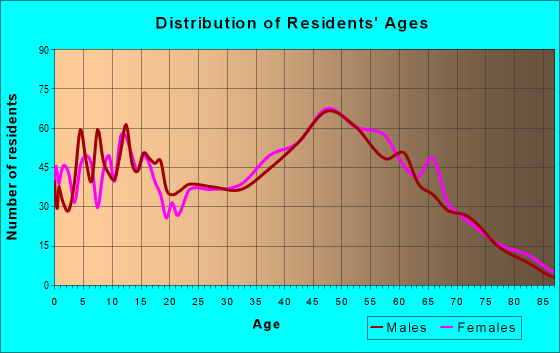
Males: 5,216
(53.2%)
Females: 4,579
(46.8%)
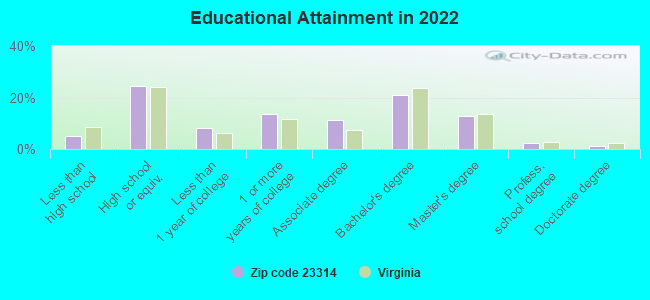
For population 25 years and over in 23314:
High school or higher: 94.4%
Bachelor's degree or higher: 37.1%
Graduate or professional degree: 16.2%
Unemployed: 8.1%
Mean travel time to work (commute): 24.9 minutes
For population 15 years and over in 23314:
Never married: 24.8%
Now married: 56.6%
Separated: 1.3%
Widowed: 5.1%
Divorced: 12.1%
Zip code 23314 compared to state average:
Unemployed percentage above state average.
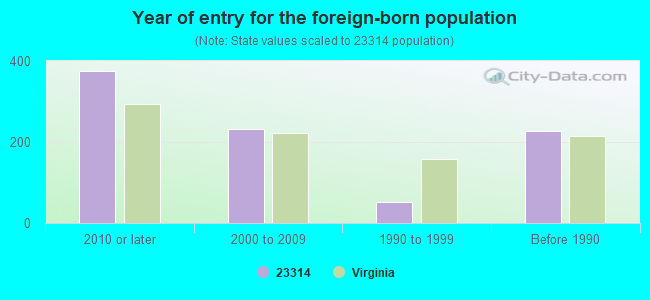
Foreign-born population percentage below state average.
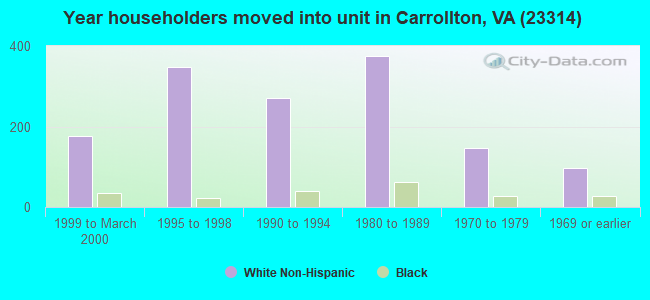
Length of stay since moving in significantly above state average.
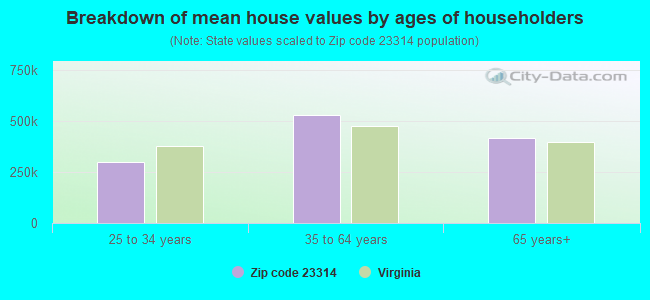
Estimated median house/condo value in 2022: $405,090
23314:
$405,090
Virginia:
$365,700
According to our research of Virginia and other state lists, there were 14 registered sex offenders living in 23314 zip code as of April 28, 2024. The ratio of all residents to sex offenders in zip code 23314 is 551 to 1. The ratio of registered sex offenders to all residents in this zip code is lower than the state average.
Median resident age:
This zip code:
38.7 years
Virginia median age:
39.0 years
Average household size:
This zip code:
2.6 people
Virginia:
2.5 people
Averages for the 2020 tax year for zip code 23314, filed in 2021:
Average Adjusted Gross Income (AGI) in 2020: $88,060 (Individual Income Tax Returns)
Here:
$88,060
State:
$86,446
Salary/wage: $74,147 (reported on 84.0% of returns)
Here:
$74,147
State:
$71,185
(% of AGI for various income ranges: 1115.3% for AGIs below $25k, 3776.1% for AGIs $25k-50k, 6076.9% for AGIs $50k-75k, 9404.6% for AGIs $75k-100k, 18305.5% for AGIs $100k-200k, 73033.3% for AGIs over 200k)
Taxable interest for individuals: $1,213 (reported on 37.0% of returns)
This zip code:
$1,213
Virginia:
$1,805
(% of AGI for various income ranges: 15.0% for AGIs below $25k, 20.4% for AGIs $25k-50k, 42.5% for AGIs $50k-75k, 70.5% for AGIs $75k-100k, 84.2% for AGIs $100k-200k, 860.0% for AGIs over 200k)
Ordinary dividends: $4,014 (reported on 20.8% of returns)
Here:
$4,014
State:
$8,327
(% of AGI for various income ranges: 15.5% for AGIs below $25k, 28.0% for AGIs $25k-50k, 65.3% for AGIs $50k-75k, 114.6% for AGIs $75k-100k, 196.0% for AGIs $100k-200k, 1646.7% for AGIs over 200k)
Net capital gain/loss in AGI: +$16,262 (reported on 18.2% of returns)
Here:
+$16,262
State:
+$24,644
(% of AGI for various income ranges: 9.9% for AGIs below $25k, 14.9% for AGIs $25k-50k, 29.8% for AGIs $50k-75k, 50.0% for AGIs $75k-100k, 375.5% for AGIs $100k-200k, 11877.8% for AGIs over 200k)
Profit/loss from business: +$7,565 (reported on 14.1% of returns)
Here:
+$7,565
State:
+$12,836
(% of AGI for various income ranges: 60.9% for AGIs below $25k, 28.7% for AGIs $25k-50k, 112.4% for AGIs $75k-100k, 287.1% for AGIs $100k-200k, 2193.3% for AGIs over 200k)
Taxable individual retirement arrangement distribution: $18,298 (reported on 10.6% of returns)
23314:
$18,298
Virginia:
$21,535
(% of AGI for various income ranges: 44.4% for AGIs below $25k, 116.8% for AGIs $25k-50k, 210.7% for AGIs $50k-75k, 328.4% for AGIs $75k-100k, 651.8% for AGIs $100k-200k, 1336.7% for AGIs over 200k)
Total itemized deductions: $30,889 (reported on 18.0% of returns)
Here:
$30,889
State:
$33,287
(% of AGI for various income ranges: 69.6% for AGIs below $25k, 164.1% for AGIs $25k-50k, 565.3% for AGIs $50k-75k, 947.3% for AGIs $75k-100k, 1669.8% for AGIs $100k-200k, 7216.7% for AGIs over 200k)
Charity contributions: $9,104 (reported on 14.9% of returns)
Here:
$9,104
State:
$10,381
(% of AGI for various income ranges: 38.7% for AGIs $25k-50k, 135.5% for AGIs $50k-75k, 201.6% for AGIs $75k-100k, 408.8% for AGIs $100k-200k, 2074.4% for AGIs over 200k)
Taxes paid: $7,757 (reported on 18.0% of returns)
23314:
$7,757
State:
$8,284
(% of AGI for various income ranges: 8.7% for AGIs below $25k, 26.5% for AGIs $25k-50k, 117.6% for AGIs $50k-75k, 225.4% for AGIs $75k-100k, 475.2% for AGIs $100k-200k, 1796.7% for AGIs over 200k)
Earned income credit: $2,067 (reported on 10.4% of returns)
Here:
$2,067
State:
$2,214
(% of AGI for various income ranges: 76.7% for AGIs below $25k, 57.1% for AGIs $25k-50k)
Percentage of individuals using paid preparers for their 2020 taxes: 92.2%
Here:
92%
State:
92%
(% for various income ranges: 92.1% for AGIs below $25k, 90.8% for AGIs $25k-50k, 92.0% for AGIs $50k-75k, 90.7% for AGIs $75k-100k, 93.9% for AGIs $100k-200k, 93.5% for AGIs over 200k)
Averages for the 2012 tax year for zip code 23314, filed in 2013:
Average Adjusted Gross Income (AGI) in 2012: $70,361 (Individual Income Tax Returns)
Here:
$70,361
State:
$71,192
Salary/wage: $63,099 (reported on 87.2% of returns)
Here:
$63,099
State:
$59,229
(% of AGI for various income ranges: 78.5% for AGIs below $25k, 81.3% for AGIs $25k-50k, 78.2% for AGIs $50k-75k, 78.9% for AGIs $75k-100k, 81.5% for AGIs $100k-200k, 65.5% for AGIs over 200k)
Taxable interest for individuals: $963 (reported on 41.3% of returns)
This zip code:
$963
Virginia:
$1,600
(% of AGI for various income ranges: 1.6% for AGIs below $25k, 0.6% for AGIs $25k-50k, 0.6% for AGIs $50k-75k, 0.5% for AGIs $75k-100k, 0.4% for AGIs $100k-200k, 0.9% for AGIs over 200k)
Ordinary dividends: $2,564 (reported on 24.0% of returns)
Here:
$2,564
State:
$6,959
(% of AGI for various income ranges: 1.1% for AGIs below $25k, 0.7% for AGIs $25k-50k, 0.9% for AGIs $50k-75k, 1.1% for AGIs $75k-100k, 0.6% for AGIs $100k-200k, 1.4% for AGIs over 200k)
Net capital gain/loss in AGI: +$4,448 (reported on 16.4% of returns)
Here:
+$4,448
State:
+$16,672
(% of AGI for various income ranges: 0.5% for AGIs $50k-75k, 0.7% for AGIs $75k-100k, 0.6% for AGIs $100k-200k, 4.5% for AGIs over 200k)
Profit/loss from business: +$8,419 (reported on 12.5% of returns)
Here:
+$8,419
State:
+$14,116
(% of AGI for various income ranges: 2.8% for AGIs below $25k, 1.1% for AGIs $25k-50k, 1.0% for AGIs $50k-75k, 0.7% for AGIs $75k-100k, 1.0% for AGIs $100k-200k, 4.4% for AGIs over 200k)
Taxable individual retirement arrangement distribution: $13,392 (reported on 9.9% of returns)
23314:
$13,392
Virginia:
$16,667
(% of AGI for various income ranges: 2.6% for AGIs below $25k, 2.1% for AGIs $25k-50k, 2.5% for AGIs $50k-75k, 2.2% for AGIs $75k-100k, 2.0% for AGIs $100k-200k)
Total itemized deductions: $24,040 (23% of AGI, reported on 49.9% of returns)
Here:
$24,040
State:
$26,596
Here:
23.0% of AGI
State:
20.1% of AGI
(% of AGI for various income ranges: 13.0% for AGIs below $25k, 14.7% for AGIs $25k-50k, 16.8% for AGIs $50k-75k, 18.5% for AGIs $75k-100k, 18.7% for AGIs $100k-200k, 13.8% for AGIs over 200k)
Charity contributions: $4,163 (reported on 42.6% of returns)
Here:
$4,163
State:
$4,443
(% of AGI for various income ranges: 1.2% for AGIs below $25k, 1.9% for AGIs $25k-50k, 2.5% for AGIs $50k-75k, 2.9% for AGIs $75k-100k, 2.9% for AGIs $100k-200k, 2.0% for AGIs over 200k)
Taxes paid: $7,342 (reported on 49.6% of returns)
23314:
$7,342
State:
$9,951
(% of AGI for various income ranges: 2.1% for AGIs below $25k, 2.8% for AGIs $25k-50k, 4.3% for AGIs $50k-75k, 5.0% for AGIs $75k-100k, 6.2% for AGIs $100k-200k, 6.2% for AGIs over 200k)
Earned income credit: $1,988 (reported on 11.0% of returns)
Here:
$1,988
State:
$2,211
(% of AGI for various income ranges: 5.1% for AGIs below $25k, 0.8% for AGIs $25k-50k)
Percentage of individuals using paid preparers for their 2012 taxes: 40.7%
Here:
41%
State:
46%
(% for various income ranges: 36.7% for AGIs below $25k, 39.0% for AGIs $25k-50k, 40.9% for AGIs $50k-75k, 41.2% for AGIs $75k-100k, 43.0% for AGIs $100k-200k, 66.7% for AGIs over 200k)
Averages for the 2004 tax year for zip code 23314, filed in 2005:
Average Adjusted Gross Income (AGI) in 2004: $65,971 (Individual Income Tax Returns)
Here:
$65,971
State:
$56,704
Salary/wage: $50,744 (reported on 87.7% of returns)
Here:
$50,744
State:
$48,441
(% of AGI for various income ranges: 98.7% for AGIs below $10k, 76.2% for AGIs $10k-25k, 79.8% for AGIs $25k-50k, 78.1% for AGIs $50k-75k, 85.1% for AGIs $75k-100k, 49.7% for AGIs over 100k)
Taxable interest for individuals: $1,371 (reported on 56.7% of returns)
This zip code:
$1,371
Virginia:
$1,688
(% of AGI for various income ranges: 3.9% for AGIs below $10k, 2.3% for AGIs $10k-25k, 1.5% for AGIs $25k-50k, 1.6% for AGIs $50k-75k, 0.6% for AGIs $75k-100k, 1.0% for AGIs over 100k)
Taxable dividends: $1,710 (reported on 26.0% of returns)
Here:
$1,710
State:
$4,028
(% of AGI for various income ranges: 1.6% for AGIs below $10k, 1.0% for AGIs $10k-25k, 1.1% for AGIs $25k-50k, 0.9% for AGIs $50k-75k, 0.5% for AGIs $75k-100k, 0.5% for AGIs over 100k)
Net capital gain/loss: +$17,602 (reported on 20.2% of returns)
Here:
+$17,602
State:
+$14,375
(% of AGI for various income ranges: -1.5% for AGIs below $10k, 0.0% for AGIs $10k-25k, 0.6% for AGIs $25k-50k, 0.6% for AGIs $50k-75k, 1.0% for AGIs $75k-100k, 11.5% for AGIs over 100k)
Profit/loss from business: +$8,042 (reported on 13.1% of returns)
Here:
+$8,042
State:
+$13,342
(% of AGI for various income ranges: 2.0% for AGIs below $10k, 4.5% for AGIs $10k-25k, 0.7% for AGIs $25k-50k, 2.3% for AGIs $50k-75k, 1.2% for AGIs $75k-100k, 1.5% for AGIs over 100k)
IRA payment deduction: $2,975 (reported on 3.2% of returns)
23314:
$2,975
Virginia:
$2,943
Self-employed pension: $6,385 (reported on 0.5% of returns)
Here:
$6,385
Virginia:
$17,430
Total itemized deductions: $19,657 (20% of AGI, reported on 51.8% of returns)
Here:
$19,657
State:
$21,492
Here:
19.8% of AGI
State:
21.0% of AGI
(% of AGI for various income ranges: 11.3% for AGIs below $10k, 11.4% for AGIs $10k-25k, 17.1% for AGIs $25k-50k, 19.6% for AGIs $50k-75k, 19.2% for AGIs $75k-100k, 12.0% for AGIs over 100k)
Charity contributions deductions: $3,844 (4% of AGI, reported on 48.0% of returns)
Here:
$3,844
State:
$3,794
Here:
3.8% of AGI
State:
3.5% of AGI
(% of AGI for various income ranges: 2.3% for AGIs $10k-25k, 2.9% for AGIs $25k-50k, 3.1% for AGIs $50k-75k, 2.9% for AGIs $75k-100k, 2.7% for AGIs over 100k)
Total tax: $9,431 (reported on 81.5% of returns)
23314:
$9,431
State:
$9,537
(% of AGI for various income ranges: 1.8% for AGIs below $10k, 4.3% for AGIs $10k-25k, 6.5% for AGIs $25k-50k, 8.3% for AGIs $50k-75k, 9.6% for AGIs $75k-100k, 16.4% for AGIs over 100k)
Earned income credit: $1,643 (reported on 8.4% of returns)
Here:
$1,643
State:
$1,734
Percentage of individuals using paid preparers for their 2004 taxes: 45.3%
Here:
45%
State:
52%
(% for various income ranges: 35.6% for AGIs below $10k, 48.3% for AGIs $10k-25k, 47.0% for AGIs $25k-50k, 44.9% for AGIs $50k-75k, 43.9% for AGIs $75k-100k, 52.6% for AGIs over 100k)
Likely homosexual households (counted as self-reported same-sex unmarried-partner households)
Lesbian couples: 0.4% of all households
Gay men: 0.4% of all households
Household received Food Stamps/SNAP in the past 12 months: 182 Household did not receive Food Stamps/SNAP in the past 12 months: 3,510
Women who had a birth in the past 12 months: 46 (41 now married, 5 unmarried) Women who did not have a birth in the past 12 months: 1,986 (1,075 now married, 901 unmarried)
Housing units in zip code 23314 with a mortgage: 1,938 (185 second mortgage, 29 home equity loan, 136 both second mortgage and home equity loan) Houses without a mortgage: 42
Median monthly owner costs for units with a mortgage: $2,184 Median monthly owner costs for units without a mortgage: $652
Residents with income below the poverty level in 2022:
This zip code:
9.7%
Whole state:
10.6%
Residents with income below 50% of the poverty level in 2022:
This zip code:
6.8%
Whole state:
5.2%
Median number of rooms in houses and condos:
Here:
7.3
State:
7.0
Median number of rooms in apartments:
Here:
5.6
State:
4.3
Notable locations in this zip code not listed on our city pages
Notable locations in zip code 23314: Jones Creek Boat Ramp (A), Smithfield Downs Golf Course (B), Carrollton Volunteer Fire Department (C), Carrollton Public Library (D). Display/hide their locations on the map
Churches in zip code 23314 include: Riverview Church (A), Saint Lukes Church (B), Campbell Chapel (C), Faith Free Will Baptist Church (D), Macedonia Church (E), Oak Grove Church (F), Riverview United Methodist Church (G). Display/hide their locations on the map
Streams, rivers, and creeks: Brewers Creek (A), Winall Creek (B), Titus Creek (C), Smith Neck Creek (D), Ragged Island Creek (E), Creer Creek (F), Cooper Creek (G), Carrollton Branch (H), Kings Creek (I). Display/hide their locations on the map
In group quarters: 5 (-1 institutionalized population)
Size of family households: 958 2-persons, 794 3-persons, 461 4-persons, 295 5-persons, 128 6-persons, 34 7-or-more-persons
Size of nonfamily households: 916 1-person, 123 2-persons
1,816 married couples with children.
413 single-parent households (99 men, 314 women).
92.7% of residents of 23314 zip code speak English at home.
4.8% of residents speak Spanish at home (58% very well, 19% well, 23% not well).
0.8% of residents speak other Indo-European language at home (100% very well).
1.1% of residents speak Asian or Pacific Island language at home (39% very well, 51% well, 10% not well).
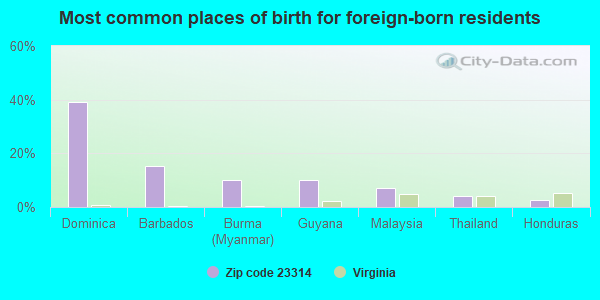
Foreign born population: 617 (6.3%) (63.5% of them are naturalized citizens)
This zip code:
6.3%
Whole state:
12.7%
39%Dominica
15%Barbados
10%Burma (Myanmar)
10%Guyana
7%Malaysia
4%Thailand
3%Honduras
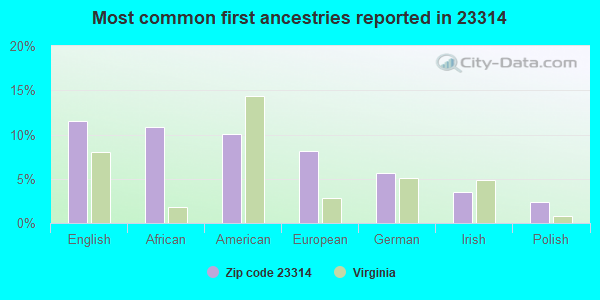
12%English
11%African
10%American
8%European
6%German
4%Irish
2%Polish
Year of entry for the foreign-born population
3762010 or later
2312000 to 2009
521990 to 1999
228Before 1990
Facilities with environmental interests located in this zip code:
CARROLLTON ELEM. (14440 NEW TOWNE HAVEN LN in CARROLLTON, VA)
(National Center for Education Statistics) - STATE ID-0460421 Organizations: ISLE OF WIGHT COUNTY PUBLIC SCHOOLS (SCHOOL DISTRICT)
BREWERS CREEK SUBDIVISION WATE (198 MARSH VIEW COURT in CARROLLTON, VA)
National Pollutant Discharge Elimination System NON-MAJOR (Tracking pollutant discharge elimination systems) - permit Business SIC classification: WATER SUPPLY Alternative names: C & P WATER COMPANIES
CAPEHART HOMES WWTP (NIKE PARK ROAD in CARROLLTON, VA)
National Pollutant Discharge Elimination System NON-MAJOR (Tracking pollutant discharge elimination systems) - permit Business SIC classification: SEWERAGE SYSTEMS Alternative names: CARROLLTON COURT, ROBERT L. MAGETTE
Housing units lacking complete plumbing facilities: 2.2% Housing units lacking complete kitchen facilities: 2.2%
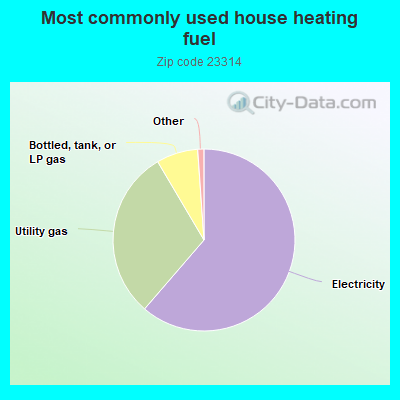
61.4%Electricity
30.2%Utility gas
7.4%Bottled, tank, or LP gas
Population in 1990: 3,990. Population change in the 1990s: +411 (+10.3%).
Place of birth for U.S.-born residents:
This state: 4,944
Northeast: 830
Midwest: 643
South: 1,849
West: 656
63% of the 23314 zip code residents lived in the same house 5 years ago. Out of people who lived in different houses, 22% lived in this county. Out of people who lived in different counties, 50% lived in Virginia.
89% of the 23314 zip code residents lived in the same house 1 year ago. Out of people who lived in different houses, 8% moved from this county. Out of people who lived in different houses, 50% moved from different county within same state. Out of people who lived in different houses, 29% moved from different state. Out of people who lived in different houses, 18% moved from abroad.
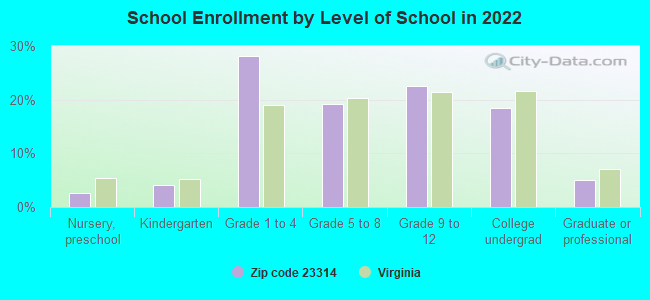
Private vs. public school enrollment:
Students in private schools in grades 1 to 8 (elementary and middle school): 299
Here:
24.0%
Virginia:
13.2%
Students in private schools in grades 9 to 12 (high school): 61
Here:
10.4%
Virginia:
10.2%
Students in private undergraduate colleges: 86
Here:
17.8%
Virginia:
18.7%
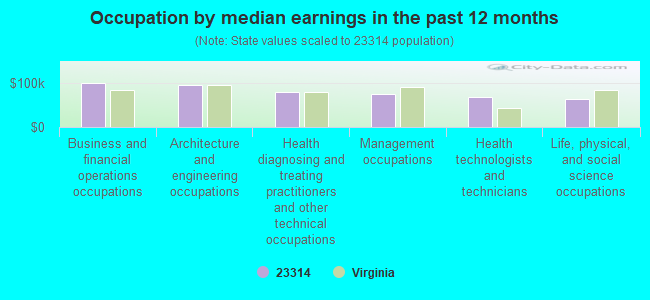
Occupation by median earnings in the past 12 months ($)
99,813Business and financial operations occupations
94,675Architecture and engineering occupations
78,363Health diagnosing and treating practitioners and other technical occupations
74,619Management occupations
67,559Health technologists and technicians
64,255Life, physical, and social science occupations
Companies with federal contracts located in this zip code:
POWELL, LESLIE MOSS (14983 ASHBY WAY EAST in CARROLLTON, VA; small business) : $63,645 in 2 contractsfrom 2003 to 2004
$96,630 with Navy for Other Medical Services. Signed on 2003-12-01. Completion date: 2004-09-30.
-$32,985, same as above.Signed on 2004-10-08. Completion date: 2004-09-30.
STUARTS MARINE (308 MARSH VIEW COURT in CARROLLTON, VA; small business) 50 employees, $0 revenue: $20,345 in 3 contractsfrom 2004 to 2005
$17,500 with Navy for Non-nuclear Ship Repair (East) Ship repair (including overhauls and conversions) performed on non-nuclear propelled and nonpropelled ships east of the 108th meridian. Signed on 2005-04-14. Completion date: 2005-05-31.
$2,382, same as above.Signed on 2004-11-05. Completion date: 2004-12-15.
$463, same as above.Signed on 2004-12-06. Completion date: 2004-12-15.
Top industries in this zip code by the number of employees in 2005:
Health Care and Social Assistance: Continuing Care Retirement Communities (20-49: 1)
Accommodation and Food Services: Full-Service Restaurants (10-19: 1, 5-9: 1)
Construction: Commercial and Institutional Building Construction (10-19: 1, 5-9: 1)
Construction: Plumbing, Heating, and Air-Conditioning Contractors (10-19: 1, 1-4: 1)
Construction: New Single-Family Housing Construction (except Operative Builders) (5-9: 1, 1-4: 5)
Construction: Highway, Street, and Bridge Construction (10-19: 1, 1-4: 1)
People in group quarters in 2010:
6 people in other noninstitutional facilities
Fatal accident statistics in 2014:
Fatal accident count: 2
Vehicles involved in fatal accidents: 3
Fatal accidents caused by drunken drivers: 0
Fatalities: 2
Persons involved in fatal accidents: 3
Pedestrians involved in fatal accidents: 0
Fatal accident statistics in 2013:
Fatal accident count: 3
Vehicles involved in fatal accidents: 4
Fatal accidents caused by drunken drivers: 0
Fatalities: 3
Persons involved in fatal accidents: 7
Pedestrians involved in fatal accidents: 0
2003 - 2018 National Fire Incident Reporting System (NFIRS) incidents
According to the data from the years 2003 - 2018 the average number of fire incidents per year is 27. The highest number of reported fires - 88 took place in 2006, and the least - 0 in 2014. The data has a rising trend.
When looking into fire subcategories, the most incidents belonged to: Outside Fires (57.5%), and Structure Fires (21.3%).
Fire incident types reported to NFIRS in Zip Code 23314
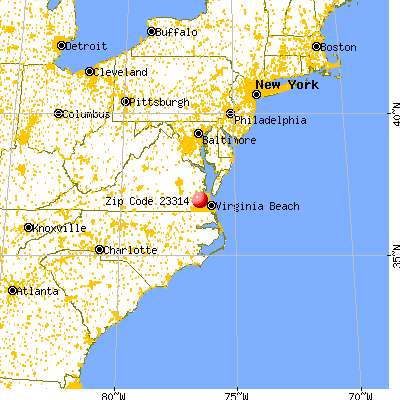


 Nearest zip codes: 23304, 23436, 23433, 23432, 23601, 23607.


 According to the data from the years 2003 - 2018 the average number of fire incidents per year is 27. The highest number of reported fires - 88 took place in 2006, and the least - 0 in 2014. The data has a rising trend.
 When looking into fire subcategories, the most incidents belonged to: Outside Fires (57.5%), and Structure Fires (21.3%).