Estimated zip code population in 2022: 2,780 Zip code population in 2010: 3,684 Zip code population in 2000: 3,767
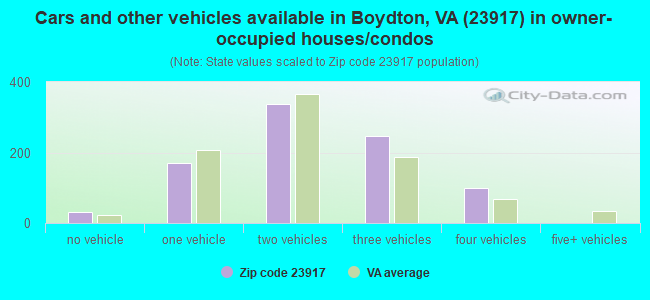
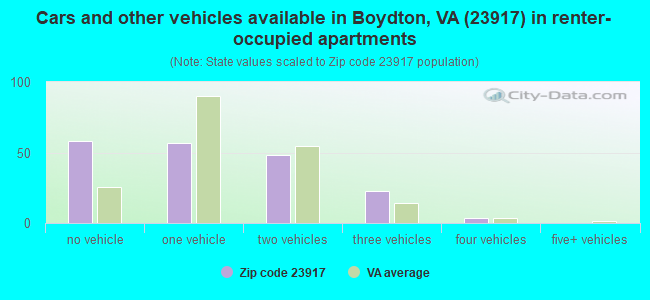
Houses and condos: 1,682 Renter-occupied apartments: 191
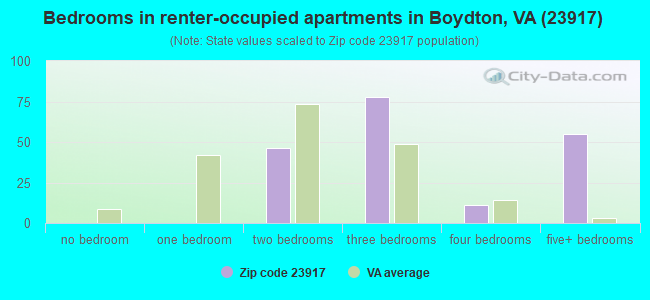
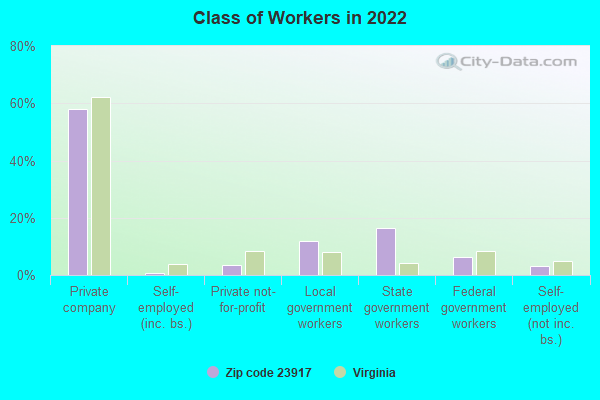
% of renters here:
18%
State:
33%
March 2022 cost of living index in zip code 23917: 82.8 (low, U.S. average is 100)
Land area: 108.5 sq. mi. Water area: 26.7 sq. mi.
Population density: 26 people per square mile
(very low).
OSM Map
General Map
Google Map
MSN Map
OSM Map
General Map
Google Map
MSN Map
OSM Map
General Map
Google Map
MSN Map
OSM Map
General Map
Google Map
MSN Map
Please wait while loading the map...
Real estate property taxes paid for housing units in 2022:
This zip code:
0.5% ($891)
Virginia:
0.7% ($2,617)
Median real estate property taxes paid for housing units with mortgages in 2022: $990 (0.5%) Median real estate property taxes paid for housing units with no mortgage in 2022: $809 (0.7%)
Business Search- 14 Million verified businesses
Males: 1,455
(52.3%)
Females: 1,325
(47.7%)
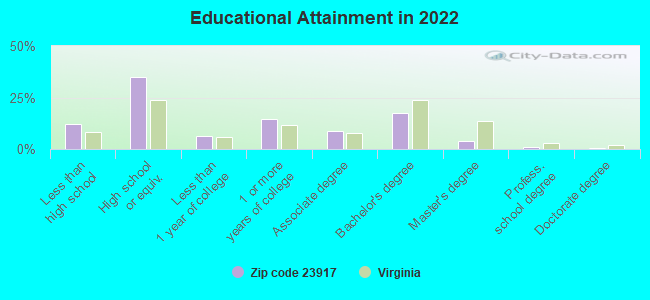
For population 25 years and over in 23917:
High school or higher: 87.1%
Bachelor's degree or higher: 22.9%
Graduate or professional degree: 5.8%
Unemployed: 2.2%
Mean travel time to work (commute): 28.9 minutes
For population 15 years and over in 23917:
Never married: 35.4%
Now married: 48.5%
Separated: 2.6%
Widowed: 6.4%
Divorced: 7.1%
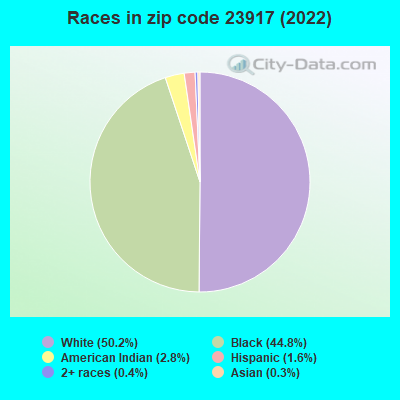
Zip code 23917 compared to state average:
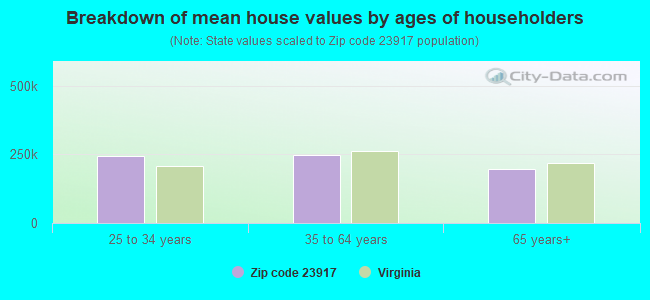
Median house value below state average.
Black race population percentage above state average.
Hispanic race population percentage significantly below state average.
Median age significantly above state average.
Foreign-born population percentage significantly below state average.
Renting percentage below state average.
Length of stay since moving in significantly above state average.
Number of college students significantly below state average.
Percentage of population with a bachelor's degree or higher below state average.
Averages for the 2020 tax year for zip code 23917, filed in 2021:
Average Adjusted Gross Income (AGI) in 2020: $60,549 (Individual Income Tax Returns)
Here:
$60,549
State:
$86,446
Salary/wage: $46,596 (reported on 79.1% of returns)
Here:
$46,596
State:
$71,185
(% of AGI for various income ranges: 1289.4% for AGIs below $25k, 3453.3% for AGIs $25k-50k, 6452.7% for AGIs $50k-75k, 9188.6% for AGIs $75k-100k, 13614.4% for AGIs $100k-200k)
Taxable interest for individuals: $1,238 (reported on 31.0% of returns)
This zip code:
$1,238
Virginia:
$1,805
(% of AGI for various income ranges: 5.3% for AGIs below $25k, 18.9% for AGIs $25k-50k, 58.2% for AGIs $50k-75k, 85.7% for AGIs $75k-100k, 258.9% for AGIs $100k-200k)
Ordinary dividends: $7,860 (reported on 19.4% of returns)
Here:
$7,860
State:
$8,327
(% of AGI for various income ranges: 19.7% for AGIs below $25k, 36.7% for AGIs $25k-50k, 159.1% for AGIs $50k-75k, 335.7% for AGIs $75k-100k, 772.2% for AGIs $100k-200k)
Net capital gain/loss in AGI: +$15,055 (reported on 15.5% of returns)
Here:
+$15,055
State:
+$24,644
(% of AGI for various income ranges: 21.8% for AGIs below $25k, 232.7% for AGIs $50k-75k, 125.7% for AGIs $75k-100k, 651.1% for AGIs $100k-200k)
Profit/loss from business: +$6,400 (reported on 13.2% of returns)
Here:
+$6,400
State:
+$12,836
(% of AGI for various income ranges: 57.4% for AGIs below $25k, 83.7% for AGIs $25k-50k, 130.9% for AGIs $50k-75k, 581.1% for AGIs $100k-200k)
Taxable individual retirement arrangement distribution: $18,940 (reported on 11.6% of returns)
23917:
$18,940
Virginia:
$21,535
(% of AGI for various income ranges: 57.4% for AGIs below $25k, 115.9% for AGIs $25k-50k, 561.8% for AGIs $50k-75k, 1905.6% for AGIs $100k-200k)
Total itemized deductions: $31,570 (reported on 7.8% of returns)
Here:
$31,570
State:
$33,287
(% of AGI for various income ranges: 205.0% for AGIs below $25k, 977.3% for AGIs $50k-75k, 1538.9% for AGIs $100k-200k)
Charity contributions: $7,611 (reported on 7.0% of returns)
Here:
$7,611
State:
$10,381
(% of AGI for various income ranges: 41.2% for AGIs below $25k, 207.3% for AGIs $50k-75k, 352.2% for AGIs $100k-200k)
Taxes paid: $5,680 (reported on 7.8% of returns)
23917:
$5,680
State:
$8,284
(% of AGI for various income ranges: 14.1% for AGIs below $25k, 158.2% for AGIs $50k-75k, 384.4% for AGIs $100k-200k)
Earned income credit: $2,135 (reported on 20.2% of returns)
Here:
$2,135
State:
$2,214
(% of AGI for various income ranges: 107.4% for AGIs below $25k, 70.4% for AGIs $25k-50k)
Percentage of individuals using paid preparers for their 2020 taxes: 89.9%
Here:
90%
State:
92%
(% for various income ranges: 86.7% for AGIs below $25k, 91.2% for AGIs $25k-50k, 88.9% for AGIs $50k-75k, 91.7% for AGIs $75k-100k, 93.8% for AGIs $100k-200k, 100.0% for AGIs over 200k)
Averages for the 2012 tax year for zip code 23917, filed in 2013:
Average Adjusted Gross Income (AGI) in 2012: $42,989 (Individual Income Tax Returns)
Here:
$42,989
State:
$71,192
Salary/wage: $36,062 (reported on 81.2% of returns)
Here:
$36,062
State:
$59,229
(% of AGI for various income ranges: 80.8% for AGIs below $25k, 75.9% for AGIs $25k-50k, 63.9% for AGIs $50k-75k, 60.7% for AGIs $75k-100k, 63.3% for AGIs $100k-200k)
Taxable interest for individuals: $1,541 (reported on 31.6% of returns)
This zip code:
$1,541
Virginia:
$1,600
(% of AGI for various income ranges: 1.0% for AGIs below $25k, 0.9% for AGIs $25k-50k, 1.2% for AGIs $50k-75k, 1.2% for AGIs $75k-100k, 1.3% for AGIs $100k-200k)
Ordinary dividends: $5,450 (reported on 18.8% of returns)
Here:
$5,450
State:
$6,959
(% of AGI for various income ranges: 0.3% for AGIs below $25k, 1.0% for AGIs $25k-50k, 2.6% for AGIs $50k-75k, 3.2% for AGIs $75k-100k, 3.8% for AGIs $100k-200k)
Net capital gain/loss in AGI: +$1,853 (reported on 12.8% of returns)
Here:
+$1,853
State:
+$16,672
(% of AGI for various income ranges: 1.9% for AGIs $50k-75k, 0.3% for AGIs $75k-100k, 0.8% for AGIs $100k-200k)
Profit/loss from business: +$4,246 (reported on 11.1% of returns)
Here:
+$4,246
State:
+$14,116
(% of AGI for various income ranges: 2.3% for AGIs below $25k, 1.4% for AGIs $25k-50k, 0.5% for AGIs $50k-75k, 1.3% for AGIs $100k-200k)
Taxable individual retirement arrangement distribution: $12,823 (reported on 11.1% of returns)
23917:
$12,823
Virginia:
$16,667
(% of AGI for various income ranges: 3.4% for AGIs below $25k, 2.9% for AGIs $25k-50k, 2.4% for AGIs $50k-75k, 3.0% for AGIs $75k-100k, 4.5% for AGIs $100k-200k)
Total itemized deductions: $20,300 (26% of AGI, reported on 25.6% of returns)
Here:
$20,300
State:
$26,596
Here:
26.1% of AGI
State:
20.1% of AGI
(% of AGI for various income ranges: 7.5% for AGIs below $25k, 12.5% for AGIs $25k-50k, 10.6% for AGIs $50k-75k, 12.4% for AGIs $75k-100k, 14.8% for AGIs $100k-200k)
Charity contributions: $3,364 (reported on 21.4% of returns)
Here:
$3,364
State:
$4,443
(% of AGI for various income ranges: 0.8% for AGIs below $25k, 1.6% for AGIs $25k-50k, 1.4% for AGIs $50k-75k, 1.5% for AGIs $75k-100k, 2.4% for AGIs $100k-200k)
Taxes paid: $5,423 (reported on 25.6% of returns)
23917:
$5,423
State:
$9,951
(% of AGI for various income ranges: 0.8% for AGIs below $25k, 1.8% for AGIs $25k-50k, 2.2% for AGIs $50k-75k, 3.5% for AGIs $75k-100k, 6.0% for AGIs $100k-200k)
Earned income credit: $2,181 (reported on 26.5% of returns)
Here:
$2,181
State:
$2,211
(% of AGI for various income ranges: 7.4% for AGIs below $25k, 1.6% for AGIs $25k-50k)
Percentage of individuals using paid preparers for their 2012 taxes: 52.1%
Here:
52%
State:
46%
(% for various income ranges: 45.1% for AGIs below $25k, 48.5% for AGIs $25k-50k, 60.0% for AGIs $50k-75k, 70.0% for AGIs $75k-100k, 75.0% for AGIs $100k-200k)
Averages for the 2004 tax year for zip code 23917, filed in 2005:
Average Adjusted Gross Income (AGI) in 2004: $35,309 (Individual Income Tax Returns)
Here:
$35,309
State:
$56,704
Salary/wage: $30,359 (reported on 83.0% of returns)
Here:
$30,359
State:
$48,441
(% of AGI for various income ranges: 109.2% for AGIs below $10k, 81.4% for AGIs $10k-25k, 75.2% for AGIs $25k-50k, 72.4% for AGIs $50k-75k, 65.7% for AGIs $75k-100k, 59.9% for AGIs over 100k)
Taxable interest for individuals: $1,794 (reported on 35.0% of returns)
This zip code:
$1,794
Virginia:
$1,688
(% of AGI for various income ranges: 1.9% for AGIs below $10k, 1.2% for AGIs $10k-25k, 1.3% for AGIs $25k-50k, 2.3% for AGIs $50k-75k, 2.2% for AGIs $75k-100k, 2.0% for AGIs over 100k)
Taxable dividends: $5,955 (reported on 16.6% of returns)
Here:
$5,955
State:
$4,028
(% of AGI for various income ranges: 1.6% for AGIs below $10k, 1.0% for AGIs $10k-25k, 1.0% for AGIs $25k-50k, 2.0% for AGIs $50k-75k, 4.4% for AGIs $75k-100k, 5.6% for AGIs over 100k)
Net capital gain/loss: +$5,035 (reported on 14.0% of returns)
Here:
+$5,035
State:
+$14,375
(% of AGI for various income ranges: -1.1% for AGIs below $10k, 0.4% for AGIs $10k-25k, 0.6% for AGIs $25k-50k, 0.3% for AGIs $50k-75k, 2.0% for AGIs $75k-100k, 6.1% for AGIs over 100k)
Profit/loss from business: +$2,858 (reported on 10.4% of returns)
Here:
+$2,858
State:
+$13,342
(% of AGI for various income ranges: 6.3% for AGIs below $10k, 1.9% for AGIs $10k-25k, 0.7% for AGIs $25k-50k, 1.2% for AGIs $50k-75k, -0.0% for AGIs over 100k)
IRA payment deduction: $2,967 (reported on 2.5% of returns)
23917:
$2,967
Virginia:
$2,943
Total itemized deductions: $15,878 (22% of AGI, reported on 23.5% of returns)
Here:
$15,878
State:
$21,492
Here:
22.1% of AGI
State:
21.0% of AGI
(% of AGI for various income ranges: 6.4% for AGIs $10k-25k, 11.7% for AGIs $25k-50k, 12.1% for AGIs $50k-75k, 9.6% for AGIs $75k-100k, 12.6% for AGIs over 100k)
Charity contributions deductions: $3,220 (4% of AGI, reported on 20.5% of returns)
Here:
$3,220
State:
$3,794
Here:
4.4% of AGI
State:
3.5% of AGI
(% of AGI for various income ranges: 0.9% for AGIs $10k-25k, 1.7% for AGIs $25k-50k, 2.7% for AGIs $50k-75k, 1.6% for AGIs $75k-100k, 2.3% for AGIs over 100k)
Total tax: $4,865 (reported on 66.7% of returns)
23917:
$4,865
State:
$9,537
(% of AGI for various income ranges: 2.2% for AGIs below $10k, 2.9% for AGIs $10k-25k, 6.1% for AGIs $25k-50k, 8.4% for AGIs $50k-75k, 11.1% for AGIs $75k-100k, 16.7% for AGIs over 100k)
Earned income credit: $1,950 (reported on 26.1% of returns)
Here:
$1,950
State:
$1,734
Percentage of individuals using paid preparers for their 2004 taxes: 61.5%
Here:
62%
State:
52%
(% for various income ranges: 52.1% for AGIs below $10k, 65.6% for AGIs $10k-25k, 60.9% for AGIs $25k-50k, 57.4% for AGIs $50k-75k, 70.8% for AGIs $75k-100k, 72.6% for AGIs over 100k)
Household received Food Stamps/SNAP in the past 12 months: 118 Household did not receive Food Stamps/SNAP in the past 12 months: 960
Women who had a birth in the past 12 months: 77 (52 now married, 24 unmarried) Women who did not have a birth in the past 12 months: 446 (126 now married, 323 unmarried)
Housing units in zip code 23917 with a mortgage: 475 (47 second mortgage, 40 both second mortgage and home equity loan) Median monthly owner costs for units with a mortgage: $1,167 Median monthly owner costs for units without a mortgage: $424
Residents with income below the poverty level in 2022:
This zip code:
14.9%
Whole state:
10.6%
Residents with income below 50% of the poverty level in 2022:
This zip code:
4.4%
Whole state:
5.2%
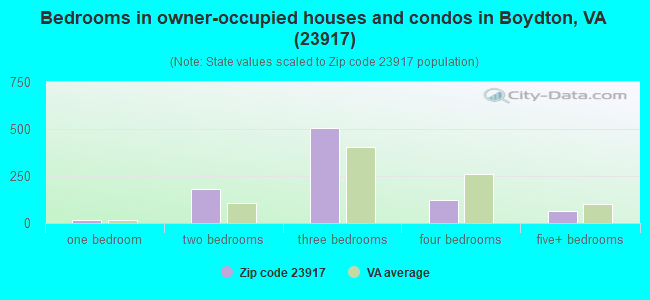
Median number of rooms in houses and condos:
Here:
6.2
State:
7.0
Median number of rooms in apartments:
Here:
6.5
State:
4.3
Notable locations in this zip code not listed on our city pages
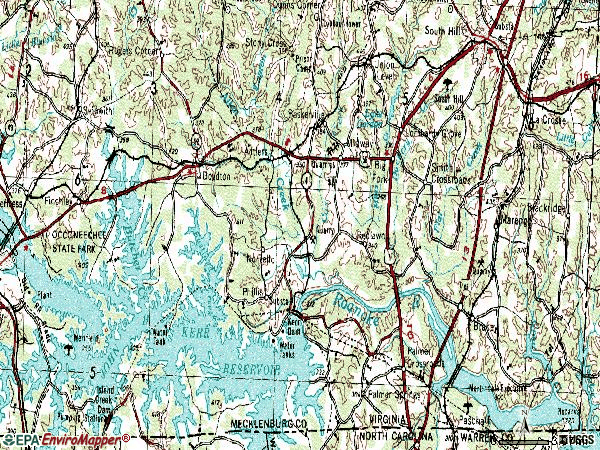
Notable locations in zip code 23917: Palmer Point Marina (A), Eastland Creek Landing (B), Eagle Point Boat Ramp (C), Clarksville Overlook (D), Elm Hill Plantation (E), Kerr Dam Overlook (F), Kerr Reservoir Management Center (G), Mecklenburg Correctional Center (H), North Bend Park Marina (I), Mecklenburg County Courthouse (J), Mecklenburg County Sheriff's Office (K). Display/hide their locations on the map
Churches in zip code 23917 include: Rehoboth Church (A), Roanoke Chapel (B), Bethesda Church (C), Saint Douglas Church (D), Saint Marks Church (E), Saint Pauls Church (F), Shiloh Church (G), Easter Church (H), Ebenezer Church (I). Display/hide their locations on the map
Cemeteries: Grace Cemetery (1), Fields Cemetery (2), Ebenezer Cemetery (3), Easters Cemetery (4), Bethesda Cemetery (5), Saint Pauls Cemetery (6), Union Chapel Cemetery (7). Display/hide their locations on the map
Streams, rivers, and creeks: Wall Branch (A), Tates Branch (B), Smith Creek (C), Rudd Branch (D), Rocky Branch (E), Robbins Creek (F), Reedy Branch (G), Peckerwood Branch (H), Panhandle Creek (I). Display/hide their locations on the map
Parks in zip code 23917 include: North Bend Public Use Area (1), Elm Hill State Game Management Area (2), Aurora Park (3), Eagle Point Wildlife Management Area (4), Lower Butchers Wildlife Management Area (5), Oakleaf Wildlife Management Area (6), Palmer Point Park (7), Rochichi Wildlife Management Area (8), Tailrace Park (9). Display/hide their locations on the map
203 married couples with children.
151 single-parent households (46 men, 105 women).
98.4% of residents of 23917 zip code speak English at home.
1.1% of residents speak Spanish at home (55% very well, 45% not well).
0.2% of residents speak Asian or Pacific Island language at home (50% very well, 50% not well).
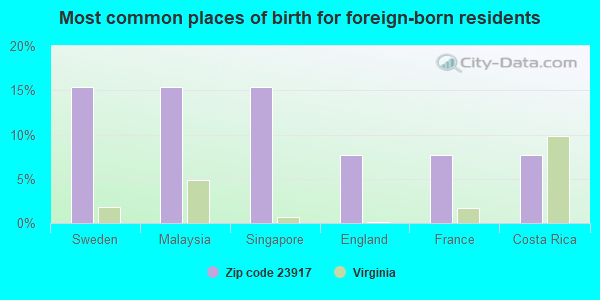
Foreign born population: 13 (0.5%) (86.0% of them are naturalized citizens)
This zip code:
0.5%
Whole state:
12.7%
15%Sweden
15%Malaysia
15%Singapore
8%England
8%France
8%Costa Rica
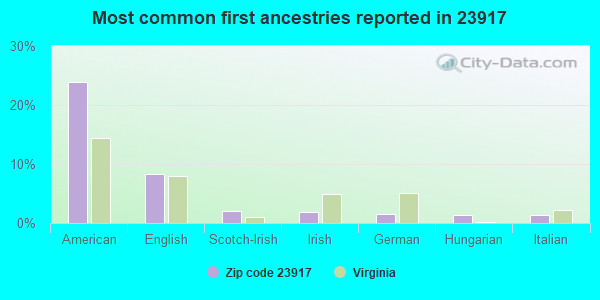
24%American
8%English
2%Scotch-Irish
2%Irish
2%German
1%Hungarian
1%Italian
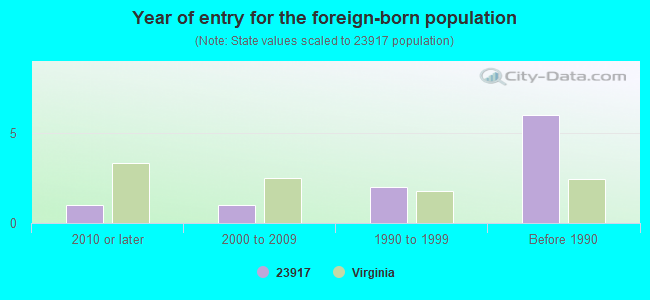
Year of entry for the foreign-born population
12010 or later
12000 to 2009
21990 to 1999
6Before 1990
Facilities with environmental interests located in this zip code:
BOYDTON WWTP (950 CARTER LN in BOYDTON, VA)
National Pollutant Discharge Elimination System NON-MAJOR (Tracking pollutant discharge elimination systems) - permit Business SIC classification: SEWERAGE SYSTEMS Alternative names: BOYDTON STF
Housing units lacking complete plumbing facilities: 5.5% Housing units lacking complete kitchen facilities: 4.7%
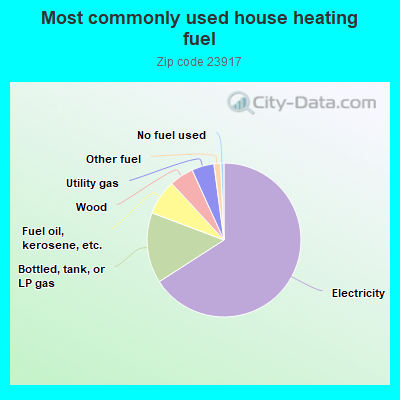
66.1%Electricity
14.9%Bottled, tank, or LP gas
7.4%Fuel oil, kerosene, etc.
5.1%Wood
4.7%Utility gas
1.4%Other fuel
0.7%No fuel used
Population in 1990: 2,613. Population change in the 1990s: +1,154 (+44.2%).
Place of birth for U.S.-born residents:
This state: 1,725
Northeast: 412
Midwest: 43
South: 529
West: 46
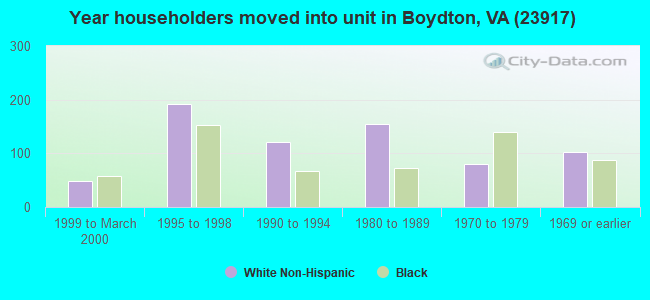
56% of the 23917 zip code residents lived in the same house 5 years ago. Out of people who lived in different houses, 50% lived in this county. Out of people who lived in different counties, 50% lived in Virginia.
95% of the 23917 zip code residents lived in the same house 1 year ago. Out of people who lived in different houses, 12% moved from this county. Out of people who lived in different houses, 53% moved from different county within same state. Out of people who lived in different houses, 47% moved from different state.
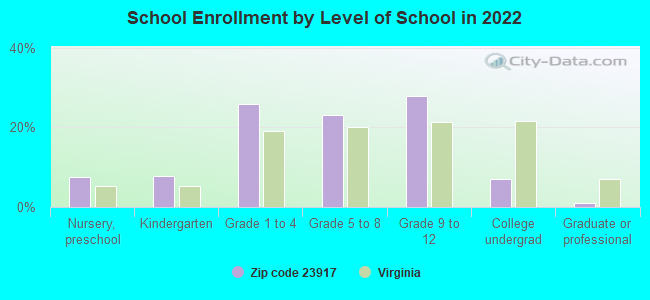
Private vs. public school enrollment:
Students in private schools in grades 1 to 8 (elementary and middle school): 8
Here:
4.0%
Virginia:
13.2%
Students in private schools in grades 9 to 12 (high school): 3
Here:
2.6%
Virginia:
10.2%
Students in private undergraduate colleges:
Here:
0.0%
Virginia:
18.7%
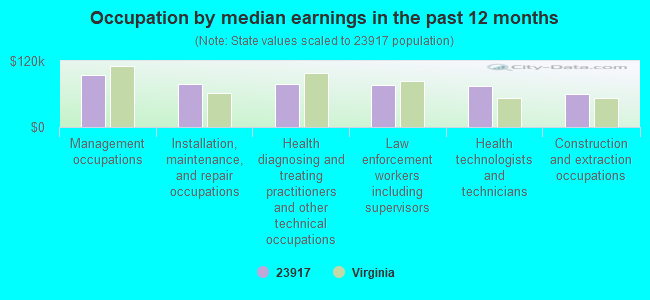
Occupation by median earnings in the past 12 months ($)
95,360Management occupations
78,467Installation, maintenance, and repair occupations
77,893Health diagnosing and treating practitioners and other technical occupations
76,697Law enforcement workers including supervisors
74,088Health technologists and technicians
59,638Construction and extraction occupations
Companies with federal contracts located in this zip code:
MECKLENBURG COUNTY SHERIFFS OF (251 MONROE ST in BOYDTON, VA; small business) : $371,368 in 10 contractsfrom 2000 to 2006
Contracts for Other Professional Services, Guard Services by Army, U.S. Army Corps of Engineers - civil program financing only Signed by year:2000: $37,040; 2001: $36,480; 2002: $39,512; 2003: $39,560; 2004: $90,704; 2005: $85,584; 2006: $42,488.
Biggest contracts:
$45,352 with Army for Other Professional Services. Taking place in NC. Signed on 2004-02-17. Completion date: 2004-04-02.
$45,352 with U.S. Army Corps of Engineers - civil program financing only for Other Professional Services. Taking place in NC. Signed on 2004-02-17. Completion date: 2004-04-02.
$42,792 with U.S. Army Corps of Engineers - civil program financing only for Other Professional Services. Signed on 2005-03-24. Completion date: 2005-04-01.
$42,792 with Army for Other Professional Services. Signed on 2005-03-24. Completion date: 2005-04-01.
LOCKE, MARGARET (541 ROCHICHI DR in BOYDTON, VA; small business)
$13,664 with Army for Guard Services. Signed on 2006-03-27. Completion date: 2006-12-31.
WATSON AND NELSON PC (89 BANK ST P O DRAWER 310 in BOYDTON, VA; small business) : -$500 in 2 contractsin 2004
$0 with Army for Legal Services. Taking place in GA. Signed on 2004-02-23. Completion date: 1999-09-30.
-$500, same as above.Signed on 2004-02-23. Completion date: 1999-09-30.
Top industries in this zip code by the number of employees in 2005:
Health Care and Social Assistance: All Other Outpatient Care Centers (20-49 employees: 1 establishment)
Construction: Site Preparation Contractors (10-19: 1, 1-4: 1)
Administrative and Support and Waste Management and Remediation Services: Facilities Support Services (10-19: 1)
Wholesale Trade: Petroleum and Petroleum Products Merchant Wholesalers (except Bulk Stations and Terminals) (10-19: 1)
Health Care and Social Assistance: Offices of Physicians (except Mental Health Specialists) (5-9: 1)
People in group quarters in 2010:
718 people in state prisons
129 people in local jails and other municipal confinement facilities
35 people in group homes intended for adults
People in group quarters in 2000:
699 people in federal prisons and detention centers
105 people in local jails and other confinement facilities (including police lockups)
43 people in other noninstitutional group quarters
Fatal accident statistics in 2014:
Fatal accident count: 2
Vehicles involved in fatal accidents: 3
Fatal accidents caused by drunken drivers: 0
Fatalities: 2
Persons involved in fatal accidents: 3
Pedestrians involved in fatal accidents: 0
Fatal accident statistics in 2013:
Fatal accident count: 1
Vehicles involved in fatal accidents: 1
Fatal accidents caused by drunken drivers: 0
Fatalities: 1
Persons involved in fatal accidents: 9
Pedestrians involved in fatal accidents: 0
2002 - 2018 National Fire Incident Reporting System (NFIRS) incidents
Based on the data from the years 2002 - 2018 the average number of fires per year is 32. The highest number of fires - 49 took place in 2011, and the least - 2 in 2002. The data has a growing trend.
When looking into fire subcategories, the most reports belonged to: Structure Fires (45.2%), and Outside Fires (40.1%).
Fire incident types reported to NFIRS in Zip Code 23917


 Nearest zip codes: 23915, 27553, 23970, 23924, 23968, 23919.


 Based on the data from the years 2002 - 2018 the average number of fires per year is 32. The highest number of fires - 49 took place in 2011, and the least - 2 in 2002. The data has a growing trend.
 When looking into fire subcategories, the most reports belonged to: Structure Fires (45.2%), and Outside Fires (40.1%).