Estimated zip code population in 2022: 1,555 Zip code population in 2010: 1,363 Zip code population in 2000: 1,230
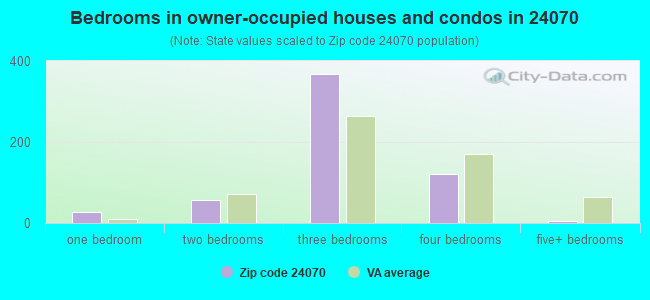
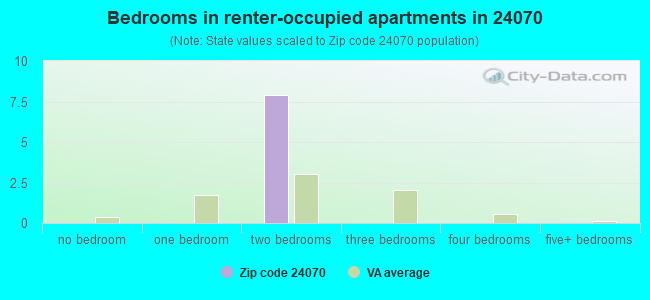
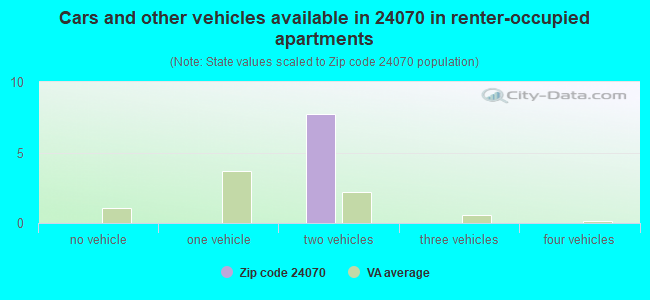
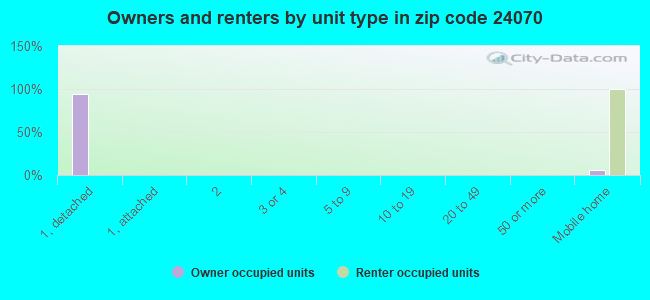
Houses and condos: 734 Renter-occupied apartments: 8
% of renters here:
1%
State:
33%
March 2022 cost of living index in zip code 24070: 82.5 (low, U.S. average is 100)
Land area: 57.8 sq. mi. Water area: 0.1 sq. mi.
Population density: 27 people per square mile
(very low).
OSM Map
General Map
Google Map
MSN Map
OSM Map
General Map
Google Map
MSN Map
OSM Map
General Map
Google Map
MSN Map
OSM Map
General Map
Google Map
MSN Map
Please wait while loading the map...
Real estate property taxes paid for housing units in 2022:
This zip code:
0.8% ($1,857)
Virginia:
0.7% ($2,617)
Median real estate property taxes paid for housing units with mortgages in 2022: $1,916 (0.7%) Median real estate property taxes paid for housing units with no mortgage in 2022: $1,878 (1.0%)
Business Search- 14 Million verified businesses
Males: 824
(53.0%)
Females: 730
(47.0%)
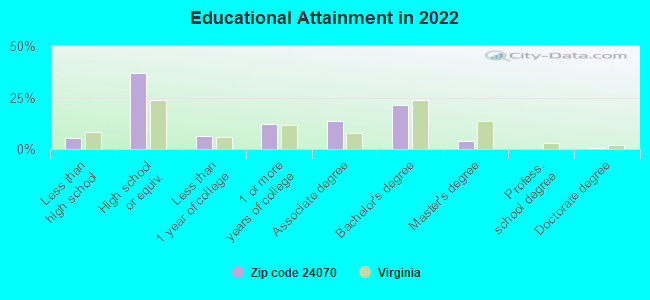
For population 25 years and over in 24070:
High school or higher: 93.3%
Bachelor's degree or higher: 25.4%
Graduate or professional degree: 4.5%
Mean travel time to work (commute): 29.4 minutes
For population 15 years and over in 24070:
Never married: 9.1%
Now married: 67.1%
Separated: 6.6%
Widowed: 11.4%
Divorced: 5.9%
Zip code 24070 compared to state average:
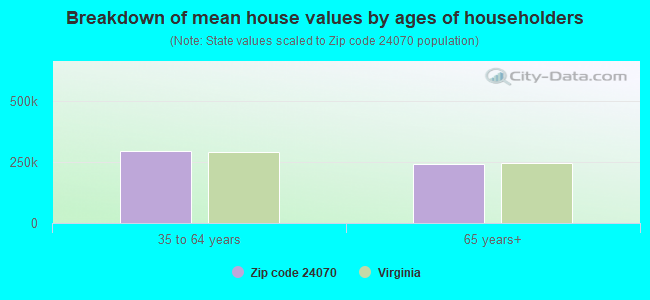
Median house value below state average.
Unemployed percentage significantly below state average.
Black race population percentage below state average.
Hispanic race population percentage significantly below state average.
Median age significantly above state average.
Foreign-born population percentage significantly below state average.
Renting percentage significantly below state average.
Length of stay since moving in significantly above state average.
Averages for the 2020 tax year for zip code 24070, filed in 2021:
Average Adjusted Gross Income (AGI) in 2020: $69,199 (Individual Income Tax Returns)
Here:
$69,199
State:
$86,446
Salary/wage: $63,106 (reported on 79.1% of returns)
Here:
$63,106
State:
$71,185
(% of AGI for various income ranges: 963.6% for AGIs below $25k, 3581.4% for AGIs $25k-50k, 6222.9% for AGIs $50k-75k, 10934.0% for AGIs $75k-100k, 13083.8% for AGIs $100k-200k)
Taxable interest for individuals: $943 (reported on 41.8% of returns)
This zip code:
$943
Virginia:
$1,805
(% of AGI for various income ranges: 26.4% for AGIs below $25k, 29.3% for AGIs $25k-50k, 35.7% for AGIs $50k-75k, 30.0% for AGIs $75k-100k, 177.5% for AGIs $100k-200k)
Ordinary dividends: $3,693 (reported on 22.4% of returns)
Here:
$3,693
State:
$8,327
(% of AGI for various income ranges: 81.4% for AGIs $25k-50k, 135.7% for AGIs $50k-75k, 100.0% for AGIs $75k-100k, 170.0% for AGIs $100k-200k)
Net capital gain/loss in AGI: +$6,958 (reported on 17.9% of returns)
Here:
+$6,958
State:
+$24,644
(% of AGI for various income ranges: 378.6% for AGIs $50k-75k, 713.8% for AGIs $100k-200k)
Profit/loss from business: +$7,511 (reported on 13.4% of returns)
Here:
+$7,511
State:
+$12,836
(% of AGI for various income ranges: 116.4% for AGIs $25k-50k, 1026.0% for AGIs $75k-100k)
Taxable individual retirement arrangement distribution: $19,425 (reported on 11.9% of returns)
24070:
$19,425
Virginia:
$21,535
(% of AGI for various income ranges: 201.8% for AGIs below $25k, 574.3% for AGIs $50k-75k, 1162.5% for AGIs $100k-200k)
Total itemized deductions: $36,600 (reported on 7.5% of returns)
Here:
$36,600
State:
$33,287
(% of AGI for various income ranges: 467.9% for AGIs $25k-50k, 1468.8% for AGIs $100k-200k)
Charity contributions: $11,800 (reported on 7.5% of returns)
Here:
$11,800
State:
$10,381
(% of AGI for various income ranges: 737.5% for AGIs $100k-200k)
Taxes paid: $8,480 (reported on 7.5% of returns)
24070:
$8,480
State:
$8,284
(% of AGI for various income ranges: 88.6% for AGIs $25k-50k, 375.0% for AGIs $100k-200k)
Earned income credit: $1,562 (reported on 11.9% of returns)
Here:
$1,562
State:
$2,214
(% of AGI for various income ranges: 55.5% for AGIs below $25k, 45.7% for AGIs $25k-50k)
Percentage of individuals using paid preparers for their 2020 taxes: 91.0%
Here:
91%
State:
92%
(% for various income ranges: 88.2% for AGIs below $25k, 88.9% for AGIs $25k-50k, 100.0% for AGIs $50k-75k, 87.5% for AGIs $75k-100k, 100.0% for AGIs $100k-200k, 75.0% for AGIs over 200k)
Averages for the 2012 tax year for zip code 24070, filed in 2013:
Average Adjusted Gross Income (AGI) in 2012: $54,326 (Individual Income Tax Returns)
Here:
$54,326
State:
$71,192
Salary/wage: $47,319 (reported on 85.5% of returns)
Here:
$47,319
State:
$59,229
(% of AGI for various income ranges: 80.0% for AGIs below $25k, 73.4% for AGIs $25k-50k, 74.3% for AGIs $50k-75k, 77.8% for AGIs $75k-100k, 72.3% for AGIs $100k-200k)
Taxable interest for individuals: $517 (reported on 42.0% of returns)
This zip code:
$517
Virginia:
$1,600
(% of AGI for various income ranges: 0.8% for AGIs below $25k, 0.5% for AGIs $25k-50k, 0.2% for AGIs $50k-75k, 0.3% for AGIs $75k-100k, 0.4% for AGIs $100k-200k)
Ordinary dividends: $3,531 (reported on 23.2% of returns)
Here:
$3,531
State:
$6,959
(% of AGI for various income ranges: 1.6% for AGIs below $25k, 0.8% for AGIs $25k-50k, 0.9% for AGIs $50k-75k, 0.6% for AGIs $75k-100k, 2.5% for AGIs $100k-200k)
Net capital gain/loss in AGI: +$2,167 (reported on 13.0% of returns)
Here:
+$2,167
State:
+$16,672
(% of AGI for various income ranges: 1.4% for AGIs $100k-200k)
Profit/loss from business: +$11,156 (reported on 13.0% of returns)
Here:
+$11,156
State:
+$14,116
(% of AGI for various income ranges: 13.0% for AGIs below $25k, 2.1% for AGIs $50k-75k, 3.4% for AGIs $100k-200k)
Taxable individual retirement arrangement distribution: $14,412 (reported on 11.6% of returns)
24070:
$14,412
Virginia:
$16,667
(% of AGI for various income ranges: 8.1% for AGIs below $25k, 5.2% for AGIs $50k-75k, 7.9% for AGIs $75k-100k)
Total itemized deductions: $20,480 (23% of AGI, reported on 36.2% of returns)
Here:
$20,480
State:
$26,596
Here:
22.6% of AGI
State:
20.1% of AGI
(% of AGI for various income ranges: 18.5% for AGIs $25k-50k, 12.5% for AGIs $50k-75k, 12.4% for AGIs $75k-100k, 15.4% for AGIs $100k-200k)
Charity contributions: $4,550 (reported on 29.0% of returns)
Here:
$4,550
State:
$4,443
(% of AGI for various income ranges: 1.6% for AGIs $25k-50k, 1.9% for AGIs $50k-75k, 1.3% for AGIs $75k-100k, 4.1% for AGIs $100k-200k)
Taxes paid: $6,920 (reported on 36.2% of returns)
24070:
$6,920
State:
$9,951
(% of AGI for various income ranges: 3.2% for AGIs $25k-50k, 3.8% for AGIs $50k-75k, 4.6% for AGIs $75k-100k, 6.5% for AGIs $100k-200k)
Earned income credit: $2,150 (reported on 11.6% of returns)
Here:
$2,150
State:
$2,211
(% of AGI for various income ranges: 4.1% for AGIs below $25k, 0.9% for AGIs $25k-50k)
Percentage of individuals using paid preparers for their 2012 taxes: 49.3%
Here:
49%
State:
46%
(% for various income ranges: 39.1% for AGIs below $25k, 50.0% for AGIs $25k-50k, 54.5% for AGIs $50k-75k, 62.5% for AGIs $75k-100k, 55.6% for AGIs $100k-200k)
Averages for the 2004 tax year for zip code 24070, filed in 2005:
Average Adjusted Gross Income (AGI) in 2004: $46,311 (Individual Income Tax Returns)
Here:
$46,311
State:
$56,704
Salary/wage: $42,753 (reported on 88.1% of returns)
Here:
$42,753
State:
$48,441
(% of AGI for various income ranges: 101.4% for AGIs below $10k, 80.1% for AGIs $10k-25k, 80.7% for AGIs $25k-50k, 86.2% for AGIs $50k-75k, 85.3% for AGIs $75k-100k, 74.5% for AGIs over 100k)
Taxable interest for individuals: $1,042 (reported on 49.3% of returns)
This zip code:
$1,042
Virginia:
$1,688
(% of AGI for various income ranges: 6.7% for AGIs below $10k, 2.2% for AGIs $10k-25k, 1.2% for AGIs $25k-50k, 0.8% for AGIs $50k-75k, 1.6% for AGIs $75k-100k, 0.3% for AGIs over 100k)
Taxable dividends: $2,242 (reported on 22.8% of returns)
Here:
$2,242
State:
$4,028
(% of AGI for various income ranges: 0.7% for AGIs below $10k, 0.7% for AGIs $10k-25k, 0.5% for AGIs $25k-50k, 0.5% for AGIs $50k-75k, 0.7% for AGIs $75k-100k, 2.5% for AGIs over 100k)
Net capital gain/loss: +$5,624 (reported on 15.1% of returns)
Here:
+$5,624
State:
+$14,375
(% of AGI for various income ranges: 0.5% for AGIs $25k-50k, -0.1% for AGIs $50k-75k, 1.6% for AGIs $75k-100k, 5.3% for AGIs over 100k)
Profit/loss from business: +$10,038 (reported on 15.5% of returns)
Here:
+$10,038
State:
+$13,342
(% of AGI for various income ranges: 11.0% for AGIs below $10k, 4.9% for AGIs $10k-25k, 2.8% for AGIs $25k-50k, 2.8% for AGIs $50k-75k, 0.1% for AGIs $75k-100k, 5.5% for AGIs over 100k)
IRA payment deduction: $2,611 (reported on 2.7% of returns)
24070:
$2,611
Virginia:
$2,943
Total itemized deductions: $17,065 (21% of AGI, reported on 34.4% of returns)
Here:
$17,065
State:
$21,492
Here:
21.4% of AGI
State:
21.0% of AGI
(% of AGI for various income ranges: 12.2% for AGIs $10k-25k, 10.6% for AGIs $25k-50k, 12.6% for AGIs $50k-75k, 13.3% for AGIs $75k-100k, 14.9% for AGIs over 100k)
Charity contributions deductions: $3,428 (4% of AGI, reported on 28.9% of returns)
Here:
$3,428
State:
$3,794
Here:
4.1% of AGI
State:
3.5% of AGI
(% of AGI for various income ranges: 1.3% for AGIs $10k-25k, 1.4% for AGIs $25k-50k, 2.5% for AGIs $50k-75k, 1.9% for AGIs $75k-100k, 3.0% for AGIs over 100k)
Total tax: $6,200 (reported on 81.2% of returns)
24070:
$6,200
State:
$9,537
(% of AGI for various income ranges: 3.1% for AGIs below $10k, 5.0% for AGIs $10k-25k, 6.5% for AGIs $25k-50k, 8.5% for AGIs $50k-75k, 10.4% for AGIs $75k-100k, 19.0% for AGIs over 100k)
Earned income credit: $1,408 (reported on 10.6% of returns)
Here:
$1,408
State:
$1,734
Percentage of individuals using paid preparers for their 2004 taxes: 49.3%
Here:
49%
State:
52%
(% for various income ranges: 46.6% for AGIs below $10k, 50.7% for AGIs $10k-25k, 48.7% for AGIs $25k-50k, 44.5% for AGIs $50k-75k, 55.7% for AGIs $75k-100k, 57.8% for AGIs over 100k)
Household received Food Stamps/SNAP in the past 12 months: 9 Household did not receive Food Stamps/SNAP in the past 12 months: 567
Women who had a birth in the past 12 months: 29 (30 now married, 0 unmarried) Women who did not have a birth in the past 12 months: 191 (160 now married, 27 unmarried)
Housing units in zip code 24070 with a mortgage: 267 (22 second mortgage, 8 home equity loan, 14 both second mortgage and home equity loan) Houses without a mortgage: 47
Median monthly owner costs for units with a mortgage: $1,316 Median monthly owner costs for units without a mortgage: $386
Residents with income below the poverty level in 2022:
This zip code:
3.7%
Whole state:
10.6%
Residents with income below 50% of the poverty level in 2022:
This zip code:
1.2%
Whole state:
5.2%
Median number of rooms in houses and condos:
Here:
5.5
State:
7.0
Notable locations in this zip code not listed on our city pages
Churches in zip code 24070 include: Canterbury Church (A), Catawba Church (B), Johnsville Church (C), Mountain View Church (D), New Hope Church (E), Shiloh Church (F). Display/hide their locations on the map
Cemeteries: Spessard Cemetery (1), Grave Cemetery (2), Brilheart Cemetery (3), Catawba Cemetery (4), Custer Cemetery (5), Furrow Cemetery (6), Morgan Cemetery (7). Display/hide their locations on the map
Streams, rivers, and creeks: Wright Branch (A), Turnpike Creek (B), Trout Creek (C), Sandy Branch (D), Pickles Branch (E), Muddy Branch (F), Mill Creek (G), McAfee Run (H), Gallion Branch (I). Display/hide their locations on the map
In group quarters: 12 (-1 institutionalized population)
Size of family households: 288 2-persons, 34 3-persons, 15 4-persons, 33 5-persons, 33 6-persons
Size of nonfamily households: 161 1-person, 22 2-persons
155 married couples with children.
0 single-parent households ().
97.1% of residents of 24070 zip code speak English at home.
0.1% of residents speak Spanish at home (100% very well).
0.5% of residents speak other Indo-European language at home (100% very well).
2.0% of residents speak other language at home (100% very well).
Foreign born population: 0 (0.0%)
:
0.0%
Whole state:
12.7%
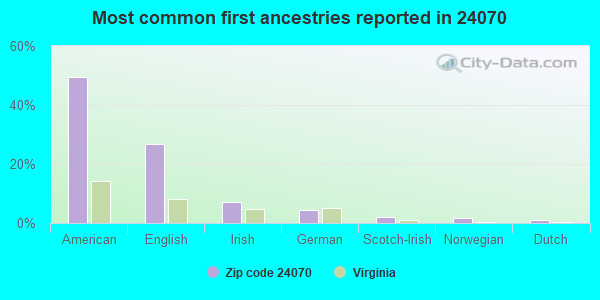
50%American
27%English
7%Irish
4%German
2%Scotch-Irish
2%Norwegian
1%Dutch
Facilities with environmental interests located in this zip code:
AIR MINOR (AIRS/AFS) STATE MASTER (Virginia pollutants databases) - CEDS-20590, AIR PROGRAM CRITERIA AND HAZARDOUS AIR POLLUTANT INVENTORY (Inventory of air pollution sources) National Pollutant Discharge Elimination System NON-MAJOR (Tracking pollutant discharge elimination systems) - permit Conditionally Exempt Small Quantity Generators, less than 100 kg/month of hazardous waste (Resource Conservation and Recovery Act (tracking hazardous waste)) - notification COMMUNITY WATER SYSTEM (SDWIS) - SDWIS-VA2161150 5776, WATER TREATMENT PLANT Business SIC and NAICS classification: GENERAL MEDICAL AND SURGICAL HOSPITALS Organizations: COMMONWEALTH OF VIRGINIA (CONTACT/OWNER)
Housing units lacking complete plumbing facilities: 3.0%
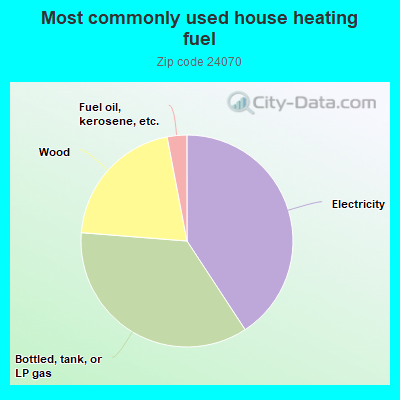
40.9%Electricity
35.6%Bottled, tank, or LP gas
20.8%Wood
3.0%Fuel oil, kerosene, etc.
Population in 1990: 3,747.
Place of birth for U.S.-born residents:
This state: 1,196
Northeast: 11
Midwest: 57
South: 277
62% of the 24070 zip code residents lived in the same house 5 years ago. Out of people who lived in different houses, 28% lived in this county. Out of people who lived in different counties, 50% lived in Virginia.
86% of the 24070 zip code residents lived in the same house 1 year ago. Out of people who lived in different houses, 71% moved from this county. Out of people who lived in different houses, 10% moved from different county within same state. Out of people who lived in different houses, 10% moved from different state. Out of people who lived in different houses, 1% moved from abroad.
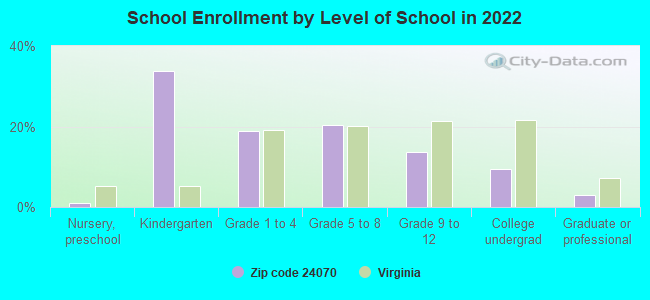
Private vs. public school enrollment:
Students in private schools in grades 1 to 8 (elementary and middle school):
Here:
0.0%
Virginia:
13.2%
Students in private schools in grades 9 to 12 (high school):
Here:
0.0%
Virginia:
10.2%
Students in private undergraduate colleges:
Here:
0.0%
Virginia:
18.7%
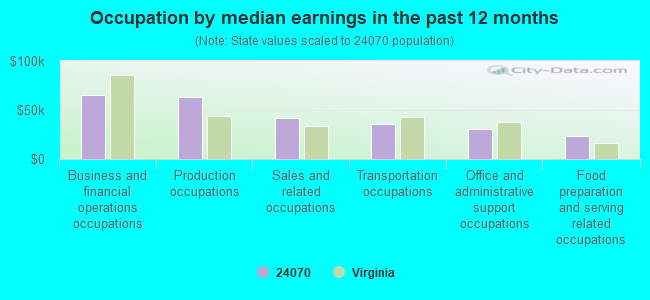
Occupation by median earnings in the past 12 months ($)
65,022Business and financial operations occupations
62,979Production occupations
41,392Sales and related occupations
35,683Transportation occupations
30,138Office and administrative support occupations
23,640Food preparation and serving related occupations
Top industries in this zip code by the number of employees in 2005:
Health Care and Social Assistance: Psychiatric and Substance Abuse Hospitals (250-499 employees: 1 establishment)
Accommodation and Food Services: Full-Service Restaurants (20-49: 1)
Construction: Painting and Wall Covering Contractors (10-19: 1)
Construction: Drywall and Insulation Contractors (5-9: 1, 1-4: 1)
Construction: Masonry Contractors (5-9: 1)
Construction: Siding Contractors (5-9: 1)
Health Care and Social Assistance: Offices of Physicians (except Mental Health Specialists) (1-4: 2)
Health Care and Social Assistance: Services for the Elderly and Persons with Disabilities (1-4: 1)
Other Services (except Public Administration): Religious Organizations (1-4: 1)
People in group quarters in 2010:
104 people in residential treatment centers for adults
People in group quarters in 2000:
77 people in mental (psychiatric) hospitals or wards
Fatal accident statistics in 2012:
Fatal accident count: 1
Vehicles involved in fatal accidents: 3
Fatal accidents caused by drunken drivers: 0
Fatalities: 1
Persons involved in fatal accidents: 3
Pedestrians involved in fatal accidents: 0
Fatal accident statistics in 2011:
Fatal accident count: 1
Vehicles involved in fatal accidents: 2
Fatal accidents caused by drunken drivers: 0
Fatalities: 1
Persons involved in fatal accidents: 5
Pedestrians involved in fatal accidents: 0
Home Mortgage Disclosure Act Aggregated Statistics For Year 2009 (Based on 2 partial tracts)
A) FHA, FSA/RHS & VA Home Purchase Loans
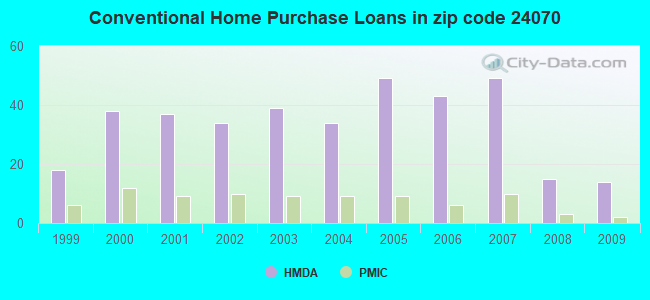
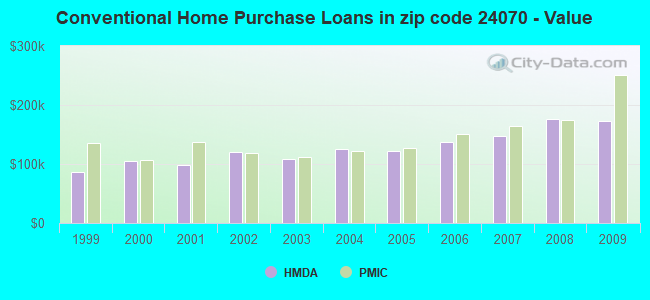
B) Conventional Home Purchase Loans
C) Refinancings
D) Home Improvement Loans
F) Non-occupant Loans on < 5 Family Dwellings (A B C & D)
G) Loans On Manufactured Home Dwelling (A B C & D)
Number
Average Value
Number
Average Value
Number
Average Value
Number
Average Value
Number
Average Value
Number
Average Value
LOANS ORIGINATED
14
$114,839
14
$173,215
94
$170,267
12
$60,524
6
$143,388
8
$80,935
APPLICATIONS APPROVED, NOT ACCEPTED
0
$0
1
$338,770
5
$133,234
1
$19,500
1
$148,670
0
$0
APPLICATIONS DENIED
2
$112,110
3
$85,843
19
$137,509
5
$39,646
1
$95,860
1
$70,680
APPLICATIONS WITHDRAWN
1
$103,990
2
$188,070
21
$152,073
1
$113,740
0
$0
1
$73,930
FILES CLOSED FOR INCOMPLETENESS
1
$52,810
0
$0
7
$115,709
0
$0
1
$52,810
2
$75,960
Aggregated Statistics For Year 2008 (Based on 2 partial tracts)
A) FHA, FSA/RHS & VA Home Purchase Loans
B) Conventional Home Purchase Loans
C) Refinancings
D) Home Improvement Loans
F) Non-occupant Loans on < 5 Family Dwellings (A B C & D)
G) Loans On Manufactured Home Dwelling (A B C & D)
Number
Average Value
Number
Average Value
Number
Average Value
Number
Average Value
Number
Average Value
Number
Average Value
LOANS ORIGINATED
10
$113,005
15
$176,561
76
$159,401
15
$50,261
3
$110,757
10
$91,720
APPLICATIONS APPROVED, NOT ACCEPTED
0
$0
2
$219,755
6
$43,463
1
$26,810
0
$0
0
$0
APPLICATIONS DENIED
0
$0
2
$53,210
49
$142,866
11
$53,027
2
$223,410
3
$96,947
APPLICATIONS WITHDRAWN
0
$0
2
$112,925
17
$148,478
2
$216,505
1
$187,660
0
$0
FILES CLOSED FOR INCOMPLETENESS
0
$0
1
$60,930
2
$94,645
0
$0
0
$0
0
$0
Aggregated Statistics For Year 2007 (Based on 2 partial tracts)
A) FHA, FSA/RHS & VA Home Purchase Loans
B) Conventional Home Purchase Loans
C) Refinancings
D) Home Improvement Loans
F) Non-occupant Loans on < 5 Family Dwellings (A B C & D)
G) Loans On Manufactured Home Dwelling (A B C & D)
Number
Average Value
Number
Average Value
Number
Average Value
Number
Average Value
Number
Average Value
Number
Average Value
LOANS ORIGINATED
10
$117,717
49
$147,973
63
$149,146
24
$46,984
8
$164,612
10
$89,608
APPLICATIONS APPROVED, NOT ACCEPTED
0
$0
2
$112,515
11
$128,728
2
$27,620
0
$0
0
$0
APPLICATIONS DENIED
0
$0
2
$151,105
41
$132,481
24
$63,672
0
$0
6
$84,895
APPLICATIONS WITHDRAWN
0
$0
2
$205,945
24
$126,531
3
$57,410
1
$103,990
1
$98,300
FILES CLOSED FOR INCOMPLETENESS
0
$0
2
$154,760
6
$73,793
0
$0
0
$0
0
$0
Aggregated Statistics For Year 2006 (Based on 2 partial tracts)
A) FHA, FSA/RHS & VA Home Purchase Loans
B) Conventional Home Purchase Loans
C) Refinancings
D) Home Improvement Loans
F) Non-occupant Loans on < 5 Family Dwellings (A B C & D)
G) Loans On Manufactured Home Dwelling (A B C & D)
Number
Average Value
Number
Average Value
Number
Average Value
Number
Average Value
Number
Average Value
Number
Average Value
LOANS ORIGINATED
7
$153,196
43
$136,861
71
$116,036
21
$54,353
6
$84,760
11
$79,985
APPLICATIONS APPROVED, NOT ACCEPTED
1
$108,050
2
$137,295
17
$120,331
2
$60,930
1
$73,930
1
$45,490
APPLICATIONS DENIED
1
$50,370
8
$102,362
32
$109,547
9
$50,279
2
$51,995
4
$79,005
APPLICATIONS WITHDRAWN
1
$64,180
4
$147,652
33
$144,090
2
$36,560
1
$105,610
4
$86,115
FILES CLOSED FOR INCOMPLETENESS
0
$0
1
$61,740
4
$131,202
1
$47,930
0
$0
0
$0
Aggregated Statistics For Year 2005 (Based on 2 partial tracts)
A) FHA, FSA/RHS & VA Home Purchase Loans
B) Conventional Home Purchase Loans
C) Refinancings
D) Home Improvement Loans
F) Non-occupant Loans on < 5 Family Dwellings (A B C & D)
G) Loans On Manufactured Home Dwelling (A B C & D)
Number
Average Value
Number
Average Value
Number
Average Value
Number
Average Value
Number
Average Value
Number
Average Value
LOANS ORIGINATED
7
$129,869
49
$121,761
83
$112,679
13
$34,745
7
$103,174
12
$84,490
APPLICATIONS APPROVED, NOT ACCEPTED
1
$36,560
6
$94,103
14
$112,344
3
$63,097
1
$105,610
6
$52,670
APPLICATIONS DENIED
1
$89,360
5
$104,800
46
$118,469
13
$42,995
3
$104,800
7
$103,871
APPLICATIONS WITHDRAWN
2
$91,800
2
$93,020
26
$127,609
5
$96,514
1
$8,120
3
$119,963
FILES CLOSED FOR INCOMPLETENESS
1
$86,930
1
$63,370
7
$191,610
0
$0
0
$0
0
$0
Aggregated Statistics For Year 2004 (Based on 2 partial tracts)
A) FHA, FSA/RHS & VA Home Purchase Loans
B) Conventional Home Purchase Loans
C) Refinancings
D) Home Improvement Loans
F) Non-occupant Loans on < 5 Family Dwellings (A B C & D)
G) Loans On Manufactured Home Dwelling (A B C & D)
Number
Average Value
Number
Average Value
Number
Average Value
Number
Average Value
Number
Average Value
Number
Average Value
LOANS ORIGINATED
6
$99,518
34
$125,014
90
$114,900
11
$32,275
8
$136,991
8
$89,568
APPLICATIONS APPROVED, NOT ACCEPTED
1
$88,550
1
$171,420
20
$87,211
2
$99,115
1
$171,420
0
$0
APPLICATIONS DENIED
1
$38,180
3
$112,110
46
$123,944
7
$41,897
1
$13,810
3
$93,967
APPLICATIONS WITHDRAWN
1
$88,550
3
$116,713
46
$107,714
2
$53,620
2
$118,205
2
$53,620
FILES CLOSED FOR INCOMPLETENESS
0
$0
0
$0
6
$113,058
1
$22,750
0
$0
2
$90,585
Aggregated Statistics For Year 2003 (Based on 2 partial tracts)
A) FHA, FSA/RHS & VA Home Purchase Loans
B) Conventional Home Purchase Loans
C) Refinancings
D) Home Improvement Loans
F) Non-occupant Loans on < 5 Family Dwellings (A B C & D)
Number
Average Value
Number
Average Value
Number
Average Value
Number
Average Value
Number
Average Value
LOANS ORIGINATED
11
$104,725
39
$109,070
161
$115,835
11
$33,604
13
$73,866
APPLICATIONS APPROVED, NOT ACCEPTED
0
$0
6
$102,092
32
$105,460
1
$74,740
2
$40,215
APPLICATIONS DENIED
0
$0
8
$50,876
58
$106,158
6
$24,507
2
$79,615
APPLICATIONS WITHDRAWN
0
$0
6
$109,268
34
$112,756
2
$60,930
0
$0
FILES CLOSED FOR INCOMPLETENESS
1
$64,180
5
$84,652
29
$134,550
0
$0
1
$56,060
Aggregated Statistics For Year 2002 (Based on 2 partial tracts)
A) FHA, FSA/RHS & VA Home Purchase Loans
B) Conventional Home Purchase Loans
C) Refinancings
D) Home Improvement Loans
F) Non-occupant Loans on < 5 Family Dwellings (A B C & D)
Number
Average Value
Number
Average Value
Number
Average Value
Number
Average Value
Number
Average Value
LOANS ORIGINATED
13
$99,175
34
$120,164
112
$107,708
13
$26,309
6
$59,847
APPLICATIONS APPROVED, NOT ACCEPTED
0
$0
5
$87,252
15
$92,505
4
$40,215
2
$23,965
APPLICATIONS DENIED
0
$0
9
$72,393
46
$91,678
2
$27,620
0
$0
APPLICATIONS WITHDRAWN
0
$0
1
$166,540
30
$100,277
2
$58,900
0
$0
FILES CLOSED FOR INCOMPLETENESS
0
$0
0
$0
7
$117,914
0
$0
0
$0
Aggregated Statistics For Year 2001 (Based on 2 partial tracts)
A) FHA, FSA/RHS & VA Home Purchase Loans
B) Conventional Home Purchase Loans
C) Refinancings
D) Home Improvement Loans
F) Non-occupant Loans on < 5 Family Dwellings (A B C & D)
Number
Average Value
Number
Average Value
Number
Average Value
Number
Average Value
Number
Average Value
LOANS ORIGINATED
17
$91,371
37
$99,091
110
$95,767
16
$28,383
7
$72,187
APPLICATIONS APPROVED, NOT ACCEPTED
0
$0
5
$73,928
10
$94,401
2
$16,250
0
$0
APPLICATIONS DENIED
2
$90,585
10
$89,689
30
$70,056
6
$21,393
0
$0
APPLICATIONS WITHDRAWN
0
$0
2
$51,180
24
$90,853
2
$44,680
1
$63,370
FILES CLOSED FOR INCOMPLETENESS
0
$0
1
$40,620
6
$117,392
0
$0
0
$0
Aggregated Statistics For Year 2000 (Based on 2 partial tracts)
A) FHA, FSA/RHS & VA Home Purchase Loans
B) Conventional Home Purchase Loans
C) Refinancings
D) Home Improvement Loans
F) Non-occupant Loans on < 5 Family Dwellings (A B C & D)
Number
Average Value
Number
Average Value
Number
Average Value
Number
Average Value
Number
Average Value
LOANS ORIGINATED
21
$86,811
38
$105,676
45
$70,986
10
$31,359
0
$0
APPLICATIONS APPROVED, NOT ACCEPTED
1
$57,680
6
$70,137
8
$67,734
0
$0
0
$0
APPLICATIONS DENIED
2
$64,180
11
$74,076
38
$69,268
6
$38,860
1
$14,620
APPLICATIONS WITHDRAWN
2
$79,615
8
$99,925
15
$69,054
2
$43,055
0
$0
FILES CLOSED FOR INCOMPLETENESS
0
$0
1
$55,240
2
$158,420
0
$0
0
$0
Aggregated Statistics For Year 1999 (Based on 1 partial tract)
A) FHA, FSA/RHS & VA Home Purchase Loans
B) Conventional Home Purchase Loans
C) Refinancings
D) Home Improvement Loans
F) Non-occupant Loans on < 5 Family Dwellings (A B C & D)

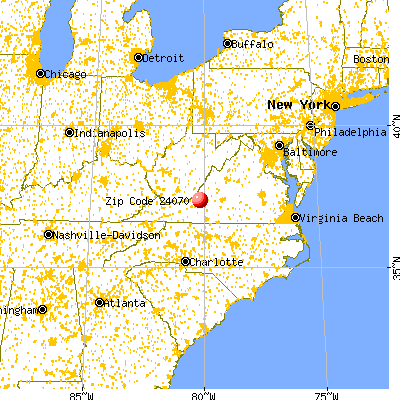


 Nearest zip codes: 24127, 24153, 24087, 24131, 24059, 24060.