Estimated zip code population in 2022: 2,924 Zip code population in 2010: 3,401 Zip code population in 2000: 3,841
Houses and condos: 1,796 Renter-occupied apartments: 162
% of renters here:
12%
State:
33%
March 2022 cost of living index in zip code 24330: 83.6 (less than average, U.S. average is 100)
Land area: 41.5 sq. mi. Water area: 0.8 sq. mi.
Population density: 70 people per square mile
(very low).
OSM Map
General Map
Google Map
MSN Map
OSM Map
General Map
Google Map
MSN Map
OSM Map
General Map
Google Map
MSN Map
OSM Map
General Map
Google Map
MSN Map
Please wait while loading the map...
Real estate property taxes paid for housing units in 2022:
This zip code:
0.5% ($679)
Virginia:
0.7% ($2,617)
Median real estate property taxes paid for housing units with mortgages in 2022: $926 (0.6%) Median real estate property taxes paid for housing units with no mortgage in 2022: $544 (0.5%)
Business Search- 14 Million verified businesses
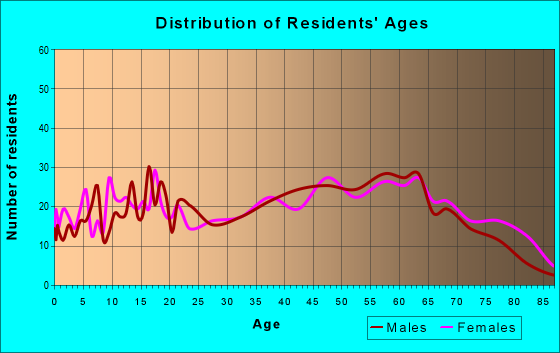
Males: 1,590
(54.4%)
Females: 1,334
(45.6%)
For population 25 years and over in 24330:
High school or higher: 82.0%
Bachelor's degree or higher: 12.4%
Graduate or professional degree: 1.6%
Unemployed: 5.4%
Mean travel time to work (commute): 26.5 minutes
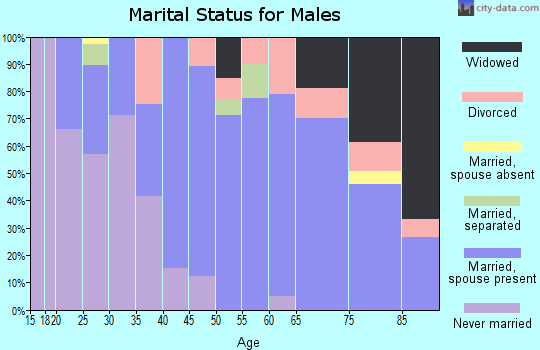
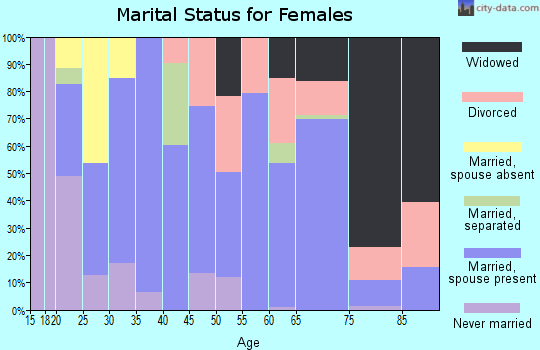
For population 15 years and over in 24330:
Never married: 25.6%
Now married: 55.0%
Separated: 1.0%
Widowed: 6.9%
Divorced: 11.4%
Zip code 24330 compared to state average:
Median household income below state average.
Median house value significantly below state average.
Black race population percentage significantly below state average.
Hispanic race population percentage below state average.
Median age above state average.
Foreign-born population percentage significantly below state average.
Renting percentage significantly below state average.
Length of stay since moving in significantly above state average.
House age above state average.
Number of college students below state average.
Percentage of population with a bachelor's degree or higher significantly below state average.
Estimated median house/condo value in 2022: $124,949
24330:
$124,949
Virginia:
$365,700
According to our research of Virginia and other state lists, there were 12 registered sex offenders living in 24330 zip code as of April 30, 2024. The ratio of all residents to sex offenders in zip code 24330 is 276 to 1. The ratio of registered sex offenders to all residents in this zip code is near the state average.
Median resident age:
This zip code:
43.4 years
Virginia median age:
39.0 years
Average household size:
This zip code:
2.2 people
Virginia:
2.5 people
Averages for the 2020 tax year for zip code 24330, filed in 2021:
Average Adjusted Gross Income (AGI) in 2020: $39,360 (Individual Income Tax Returns)
Here:
$39,360
State:
$86,446
Salary/wage: $35,150 (reported on 81.7% of returns)
Here:
$35,150
State:
$71,185
(% of AGI for various income ranges: 1154.6% for AGIs below $25k, 3547.9% for AGIs $25k-50k, 6458.3% for AGIs $50k-75k, 10051.7% for AGIs $75k-100k, 14776.0% for AGIs $100k-200k)
Taxable interest for individuals: $670 (reported on 20.6% of returns)
This zip code:
$670
Virginia:
$1,805
(% of AGI for various income ranges: 10.2% for AGIs below $25k, 16.7% for AGIs $25k-50k, 16.7% for AGIs $50k-75k, 20.0% for AGIs $75k-100k, 104.0% for AGIs $100k-200k)
Ordinary dividends: $1,427 (reported on 8.4% of returns)
Here:
$1,427
State:
$8,327
(% of AGI for various income ranges: 15.6% for AGIs below $25k, 10.3% for AGIs $25k-50k, 98.3% for AGIs $75k-100k)
Net capital gain/loss in AGI: +$6,670 (reported on 7.6% of returns)
Here:
+$6,670
State:
+$24,644
(% of AGI for various income ranges: 4.6% for AGIs below $25k, 38.2% for AGIs $25k-50k, 1044.0% for AGIs $100k-200k)
Profit/loss from business: +$6,050 (reported on 13.7% of returns)
Here:
+$6,050
State:
+$12,836
(% of AGI for various income ranges: 112.2% for AGIs below $25k, 93.9% for AGIs $25k-50k, 188.3% for AGIs $50k-75k, 155.0% for AGIs $75k-100k)
Taxable individual retirement arrangement distribution: $13,427 (reported on 8.4% of returns)
24330:
$13,427
Virginia:
$21,535
(% of AGI for various income ranges: 76.1% for AGIs below $25k, 98.8% for AGIs $25k-50k, 1398.3% for AGIs $75k-100k)
Earned income credit: $2,029 (reported on 26.0% of returns)
Here:
$2,029
State:
$2,214
(% of AGI for various income ranges: 99.5% for AGIs below $25k, 85.5% for AGIs $25k-50k)
Percentage of individuals using paid preparers for their 2020 taxes: 95.4%
Here:
95%
State:
92%
(% for various income ranges: 94.6% for AGIs below $25k, 95.1% for AGIs $25k-50k, 100.0% for AGIs $50k-75k, 100.0% for AGIs $75k-100k, 88.9% for AGIs $100k-200k)
Averages for the 2012 tax year for zip code 24330, filed in 2013:
Average Adjusted Gross Income (AGI) in 2012: $31,998 (Individual Income Tax Returns)
Here:
$31,998
State:
$71,192
Salary/wage: $29,885 (reported on 84.7% of returns)
Here:
$29,885
State:
$59,229
(% of AGI for various income ranges: 80.4% for AGIs below $25k, 82.7% for AGIs $25k-50k, 82.6% for AGIs $50k-75k, 76.3% for AGIs $75k-100k, 64.5% for AGIs $100k-200k)
Taxable interest for individuals: $707 (reported on 22.1% of returns)
This zip code:
$707
Virginia:
$1,600
(% of AGI for various income ranges: 1.2% for AGIs below $25k, 0.3% for AGIs $25k-50k, 0.2% for AGIs $50k-75k, 0.7% for AGIs $75k-100k)
Ordinary dividends: $2,722 (reported on 6.9% of returns)
Here:
$2,722
State:
$6,959
(% of AGI for various income ranges: 0.9% for AGIs below $25k, 0.7% for AGIs $25k-50k, 0.7% for AGIs $50k-75k)
Net capital gain/loss in AGI: +$2,160 (reported on 7.6% of returns)
Here:
+$2,160
State:
+$16,672
(% of AGI for various income ranges: 1.2% for AGIs $25k-50k, 0.7% for AGIs $50k-75k)
Profit/loss from business: +$6,965 (reported on 13.0% of returns)
Here:
+$6,965
State:
+$14,116
(% of AGI for various income ranges: 6.1% for AGIs below $25k, 2.9% for AGIs $25k-50k, 2.5% for AGIs $50k-75k)
Taxable individual retirement arrangement distribution: $7,690 (reported on 7.6% of returns)
24330:
$7,690
Virginia:
$16,667
(% of AGI for various income ranges: 2.4% for AGIs below $25k, 2.2% for AGIs $25k-50k, 2.7% for AGIs $50k-75k)
Total itemized deductions: $19,000 (29% of AGI, reported on 10.7% of returns)
Here:
$19,000
State:
$26,596
Here:
28.9% of AGI
State:
20.1% of AGI
(% of AGI for various income ranges: 7.8% for AGIs $25k-50k, 6.0% for AGIs $50k-75k, 7.4% for AGIs $75k-100k, 13.5% for AGIs $100k-200k)
Charity contributions: $4,760 (reported on 7.6% of returns)
Here:
$4,760
State:
$4,443
(% of AGI for various income ranges: 1.3% for AGIs $25k-50k, 1.7% for AGIs $50k-75k, 2.7% for AGIs $100k-200k)
Taxes paid: $4,721 (reported on 10.7% of returns)
24330:
$4,721
State:
$9,951
(% of AGI for various income ranges: 1.1% for AGIs $25k-50k, 1.5% for AGIs $50k-75k, 2.2% for AGIs $75k-100k, 5.1% for AGIs $100k-200k)
Earned income credit: $2,246 (reported on 29.8% of returns)
Here:
$2,246
State:
$2,211
(% of AGI for various income ranges: 7.5% for AGIs below $25k, 1.5% for AGIs $25k-50k)
Percentage of individuals using paid preparers for their 2012 taxes: 70.2%
Here:
70%
State:
46%
(% for various income ranges: 69.6% for AGIs below $25k, 69.4% for AGIs $25k-50k, 82.4% for AGIs $50k-75k, 60.0% for AGIs $75k-100k, 50.0% for AGIs $100k-200k)
Averages for the 2004 tax year for zip code 24330, filed in 2005:
Average Adjusted Gross Income (AGI) in 2004: $26,398 (Individual Income Tax Returns)
Here:
$26,398
State:
$56,704
Salary/wage: $24,661 (reported on 89.1% of returns)
Here:
$24,661
State:
$48,441
(% of AGI for various income ranges: 90.6% for AGIs below $10k, 80.2% for AGIs $10k-25k, 88.5% for AGIs $25k-50k, 88.6% for AGIs $50k-75k, 76.9% for AGIs $75k-100k, 44.4% for AGIs over 100k)
Taxable interest for individuals: $930 (reported on 26.9% of returns)
This zip code:
$930
Virginia:
$1,688
(% of AGI for various income ranges: 2.7% for AGIs below $10k, 1.5% for AGIs $10k-25k, 0.6% for AGIs $25k-50k, 0.7% for AGIs $50k-75k, 0.4% for AGIs $75k-100k, 1.1% for AGIs over 100k)
Taxable dividends: $862 (reported on 8.4% of returns)
Here:
$862
State:
$4,028
(% of AGI for various income ranges: 0.5% for AGIs below $10k, 0.5% for AGIs $10k-25k, 0.1% for AGIs $25k-50k, 0.2% for AGIs $50k-75k, 1.0% for AGIs $75k-100k)
Net capital gain/loss: +$1,833 (reported on 5.7% of returns)
Here:
+$1,833
State:
+$14,375
Profit/loss from business: +$5,489 (reported on 13.8% of returns)
Here:
+$5,489
State:
+$13,342
(% of AGI for various income ranges: 12.8% for AGIs below $10k, 5.9% for AGIs $10k-25k, 2.0% for AGIs $25k-50k, 0.9% for AGIs $50k-75k)
Total itemized deductions: $14,591 (27% of AGI, reported on 9.6% of returns)
Here:
$14,591
State:
$21,492
Here:
27.3% of AGI
State:
21.0% of AGI
(% of AGI for various income ranges: 2.5% for AGIs $10k-25k, 4.7% for AGIs $25k-50k, 7.8% for AGIs $50k-75k, 10.0% for AGIs $75k-100k, 10.2% for AGIs over 100k)
Charity contributions deductions: $3,340 (6% of AGI, reported on 7.3% of returns)
Here:
$3,340
State:
$3,794
Here:
5.9% of AGI
State:
3.5% of AGI
(% of AGI for various income ranges: 0.2% for AGIs $10k-25k, 0.9% for AGIs $25k-50k, 1.3% for AGIs $50k-75k, 3.6% for AGIs over 100k)
Total tax: $2,514 (reported on 70.7% of returns)
24330:
$2,514
State:
$9,537
(% of AGI for various income ranges: 2.9% for AGIs below $10k, 3.7% for AGIs $10k-25k, 6.0% for AGIs $25k-50k, 8.0% for AGIs $50k-75k, 10.7% for AGIs $75k-100k, 17.7% for AGIs over 100k)
Earned income credit: $1,710 (reported on 26.6% of returns)
Here:
$1,710
State:
$1,734
Percentage of individuals using paid preparers for their 2004 taxes: 73.2%
Here:
73%
State:
52%
(% for various income ranges: 66.3% for AGIs below $10k, 75.8% for AGIs $10k-25k, 75.5% for AGIs $25k-50k, 72.5% for AGIs $50k-75k, 69.6% for AGIs $75k-100k, 62.5% for AGIs over 100k)
Household received Food Stamps/SNAP in the past 12 months: 196 Household did not receive Food Stamps/SNAP in the past 12 months: 1,120
Women who had a birth in the past 12 months: 5 (5 now married, 0 unmarried) Women who did not have a birth in the past 12 months: 632 (274 now married, 357 unmarried)
Housing units in zip code 24330 with a mortgage: 446 (50 second mortgage, 41 both second mortgage and home equity loan) Houses without a mortgage: 39
Median monthly owner costs for units with a mortgage: $1,010 Median monthly owner costs for units without a mortgage: $288
Residents with income below the poverty level in 2022:
This zip code:
26.3%
Whole state:
10.6%
Residents with income below 50% of the poverty level in 2022:
This zip code:
14.8%
Whole state:
5.2%
Median number of rooms in houses and condos:
Here:
5.9
State:
7.0
Median number of rooms in apartments:
Here:
4.7
State:
4.3
Notable locations in this zip code not listed on our city pages
Churches in zip code 24330 include: Atkins Church (A), Brush Creek Mission (B), Center View Church (C), Ebenezer Church (D), Edwards Chapel (E), Fries Church (F), Fries Tabernacle (G), Grace Church (H), Liberty Church (I). Display/hide their locations on the map
Cemeteries: Mount Olivet Cemetery (1), Mount Hope Cemetery (2), Edwards Chapel Cemetery (3), Providence Cemetery (4), Fries Cemetery (5), Ebenezer Cemetery (6), Warrick Cemetery (7). Display/hide their locations on the map
Streams, rivers, and creeks: Stevens Creek (A), Little Brush Creek (B), Falls Branch (C), Elk Creek (D), Eagle Bottom Creek (E), Knob Fork (F), Bull Run (G), Bournes Branch (H), Boags Branch (I). Display/hide their locations on the map
In group quarters: 3 (-1 institutionalized population)
Size of family households: 536 2-persons, 189 3-persons, 107 4-persons, 45 5-persons, 10 6-persons, 13 7-or-more-persons
Size of nonfamily households: 376 1-person, 28 2-persons
174 married couples with children.
146 single-parent households (6 men, 140 women).
99.4% of residents of 24330 zip code speak English at home.
0.5% of residents speak Asian or Pacific Island language at home (100% very well).
Foreign born population: 0 (0.0%)
:
0.0%
Whole state:
12.7%
52%American
17%English
7%Irish
4%German
2%Italian
0%Norwegian
0%Scotch-Irish
Year of entry for the foreign-born population
02010 or later
02000 to 2009
551990 to 1999
0Before 1990
Housing units lacking complete plumbing facilities: 4.3% Housing units lacking complete kitchen facilities: 2.0%
70.3%Electricity
18.0%Fuel oil, kerosene, etc.
9.0%Wood
2.4%Bottled, tank, or LP gas
Population in 1990: 4,077.
Place of birth for U.S.-born residents:
This state: 2,293
Northeast: 59
Midwest: 51
South: 430
West: 9
70% of the 24330 zip code residents lived in the same house 5 years ago. Out of people who lived in different houses, 53% lived in this county. Out of people who lived in different counties, 50% lived in Virginia.
96% of the 24330 zip code residents lived in the same house 1 year ago. Out of people who lived in different houses, 55% moved from this county. Out of people who lived in different houses, 49% moved from different county within same state. Out of people who lived in different houses, 1% moved from different state.
Private vs. public school enrollment:
Students in private schools in grades 1 to 8 (elementary and middle school):
Here:
0.0%
Virginia:
13.2%
Students in private schools in grades 9 to 12 (high school): 26
Here:
22.2%
Virginia:
10.2%
Students in private undergraduate colleges:
Here:
0.0%
Virginia:
18.7%
Occupation by median earnings in the past 12 months ($)
88,265Transportation occupations
52,190Health technologists and technicians
50,453Health diagnosing and treating practitioners and other technical occupations
50,135Law enforcement workers including supervisors
46,121Education, training, and library occupations
39,026Fire fighting and prevention, and other protective service workers including supervisors
Top industries in this zip code by the number of employees in 2005:
Administrative and Support and Waste Management and Remediation Services: Janitorial Services (20-49 employees: 1 establishment)
Administrative and Support and Waste Management and Remediation Services: Landscaping Services (10-19: 1, 1-4: 1)
Wholesale Trade: Coal and Other Mineral and Ore Merchant Wholesalers (10-19: 1)
Construction: New Single-Family Housing Construction (except Operative Builders) (1-4: 4)
Finance and Insurance: Commercial Banking (5-9: 1)
Construction: Masonry Contractors (5-9: 1)
Arts, Entertainment, and Recreation: Amusement Arcades (5-9: 1)
People in group quarters in 2010:
4 people in group homes intended for adults
Fatal accident statistics in 2014:
Fatal accident count: 1
Vehicles involved in fatal accidents: 1
Fatal accidents caused by drunken drivers: 0
Fatalities: 1
Persons involved in fatal accidents: 1
Pedestrians involved in fatal accidents: 1
Fatal accident statistics in 2012:
Fatal accident count: 1
Vehicles involved in fatal accidents: 2
Fatal accidents caused by drunken drivers: 0
Fatalities: 1
Persons involved in fatal accidents: 2
Pedestrians involved in fatal accidents: 0
2002 - 2018 National Fire Incident Reporting System (NFIRS) incidents
Based on the data from the years 2002 - 2018 the average number of fire incidents per year is 18. The highest number of reported fires - 31 took place in 2011, and the least - 5 in 2008. The data has a dropping trend.
When looking into fire subcategories, the most incidents belonged to: Structure Fires (41.3%), and Outside Fires (29.8%).
Fire incident types reported to NFIRS in Zip Code 24330


 Nearest zip codes: 24350, 24322, 24333, 24312, 24381, 24326.


 Based on the data from the years 2002 - 2018 the average number of fire incidents per year is 18. The highest number of reported fires - 31 took place in 2011, and the least - 5 in 2008. The data has a dropping trend.
 When looking into fire subcategories, the most incidents belonged to: Structure Fires (41.3%), and Outside Fires (29.8%).