According to our research of West Virginia and other state lists, there were 5 registered sex offenders living in 25669 zip code as of June 20, 2024. The ratio of all residents to sex offenders in zip code 25669 is 197 to 1.
Median resident age:
This zip code:
48.6 years
West Virginia median age:
42.9 years
Average household size:
This zip code:
2.6 people
West Virginia:
2.3 people
Averages for the 2020 tax year for zip code 25669, filed in 2021:
Average Adjusted Gross Income (AGI) in 2020: $40,821 (Individual Income Tax Returns)
Here:
$40,821
State:
$56,292
Salary/wage: $38,117 (reported on 79.3% of returns)
Here:
$38,117
State:
$49,093
(% of AGI for various income ranges: 950.0% for AGIs below $25k, 2732.9% for AGIs $25k-50k, 6580.0% for AGIs $50k-75k, 13070.0% for AGIs $100k-200k)
Taxable interest for individuals: $175 (reported on 13.8% of returns)
This zip code:
$175
West Virginia:
$1,141
(% of AGI for various income ranges: 10.0% for AGIs $25k-50k)
Profit/loss from business: +$7,333 (reported on 10.3% of returns)
Here:
+$7,333
State:
+$12,084
(% of AGI for various income ranges: 220.0% for AGIs below $25k)
Earned income credit: $3,144 (reported on 31.0% of returns)
Here:
$3,144
State:
$2,258
(% of AGI for various income ranges: 195.0% for AGIs below $25k, 125.7% for AGIs $25k-50k)
Percentage of individuals using paid preparers for their 2020 taxes: 96.6%
Here:
97%
State:
93%
(% for various income ranges: 91.7% for AGIs below $25k, 100.0% for AGIs $25k-50k, 100.0% for AGIs $50k-75k, 100.0% for AGIs $100k-200k)
Averages for the 2012 tax year for zip code 25669, filed in 2013:
Average Adjusted Gross Income (AGI) in 2012: $40,003 (Individual Income Tax Returns)
Here:
$40,003
State:
$48,628
Salary/wage: $38,980 (reported on 85.7% of returns)
Here:
$38,980
State:
$42,328
(% of AGI for various income ranges: 70.0% for AGIs below $25k, 77.2% for AGIs $25k-50k, 89.0% for AGIs $50k-75k, 87.8% for AGIs $75k-100k, 88.4% for AGIs $100k-200k)
Taxable interest for individuals: $514 (reported on 20.0% of returns)
This zip code:
$514
West Virginia:
$1,211
Profit/loss from business: +$8,280 (reported on 14.3% of returns)
Here:
+$8,280
State:
+$13,636
Total itemized deductions: $17,033 (23% of AGI, reported on 8.6% of returns)
Here:
$17,033
State:
$21,148
Here:
22.7% of AGI
State:
18.1% of AGI
Taxes paid: $4,967 (reported on 8.6% of returns)
25669:
$4,967
State:
$8,103
Earned income credit: $2,625 (reported on 34.3% of returns)
Here:
$2,625
State:
$2,140
(% of AGI for various income ranges: 12.7% for AGIs below $25k, 1.7% for AGIs $25k-50k)
Percentage of individuals using paid preparers for their 2012 taxes: 60.0%
Here:
60%
State:
49%
(% for various income ranges: 47.1% for AGIs below $25k, 71.4% for AGIs $25k-50k, 60.0% for AGIs $50k-75k, 125.0% for AGIs $75k-100k)
Averages for the 2004 tax year for zip code 25669, filed in 2005:
Average Adjusted Gross Income (AGI) in 2004: $27,514 (Individual Income Tax Returns)
Here:
$27,514
State:
$37,498
Salary/wage: $26,754 (reported on 87.8% of returns)
Here:
$26,754
State:
$33,645
(% of AGI for various income ranges: 79.7% for AGIs below $10k, 75.9% for AGIs $10k-25k, 83.0% for AGIs $25k-50k, 93.0% for AGIs $50k-75k, 89.6% for AGIs $75k-100k)
Taxable interest for individuals: $806 (reported on 26.5% of returns)
This zip code:
$806
West Virginia:
$1,465
(% of AGI for various income ranges: 0.6% for AGIs below $10k, 2.7% for AGIs $10k-25k, 0.6% for AGIs $25k-50k, 0.2% for AGIs $50k-75k)
Taxable dividends: $208 (reported on 6.5% of returns)
Here:
$208
State:
$2,913
Net capital gain/loss: +$500 (reported on 3.2% of returns)
Here:
+$500
State:
+$6,331
Profit/loss from business: +$3,000 (reported on 7.3% of returns)
Here:
+$3,000
State:
+$11,074
Total itemized deductions: $13,259 (23% of AGI, reported on 7.3% of returns)
Here:
$13,259
State:
$16,976
Here:
23.3% of AGI
State:
19.0% of AGI
Charity contributions deductions: $2,455 (4% of AGI, reported on 5.9% of returns)
Here:
$2,455
State:
$3,529
Here:
4.1% of AGI
State:
3.7% of AGI
Total tax: $2,677 (reported on 61.9% of returns)
25669:
$2,677
State:
$5,372
(% of AGI for various income ranges: 2.4% for AGIs below $10k, 2.3% for AGIs $10k-25k, 5.5% for AGIs $25k-50k, 7.7% for AGIs $50k-75k, 11.1% for AGIs $75k-100k)
Earned income credit: $1,687 (reported on 31.1% of returns)
Here:
$1,687
State:
$1,662
Percentage of individuals using paid preparers for their 2004 taxes: 73.0%
Here:
73%
State:
55%
(% for various income ranges: 70.7% for AGIs below $10k, 79.1% for AGIs $10k-25k, 70.1% for AGIs $25k-50k, 86.5% for AGIs $50k-75k)
Household received Food Stamps/SNAP in the past 12 months: 224 Household did not receive Food Stamps/SNAP in the past 12 months: 146
Women who did not have a birth in the past 12 months: 98 (89 now married, 8 unmarried)
Housing units in zip code 25669 with a mortgage: 35 Median monthly owner costs for units with a mortgage: $1,033 Median monthly owner costs for units without a mortgage: $259
Residents with income below the poverty level in 2022:
This zip code:
34.5%
Whole state:
17.9%
Residents with income below 50% of the poverty level in 2022:
This zip code:
15.1%
Whole state:
9.7%
Median number of rooms in houses and condos:
Here:
5.5
State:
6.5
Median number of rooms in apartments:
Here:
6.5
State:
4.7
Notable locations in this zip code not listed on our city pages
Churches in zip code 25669 include: Walnut Grove Church (A), Thomas Copley Church (B), Bull Creek Church (C), Pine Grove Church (D). Display/hide their locations on the map
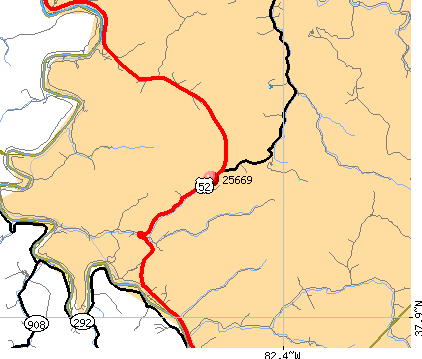
Streams, rivers, and creeks: Summer Fork (A), Silver Creek (B), Peters Branch (C), Laurel Branch (D), Jennie Creek (E), Hagerman Branch (F), Drag Creek (G), Coon Creek (H), Camp Creek (I). Display/hide their locations on the map
In group quarters: 2 (-1 institutionalized population)
Size of family households: 115 2-persons, 38 3-persons, 52 4-persons, 29 5-persons
Size of nonfamily households: 117 1-person
22 married couples with children.
0 single-parent households ().
99.4% of residents of 25669 zip code speak English at home.
Foreign born population: 2 (0.3%) (100.0% of them are naturalized citizens)
This zip code:
0.3%
Whole state:
1.8%
50%France
35%German
32%American
31%English
2%Dutch
Year of entry for the foreign-born population
02010 or later
22000 to 2009
01990 to 1999
0Before 1990
Facilities with environmental interests located in this zip code:
CRUM ELEMENTARY SCHOOL (150 SCHOOL STREET in CRUM, WV)
(National Center for Education Statistics) - STATE ID-89206 National Pollutant Discharge Elimination System NON-MAJOR (Tracking pollutant discharge elimination systems) - permit Business SIC classification: SEWERAGE SYSTEMS Organizations: WAYNE COUNTY SCHOOL DISTRICT (SCHOOL DISTRICT)
Alternative names: CRUM ELEMENTARY AND MIDDLE SCH, CRUM MIDDLE SCHOOL, WAYNE CNTY BD OF ED
A & L TRUCKING INC (RT 52 1 M SO OF CRUM in CRUM, WV)
Housing units lacking complete plumbing facilities: 8.8% Housing units lacking complete kitchen facilities: 8.4%
42.7%Electricity
41.3%Utility gas
16.3%Wood
Population in 1990: 763. Population change in the 1990s: +786 (+103.0%).
Place of birth for U.S.-born residents:
This state: 508
Northeast: 7
Midwest: 59
South: 303
West: 43
66% of the 25669 zip code residents lived in the same house 5 years ago. Out of people who lived in different houses, 59% lived in this county. Out of people who lived in different counties, 50% lived in West Virginia.
92% of the 25669 zip code residents lived in the same house 1 year ago. Out of people who lived in different houses, 19% moved from different county within same state. Out of people who lived in different houses, 87% moved from different state.
Private vs. public school enrollment:
Students in private schools in grades 1 to 8 (elementary and middle school):
Here:
0.0%
West Virginia:
12.2%
Occupation by median earnings in the past 12 months ($)
52,540Transportation occupations
21,793Healthcare support occupations
Top industries in this zip code by the number of employees in 2005:
Other Services (except Public Administration): General Automotive Repair (1-4 employees: 1 establishment)
Construction: New Single-Family Housing Construction (except Operative Builders) (1-4: 1)
Accommodation and Food Services: Full-Service Restaurants (1-4: 1)
Fatal accident statistics in 2011:
Fatal accident count: 1
Vehicles involved in fatal accidents: 2
Fatal accidents caused by drunken drivers: 1
Fatalities: 1
Persons involved in fatal accidents: 3
Pedestrians involved in fatal accidents: 0
Home Mortgage Disclosure Act Aggregated Statistics For Year 2009 (Based on 2 partial tracts)
B) Conventional Home Purchase Loans
C) Refinancings
D) Home Improvement Loans
F) Non-occupant Loans on < 5 Family Dwellings (A B C & D)
G) Loans On Manufactured Home Dwelling (A B C & D)
Number
Average Value
Number
Average Value
Number
Average Value
Number
Average Value
Number
Average Value
LOANS ORIGINATED
0
$0
7
$104,573
1
$13,050
1
$78,920
0
$0
APPLICATIONS APPROVED, NOT ACCEPTED
1
$60,900
1
$31,070
0
$0
0
$0
1
$60,900
APPLICATIONS DENIED
2
$48,470
1
$78,300
1
$15,530
1
$9,320
1
$67,110
APPLICATIONS WITHDRAWN
0
$0
1
$44,120
0
$0
0
$0
0
$0
FILES CLOSED FOR INCOMPLETENESS
0
$0
1
$45,980
0
$0
0
$0
0
$0
Aggregated Statistics For Year 2008 (Based on 2 partial tracts)
B) Conventional Home Purchase Loans
C) Refinancings
D) Home Improvement Loans
F) Non-occupant Loans on < 5 Family Dwellings (A B C & D)
G) Loans On Manufactured Home Dwelling (A B C & D)
Number
Average Value
Number
Average Value
Number
Average Value
Number
Average Value
Number
Average Value
LOANS ORIGINATED
2
$21,130
5
$65,992
1
$11,190
1
$57,790
1
$31,690
APPLICATIONS APPROVED, NOT ACCEPTED
5
$42,256
1
$19,260
1
$5,590
0
$0
5
$42,256
APPLICATIONS DENIED
1
$100,050
10
$128,133
2
$12,115
0
$0
2
$99,115
APPLICATIONS WITHDRAWN
0
$0
2
$262,230
0
$0
0
$0
0
$0
FILES CLOSED FOR INCOMPLETENESS
0
$0
0
$0
0
$0
0
$0
0
$0
Aggregated Statistics For Year 2007 (Based on 2 partial tracts)
B) Conventional Home Purchase Loans
C) Refinancings
D) Home Improvement Loans
F) Non-occupant Loans on < 5 Family Dwellings (A B C & D)
G) Loans On Manufactured Home Dwelling (A B C & D)
Number
Average Value
Number
Average Value
Number
Average Value
Number
Average Value
Number
Average Value
LOANS ORIGINATED
2
$33,865
6
$67,318
4
$40,080
2
$51,265
2
$33,865
APPLICATIONS APPROVED, NOT ACCEPTED
2
$54,370
1
$62,140
1
$54,680
1
$18,640
2
$54,370
APPLICATIONS DENIED
4
$34,488
7
$89,481
1
$12,430
1
$34,180
4
$53,595
APPLICATIONS WITHDRAWN
1
$42,260
1
$77,670
1
$105,640
2
$36,665
1
$42,260
FILES CLOSED FOR INCOMPLETENESS
0
$0
0
$0
0
$0
0
$0
0
$0
Aggregated Statistics For Year 2006 (Based on 2 partial tracts)
A) FHA, FSA/RHS & VA Home Purchase Loans
B) Conventional Home Purchase Loans
C) Refinancings
D) Home Improvement Loans
F) Non-occupant Loans on < 5 Family Dwellings (A B C & D)
G) Loans On Manufactured Home Dwelling (A B C & D)
Number
Average Value
Number
Average Value
Number
Average Value
Number
Average Value
Number
Average Value
Number
Average Value
LOANS ORIGINATED
1
$30,450
3
$41,633
5
$70,964
2
$49,710
0
$0
3
$45,157
APPLICATIONS APPROVED, NOT ACCEPTED
0
$0
2
$32,315
1
$16,160
1
$76,430
0
$0
2
$61,210
APPLICATIONS DENIED
1
$41,630
9
$56,548
7
$84,421
4
$54,218
1
$44,120
12
$55,771
APPLICATIONS WITHDRAWN
0
$0
2
$70,220
2
$190,460
0
$0
0
$0
1
$53,440
FILES CLOSED FOR INCOMPLETENESS
0
$0
0
$0
1
$55,930
0
$0
0
$0
0
$0
Aggregated Statistics For Year 2005 (Based on 2 partial tracts)
A) FHA, FSA/RHS & VA Home Purchase Loans
B) Conventional Home Purchase Loans
C) Refinancings
D) Home Improvement Loans
F) Non-occupant Loans on < 5 Family Dwellings (A B C & D)
G) Loans On Manufactured Home Dwelling (A B C & D)
Number
Average Value
Number
Average Value
Number
Average Value
Number
Average Value
Number
Average Value
Number
Average Value
LOANS ORIGINATED
1
$36,660
6
$56,443
10
$76,246
2
$15,535
2
$25,165
5
$32,188
APPLICATIONS APPROVED, NOT ACCEPTED
0
$0
3
$74,153
3
$48,883
0
$0
0
$0
3
$64,210
APPLICATIONS DENIED
0
$0
17
$57,461
7
$59,566
3
$28,790
0
$0
17
$48,762
APPLICATIONS WITHDRAWN
1
$84,510
1
$27,960
0
$0
0
$0
0
$0
1
$96,940
FILES CLOSED FOR INCOMPLETENESS
0
$0
0
$0
0
$0
0
$0
0
$0
0
$0
Aggregated Statistics For Year 2004 (Based on 2 partial tracts)
B) Conventional Home Purchase Loans
C) Refinancings
D) Home Improvement Loans
F) Non-occupant Loans on < 5 Family Dwellings (A B C & D)
G) Loans On Manufactured Home Dwelling (A B C & D)
Number
Average Value
Number
Average Value
Number
Average Value
Number
Average Value
Number
Average Value
LOANS ORIGINATED
6
$53,752
6
$61,725
2
$27,030
1
$65,870
5
$42,752
APPLICATIONS APPROVED, NOT ACCEPTED
1
$59,650
4
$77,985
1
$20,510
0
$0
2
$61,520
APPLICATIONS DENIED
14
$36,174
12
$73,118
11
$14,857
2
$11,495
17
$42,072
APPLICATIONS WITHDRAWN
2
$51,265
2
$154,730
1
$6,210
0
$0
1
$32,310
FILES CLOSED FOR INCOMPLETENESS
0
$0
0
$0
0
$0
0
$0
0
$0
Aggregated Statistics For Year 2003 (Based on 2 partial tracts)
A) FHA, FSA/RHS & VA Home Purchase Loans
B) Conventional Home Purchase Loans
C) Refinancings
D) Home Improvement Loans
F) Non-occupant Loans on < 5 Family Dwellings (A B C & D)
Number
Average Value
Number
Average Value
Number
Average Value
Number
Average Value
Number
Average Value
LOANS ORIGINATED
0
$0
7
$37,550
9
$50,886
7
$13,937
3
$47,020
APPLICATIONS APPROVED, NOT ACCEPTED
0
$0
5
$44,492
6
$50,643
1
$3,110
0
$0
APPLICATIONS DENIED
1
$16,160
17
$38,746
16
$58,140
4
$10,720
1
$42,260
APPLICATIONS WITHDRAWN
0
$0
1
$13,670
5
$65,744
0
$0
1
$18,640
FILES CLOSED FOR INCOMPLETENESS
0
$0
1
$49,710
1
$74,570
0
$0
0
$0
Aggregated Statistics For Year 2002 (Based on 2 partial tracts)
A) FHA, FSA/RHS & VA Home Purchase Loans
B) Conventional Home Purchase Loans
C) Refinancings
D) Home Improvement Loans
F) Non-occupant Loans on < 5 Family Dwellings (A B C & D)
Number
Average Value
Number
Average Value
Number
Average Value
Number
Average Value
Number
Average Value
LOANS ORIGINATED
1
$14,290
7
$39,859
12
$53,440
6
$6,525
3
$25,270
APPLICATIONS APPROVED, NOT ACCEPTED
0
$0
3
$30,450
2
$34,175
1
$8,080
0
$0
APPLICATIONS DENIED
0
$0
16
$39,187
23
$59,276
11
$7,400
0
$0
APPLICATIONS WITHDRAWN
0
$0
1
$30,450
6
$56,030
0
$0
0
$0
FILES CLOSED FOR INCOMPLETENESS
1
$36,660
1
$82,020
3
$82,647
0
$0
0
$0
Aggregated Statistics For Year 2001 (Based on 2 partial tracts)
A) FHA, FSA/RHS & VA Home Purchase Loans
B) Conventional Home Purchase Loans
C) Refinancings
D) Home Improvement Loans
F) Non-occupant Loans on < 5 Family Dwellings (A B C & D)
Number
Average Value
Number
Average Value
Number
Average Value
Number
Average Value
Number
Average Value
LOANS ORIGINATED
0
$0
12
$32,002
17
$53,879
4
$6,680
1
$13,050
APPLICATIONS APPROVED, NOT ACCEPTED
0
$0
5
$33,928
9
$39,770
1
$31,690
1
$7,460
APPLICATIONS DENIED
0
$0
40
$35,296
22
$55,502
10
$11,993
1
$34,800
APPLICATIONS WITHDRAWN
1
$39,770
2
$40,390
9
$50,196
2
$3,730
0
$0
FILES CLOSED FOR INCOMPLETENESS
0
$0
0
$0
4
$63,850
1
$16,780
0
$0
Aggregated Statistics For Year 2000 (Based on 2 partial tracts)
A) FHA, FSA/RHS & VA Home Purchase Loans
B) Conventional Home Purchase Loans
C) Refinancings
D) Home Improvement Loans
F) Non-occupant Loans on < 5 Family Dwellings (A B C & D)
Number
Average Value
Number
Average Value
Number
Average Value
Number
Average Value
Number
Average Value
LOANS ORIGINATED
1
$21,130
8
$29,516
12
$48,158
6
$9,010
1
$18,640
APPLICATIONS APPROVED, NOT ACCEPTED
0
$0
4
$41,322
9
$39,700
2
$11,495
1
$32,930
APPLICATIONS DENIED
0
$0
34
$31,655
21
$36,219
4
$6,370
4
$32,623
APPLICATIONS WITHDRAWN
1
$41,010
2
$36,350
9
$40,806
2
$20,815
0
$0
FILES CLOSED FOR INCOMPLETENESS
0
$0
1
$21,750
3
$44,120
0
$0
0
$0
Aggregated Statistics For Year 1999 (Based on 1 partial tract)
B) Conventional Home Purchase Loans
C) Refinancings
D) Home Improvement Loans
F) Non-occupant Loans on < 5 Family Dwellings (A B C & D)
Detailed HMDA statistics for the following Tracts:0210.00
Private Mortgage Insurance Companies Aggregated Statistics For Year 2000 (Based on 2 partial tracts)
B) Refinancings
Number
Average Value
LOANS ORIGINATED
0
$0
APPLICATIONS APPROVED, NOT ACCEPTED
0
$0
APPLICATIONS DENIED
1
$8,080
APPLICATIONS WITHDRAWN
0
$0
FILES CLOSED FOR INCOMPLETENESS
0
$0
Detailed PMIC statistics for the following Tracts:0210.00
2003 - 2018 National Fire Incident Reporting System (NFIRS) incidents
According to the data from the years 2003 - 2018 the average number of fire incidents per year is 11. The highest number of fire incidents - 24 took place in 2005, and the least - 5 in 2006. The data has a decreasing trend.
When looking into fire subcategories, the most incidents belonged to: Structure Fires (48.6%), and Mobile Property/Vehicle Fires (22.3%).
Fire incident types reported to NFIRS in Zip Code 25669

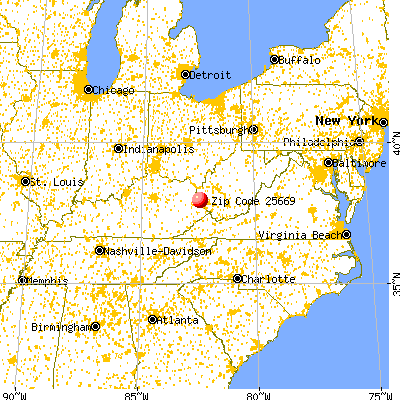


 Nearest zip codes: 25699, 41267, 25674, 41203, 41231, 25511.


 According to the data from the years 2003 - 2018 the average number of fire incidents per year is 11. The highest number of fire incidents - 24 took place in 2005, and the least - 5 in 2006. The data has a decreasing trend.
 When looking into fire subcategories, the most incidents belonged to: Structure Fires (48.6%), and Mobile Property/Vehicle Fires (22.3%).