Estimated zip code population in 2022: 1,870 Zip code population in 2010: 2,103 Zip code population in 2000: 2,358
Houses and condos: 896 Renter-occupied apartments: 190
% of renters here:
28%
State:
26%
March 2022 cost of living index in zip code 26040: 88.1 (less than average, U.S. average is 100)
Land area: 2.3 sq. mi. Water area: 0.3 sq. mi.
Population density: 806 people per square mile
(low).
OSM Map
General Map
Google Map
MSN Map
OSM Map
General Map
Google Map
MSN Map
OSM Map
General Map
Google Map
MSN Map
OSM Map
General Map
Google Map
MSN Map
Please wait while loading the map...
Real estate property taxes paid for housing units in 2022:
This zip code:
0.6% ($589)
West Virginia:
0.5% ($821)
Median real estate property taxes paid for housing units with mortgages in 2022: $771 (0.8%) Median real estate property taxes paid for housing units with no mortgage in 2022: $439 (0.6%)
Business Search- 14 Million verified businesses
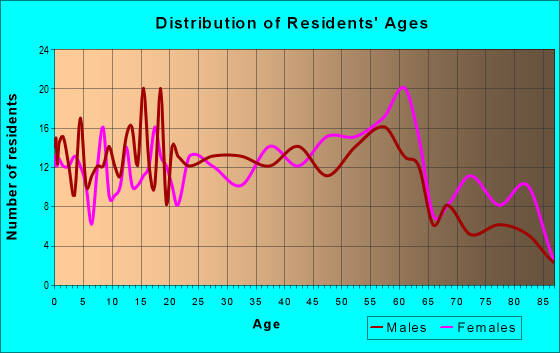
Males: 1,123
(60.1%)
Females: 744
(39.9%)
For population 25 years and over in 26040:
High school or higher: 91.5%
Bachelor's degree or higher: 19.0%
Graduate or professional degree: 5.8%
Unemployed: 3.1%
Mean travel time to work (commute): 24.1 minutes
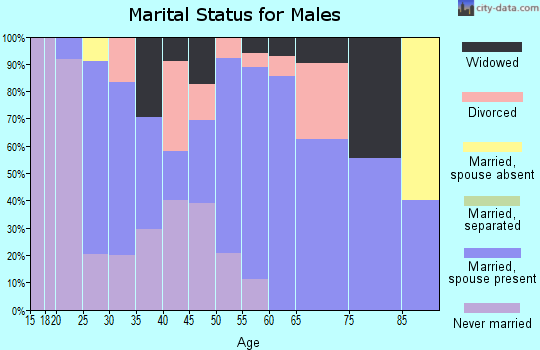
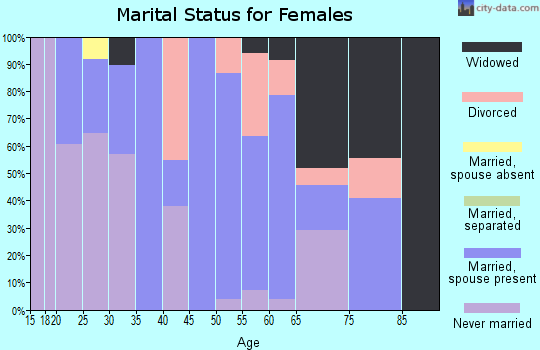
For population 15 years and over in 26040:
Never married: 42.8%
Now married: 34.4%
Separated: 0.0%
Widowed: 7.7%
Divorced: 15.1%
Zip code 26040 compared to state average:
Median house value below state average.
Black race population percentage significantly below state average.
Median age significantly below state average.
Length of stay since moving in significantly above state average.
Estimated median house/condo value in 2022: $91,273
26040:
$91,273
West Virginia:
$155,100
According to our research of West Virginia and other state lists, there were 5 registered sex offenders living in 26040 zip code as of May 20, 2024. The ratio of all residents to sex offenders in zip code 26040 is 370 to 1. The ratio of registered sex offenders to all residents in this zip code is near the state average.
Median resident age:
This zip code:
34.5 years
West Virginia median age:
42.9 years
Average household size:
This zip code:
2.7 people
West Virginia:
2.3 people
Averages for the 2020 tax year for zip code 26040, filed in 2021:
Average Adjusted Gross Income (AGI) in 2020: $42,482 (Individual Income Tax Returns)
Here:
$42,482
State:
$56,292
Salary/wage: $39,600 (reported on 81.9% of returns)
Here:
$39,600
State:
$49,093
(% of AGI for various income ranges: 1028.8% for AGIs below $25k, 3154.8% for AGIs $25k-50k, 5841.0% for AGIs $50k-75k, 9338.0% for AGIs $75k-100k, 16732.5% for AGIs $100k-200k)
Taxable interest for individuals: $353 (reported on 18.1% of returns)
This zip code:
$353
West Virginia:
$1,141
(% of AGI for various income ranges: 8.8% for AGIs below $25k, 9.1% for AGIs $25k-50k, 7.0% for AGIs $50k-75k, 10.0% for AGIs $100k-200k)
Ordinary dividends: $786 (reported on 8.4% of returns)
Here:
$786
State:
$5,456
(% of AGI for various income ranges: 14.8% for AGIs $25k-50k, 42.0% for AGIs $75k-100k)
Net capital gain/loss in AGI: +$1,100 (reported on 4.8% of returns)
Here:
+$1,100
State:
+$11,656
(% of AGI for various income ranges: 44.0% for AGIs $50k-75k)
Profit/loss from business: +$2,733 (reported on 7.2% of returns)
Here:
+$2,733
State:
+$12,084
(% of AGI for various income ranges: 53.8% for AGIs below $25k, 15.2% for AGIs $25k-50k)
Taxable individual retirement arrangement distribution: $11,200 (reported on 7.2% of returns)
26040:
$11,200
West Virginia:
$15,311
(% of AGI for various income ranges: 292.2% for AGIs $25k-50k)
Earned income credit: $2,184 (reported on 22.9% of returns)
Here:
$2,184
State:
$2,258
(% of AGI for various income ranges: 104.2% for AGIs below $25k, 71.7% for AGIs $25k-50k)
Percentage of individuals using paid preparers for their 2020 taxes: 94.0%
Here:
94%
State:
93%
(% for various income ranges: 93.5% for AGIs below $25k, 96.3% for AGIs $25k-50k, 100.0% for AGIs $50k-75k, 85.7% for AGIs $75k-100k, 83.3% for AGIs $100k-200k)
Averages for the 2012 tax year for zip code 26040, filed in 2013:
Average Adjusted Gross Income (AGI) in 2012: $33,451 (Individual Income Tax Returns)
Here:
$33,451
State:
$48,628
Salary/wage: $31,550 (reported on 85.1% of returns)
Here:
$31,550
State:
$42,328
(% of AGI for various income ranges: 77.6% for AGIs below $25k, 79.4% for AGIs $25k-50k, 83.5% for AGIs $50k-75k, 86.5% for AGIs $75k-100k, 73.0% for AGIs $100k-200k)
Taxable interest for individuals: $705 (reported on 23.4% of returns)
This zip code:
$705
West Virginia:
$1,211
(% of AGI for various income ranges: 1.5% for AGIs below $25k, 0.6% for AGIs $25k-50k, 0.2% for AGIs $75k-100k)
Ordinary dividends: $1,033 (reported on 9.6% of returns)
Here:
$1,033
State:
$4,262
(% of AGI for various income ranges: 0.2% for AGIs below $25k, 0.9% for AGIs $25k-50k, 0.1% for AGIs $75k-100k)
Profit/loss from business: +$3,183 (reported on 6.4% of returns)
Here:
+$3,183
State:
+$13,636
Taxable individual retirement arrangement distribution: $5,143 (reported on 7.4% of returns)
26040:
$5,143
West Virginia:
$11,787
Total itemized deductions: $16,667 (20% of AGI, reported on 6.4% of returns)
Here:
$16,667
State:
$21,148
Here:
20.4% of AGI
State:
18.1% of AGI
Charity contributions: $1,850 (reported on 4.3% of returns)
Here:
$1,850
State:
$4,508
Taxes paid: $4,933 (reported on 6.4% of returns)
26040:
$4,933
State:
$8,103
Earned income credit: $2,435 (reported on 21.3% of returns)
Here:
$2,435
State:
$2,140
(% of AGI for various income ranges: 6.4% for AGIs below $25k, 1.4% for AGIs $25k-50k)
Percentage of individuals using paid preparers for their 2012 taxes: 45.7%
Here:
46%
State:
49%
(% for various income ranges: 42.9% for AGIs below $25k, 47.8% for AGIs $25k-50k, 50.0% for AGIs $50k-75k, 83.3% for AGIs $75k-100k)
Averages for the 2004 tax year for zip code 26040, filed in 2005:
Average Adjusted Gross Income (AGI) in 2004: $28,143 (Individual Income Tax Returns)
Here:
$28,143
State:
$37,498
Salary/wage: $27,199 (reported on 82.4% of returns)
Here:
$27,199
State:
$33,645
(% of AGI for various income ranges: 71.8% for AGIs below $10k, 72.6% for AGIs $10k-25k, 81.6% for AGIs $25k-50k, 88.7% for AGIs $50k-75k, 93.7% for AGIs $75k-100k, 53.5% for AGIs over 100k)
Taxable interest for individuals: $1,157 (reported on 35.5% of returns)
This zip code:
$1,157
West Virginia:
$1,465
(% of AGI for various income ranges: 3.5% for AGIs below $10k, 2.6% for AGIs $10k-25k, 1.3% for AGIs $25k-50k, 1.0% for AGIs $50k-75k, 0.4% for AGIs $75k-100k, 0.6% for AGIs over 100k)
Taxable dividends: $1,060 (reported on 13.3% of returns)
Here:
$1,060
State:
$2,913
(% of AGI for various income ranges: 1.0% for AGIs below $10k, 0.9% for AGIs $10k-25k, 0.3% for AGIs $25k-50k, 0.3% for AGIs $50k-75k, 1.0% for AGIs $75k-100k)
Net capital gain/loss: +$1,848 (reported on 7.5% of returns)
Here:
+$1,848
State:
+$6,331
(% of AGI for various income ranges: -2.6% for AGIs below $10k, 0.3% for AGIs $10k-25k, -0.1% for AGIs $25k-50k, 2.3% for AGIs $50k-75k)
Profit/loss from business: +$3,719 (reported on 7.3% of returns)
Here:
+$3,719
State:
+$11,074
IRA payment deduction: $1,467 (reported on 1.7% of returns)
26040:
$1,467
West Virginia:
$2,796
Total itemized deductions: $12,057 (19% of AGI, reported on 6.0% of returns)
Here:
$12,057
State:
$16,976
Here:
18.6% of AGI
State:
19.0% of AGI
Charity contributions deductions: $1,800 (3% of AGI, reported on 4.0% of returns)
Here:
$1,800
State:
$3,529
Here:
2.9% of AGI
State:
3.7% of AGI
Total tax: $3,070 (reported on 68.4% of returns)
26040:
$3,070
State:
$5,372
(% of AGI for various income ranges: 1.1% for AGIs below $10k, 3.9% for AGIs $10k-25k, 6.8% for AGIs $25k-50k, 8.9% for AGIs $50k-75k, 10.6% for AGIs $75k-100k, 14.8% for AGIs over 100k)
Earned income credit: $1,612 (reported on 20.8% of returns)
Here:
$1,612
State:
$1,662
Percentage of individuals using paid preparers for their 2004 taxes: 52.0%
Here:
52%
State:
55%
(% for various income ranges: 46.6% for AGIs below $10k, 52.0% for AGIs $10k-25k, 56.3% for AGIs $25k-50k, 55.4% for AGIs $50k-75k, 76.9% for AGIs $75k-100k)
Likely homosexual households (counted as self-reported same-sex unmarried-partner households)
Lesbian couples: 1.0% of all households
Gay men: 0.0% of all households
Household received Food Stamps/SNAP in the past 12 months: 211 Household did not receive Food Stamps/SNAP in the past 12 months: 484
Women who had a birth in the past 12 months: 15 (14 now married, 0 unmarried) Women who did not have a birth in the past 12 months: 299 (85 now married, 214 unmarried)
Housing units in zip code 26040 with a mortgage: 248 (28 second mortgage, 28 both second mortgage and home equity loan) Houses without a mortgage: 8
Median monthly owner costs for units with a mortgage: $925 Median monthly owner costs for units without a mortgage: $342
Residents with income below the poverty level in 2022:
This zip code:
31.0%
Whole state:
17.9%
Residents with income below 50% of the poverty level in 2022:
This zip code:
15.4%
Whole state:
9.7%
Median number of rooms in houses and condos:
Here:
6.0
State:
6.5
Median number of rooms in apartments:
Here:
5.3
State:
4.7
Notable locations in this zip code not listed on our city pages
Notable locations in zip code 26040: McMechen City Hall (A), Benwood-McMechen Public Library (B), McMechen Volunteer Fire Department (C). Display/hide their locations on the map
Churches in zip code 26040 include: Saint James Roman Catholic Church (A), McMechen United Methodist Church (B), First Church of God (C), First Christian Church (D), Church of the Nazarene (E), Church of Christ (F), Charity Independent Baptist Church (G). Display/hide their locations on the map
123 married couples with children.
308 single-parent households (28 men, 280 women).
98.0% of residents of 26040 zip code speak English at home.
1.4% of residents speak Spanish at home (40% very well, 60% well).
0.2% of residents speak Asian or Pacific Island language at home (100% very well).
Foreign born population: 27 (1.5%) (92.5% of them are naturalized citizens)
This zip code:
1.5%
Whole state:
1.8%
58%Azores Islands
17%Guyana
12%Ukraine
4%Hong Kong
4%Bhutan
4%Somalia
22%English
18%Scottish
13%American
10%German
6%Polish
4%Italian
4%Irish
Year of entry for the foreign-born population
42010 or later
72000 to 2009
11990 to 1999
23Before 1990
Facilities with environmental interests located in this zip code:
CITY OF MCMECHEN (47 NINTH STREET in MCMECHEN, WV)
(Integrated Compliance Information System) - ICIS-03-2002-0290, FORMAL ENFORCEMENT ACTION National Pollutant Discharge Elimination System NON-MAJOR (Tracking pollutant discharge elimination systems) - permit Business SIC classification: SEWERAGE SYSTEMS; GENERAL GOVERNMENT Organizations: MCMECHEN CITY OF (CONTACT/OWNER)
Alternative names: MCMECHEN, WEST VIRGINIA
CENTER MCMECHEN ELEMENTARY SCHOOL (800 MARSHALL ST in MC MECHEN, WV)
(National Center for Education Statistics) - STATE ID-48206 Organizations: MARSHALL COUNTY SCHOOL DIST (SCHOOL DISTRICT)
ARROW CONCRETE (ROUTE 2, BALTIMORE AVE. in MC MECHEN, WV)
National Pollutant Discharge Elimination System NON-MAJOR (Tracking pollutant discharge elimination systems) - permit Conditionally Exempt Small Quantity Generators, less than 100 kg/month of hazardous waste (Resource Conservation and Recovery Act (tracking hazardous waste)) - notification Business SIC classification: CONCRETE PRODUCTS, EXCEPT BLOCK AND BRICK
BISHOP DONAHUE MEMORIAL HIGH (325 LOGAN STREET in MCMECHEN, WV)
COMPLIANCE ACTIVITY (Tracking inspections of insecticide, fungicide, and rodenticide, and toxic substances) Alternative names: BISHOP DONAHUE HIGH SCHOOL
BISHOP DONAHUE HIGH SCHOOL (325 LOGAN STREET in MCMEEHAN, WV)
COMPLIANCE ACTIVITY (Tracking inspections of insecticide, fungicide, and rodenticide, and toxic substances)
Housing units lacking complete plumbing facilities: 8.4% Housing units lacking complete kitchen facilities: 5.6%
74.8%Utility gas
19.1%Electricity
3.3%Fuel oil, kerosene, etc.
2.4%Wood
Population in 1990: 2,130. Population change in the 1990s: +228 (+10.7%).
Place of birth for U.S.-born residents:
This state: 1,425
Northeast: 100
Midwest: 184
South: 93
West: 14
67% of the 26040 zip code residents lived in the same house 5 years ago. Out of people who lived in different houses, 62% lived in this county. Out of people who lived in different counties, 50% lived in West Virginia.
88% of the 26040 zip code residents lived in the same house 1 year ago. Out of people who lived in different houses, 37% moved from this county. Out of people who lived in different houses, 39% moved from different county within same state. Out of people who lived in different houses, 23% moved from different state.
Private vs. public school enrollment:
Students in private schools in grades 1 to 8 (elementary and middle school):
Here:
0.0%
West Virginia:
12.2%
Students in private schools in grades 9 to 12 (high school): 33
Here:
25.4%
West Virginia:
8.8%
Students in private undergraduate colleges: 23
Here:
48.6%
West Virginia:
17.3%
Occupation by median earnings in the past 12 months ($)
129,915Health diagnosing and treating practitioners and other technical occupations
72,733Education, training, and library occupations
72,307Transportation occupations
71,238Construction and extraction occupations
69,103Business and financial operations occupations
46,928Arts, design, entertainment, sports, and media occupations
Top industries in this zip code by the number of employees in 2005:
Educational Services: Elementary and Secondary Schools (20-49 employees: 1 establishment)
Health Care and Social Assistance: Home Health Care Services (20-49: 1)
Health Care and Social Assistance: Residential Mental Retardation Facilities (10-19: 1)
Administrative and Support and Waste Management and Remediation Services: Exterminating and Pest Control Services (10-19: 1)
Finance and Insurance: Commercial Banking (5-9: 1)
Other Services (except Public Administration): Funeral Homes and Funeral Services (5-9: 1)
People in group quarters in 2010:
8 people in group homes intended for adults
People in group quarters in 2000:
7 people in homes for the mentally retarded
2 people in religious group quarters
Home Mortgage Disclosure Act Aggregated Statistics For Year 2009 (Based on 4 partial tracts)
A) FHA, FSA/RHS & VA Home Purchase Loans
B) Conventional Home Purchase Loans
C) Refinancings
D) Home Improvement Loans
E) Loans on Dwellings For 5+ Families
F) Non-occupant Loans on < 5 Family Dwellings (A B C & D)
G) Loans On Manufactured Home Dwelling (A B C & D)
Number
Average Value
Number
Average Value
Number
Average Value
Number
Average Value
Number
Average Value
Number
Average Value
Number
Average Value
LOANS ORIGINATED
14
$64,465
17
$70,611
36
$91,650
8
$26,031
1
$82,400
10
$36,205
2
$21,715
APPLICATIONS APPROVED, NOT ACCEPTED
0
$0
0
$0
2
$113,010
0
$0
0
$0
0
$0
0
$0
APPLICATIONS DENIED
3
$62,397
5
$44,124
16
$80,194
5
$15,012
0
$0
1
$54,760
1
$63,580
APPLICATIONS WITHDRAWN
3
$40,100
2
$66,215
14
$61,321
0
$0
0
$0
0
$0
0
$0
FILES CLOSED FOR INCOMPLETENESS
2
$66,220
0
$0
1
$177,710
0
$0
0
$0
0
$0
0
$0
Aggregated Statistics For Year 2008 (Based on 4 partial tracts)
A) FHA, FSA/RHS & VA Home Purchase Loans
B) Conventional Home Purchase Loans
C) Refinancings
D) Home Improvement Loans
F) Non-occupant Loans on < 5 Family Dwellings (A B C & D)
G) Loans On Manufactured Home Dwelling (A B C & D)
Number
Average Value
Number
Average Value
Number
Average Value
Number
Average Value
Number
Average Value
Number
Average Value
LOANS ORIGINATED
15
$72,499
18
$58,457
28
$69,349
14
$24,761
6
$39,458
1
$71,790
APPLICATIONS APPROVED, NOT ACCEPTED
1
$65,680
2
$41,795
3
$72,713
3
$13,557
1
$17,910
0
$0
APPLICATIONS DENIED
4
$56,788
5
$90,384
31
$64,636
9
$40,196
1
$159,100
2
$45,800
APPLICATIONS WITHDRAWN
0
$0
5
$64,814
13
$80,058
1
$87,000
1
$86,090
0
$0
FILES CLOSED FOR INCOMPLETENESS
0
$0
1
$94,340
0
$0
0
$0
0
$0
0
$0
Aggregated Statistics For Year 2007 (Based on 4 partial tracts)
A) FHA, FSA/RHS & VA Home Purchase Loans
B) Conventional Home Purchase Loans
C) Refinancings
D) Home Improvement Loans
F) Non-occupant Loans on < 5 Family Dwellings (A B C & D)
G) Loans On Manufactured Home Dwelling (A B C & D)
Number
Average Value
Number
Average Value
Number
Average Value
Number
Average Value
Number
Average Value
Number
Average Value
LOANS ORIGINATED
8
$61,638
32
$67,084
32
$64,984
20
$28,224
12
$40,913
1
$45,330
APPLICATIONS APPROVED, NOT ACCEPTED
0
$0
1
$89,740
6
$46,085
7
$33,240
0
$0
1
$91,870
APPLICATIONS DENIED
3
$52,550
6
$47,798
35
$56,251
12
$30,343
2
$36,710
1
$57,190
APPLICATIONS WITHDRAWN
1
$52,930
6
$53,830
19
$52,635
3
$41,613
1
$63,920
0
$0
FILES CLOSED FOR INCOMPLETENESS
0
$0
0
$0
5
$67,792
0
$0
0
$0
0
$0
Aggregated Statistics For Year 2006 (Based on 4 partial tracts)
A) FHA, FSA/RHS & VA Home Purchase Loans
B) Conventional Home Purchase Loans
C) Refinancings
D) Home Improvement Loans
F) Non-occupant Loans on < 5 Family Dwellings (A B C & D)
G) Loans On Manufactured Home Dwelling (A B C & D)
Number
Average Value
Number
Average Value
Number
Average Value
Number
Average Value
Number
Average Value
Number
Average Value
LOANS ORIGINATED
7
$69,241
42
$70,655
32
$51,184
17
$15,276
9
$65,488
1
$38,620
APPLICATIONS APPROVED, NOT ACCEPTED
0
$0
1
$64,490
5
$31,098
1
$28,230
0
$0
0
$0
APPLICATIONS DENIED
1
$72,850
12
$45,048
26
$61,042
17
$32,038
1
$35,590
3
$33,520
APPLICATIONS WITHDRAWN
0
$0
4
$45,795
10
$59,900
0
$0
1
$47,770
1
$35,830
FILES CLOSED FOR INCOMPLETENESS
0
$0
0
$0
0
$0
0
$0
0
$0
0
$0
Aggregated Statistics For Year 2005 (Based on 4 partial tracts)
A) FHA, FSA/RHS & VA Home Purchase Loans
B) Conventional Home Purchase Loans
C) Refinancings
D) Home Improvement Loans
F) Non-occupant Loans on < 5 Family Dwellings (A B C & D)
G) Loans On Manufactured Home Dwelling (A B C & D)
Number
Average Value
Number
Average Value
Number
Average Value
Number
Average Value
Number
Average Value
Number
Average Value
LOANS ORIGINATED
6
$60,810
33
$60,126
27
$62,832
20
$20,008
11
$30,633
3
$95,627
APPLICATIONS APPROVED, NOT ACCEPTED
1
$85,590
3
$30,390
7
$59,464
1
$29,810
0
$0
1
$42,990
APPLICATIONS DENIED
1
$24,340
3
$41,877
33
$51,572
16
$20,434
2
$41,980
1
$17,640
APPLICATIONS WITHDRAWN
2
$88,970
2
$48,270
13
$65,614
3
$13,970
0
$0
0
$0
FILES CLOSED FOR INCOMPLETENESS
0
$0
1
$27,470
1
$122,600
0
$0
1
$27,470
0
$0
Aggregated Statistics For Year 2004 (Based on 4 partial tracts)
A) FHA, FSA/RHS & VA Home Purchase Loans
B) Conventional Home Purchase Loans
C) Refinancings
D) Home Improvement Loans
F) Non-occupant Loans on < 5 Family Dwellings (A B C & D)
G) Loans On Manufactured Home Dwelling (A B C & D)
Number
Average Value
Number
Average Value
Number
Average Value
Number
Average Value
Number
Average Value
Number
Average Value
LOANS ORIGINATED
7
$44,133
26
$59,507
54
$62,072
16
$13,914
6
$51,218
2
$46,070
APPLICATIONS APPROVED, NOT ACCEPTED
0
$0
6
$54,992
9
$50,708
4
$15,458
0
$0
0
$0
APPLICATIONS DENIED
2
$85,010
5
$73,598
24
$62,025
12
$23,268
0
$0
0
$0
APPLICATIONS WITHDRAWN
0
$0
5
$70,122
14
$67,883
1
$33,460
1
$22,820
0
$0
FILES CLOSED FOR INCOMPLETENESS
0
$0
0
$0
1
$128,070
1
$50,190
0
$0
0
$0
Aggregated Statistics For Year 2003 (Based on 4 partial tracts)
A) FHA, FSA/RHS & VA Home Purchase Loans
B) Conventional Home Purchase Loans
C) Refinancings
D) Home Improvement Loans
F) Non-occupant Loans on < 5 Family Dwellings (A B C & D)
Number
Average Value
Number
Average Value
Number
Average Value
Number
Average Value
Number
Average Value
LOANS ORIGINATED
8
$56,851
32
$51,708
80
$61,882
13
$13,396
7
$26,530
APPLICATIONS APPROVED, NOT ACCEPTED
0
$0
0
$0
12
$54,165
1
$5,970
0
$0
APPLICATIONS DENIED
1
$68,640
5
$40,544
34
$49,045
5
$11,280
0
$0
APPLICATIONS WITHDRAWN
1
$85,980
3
$78,513
20
$55,229
1
$47,770
0
$0
FILES CLOSED FOR INCOMPLETENESS
0
$0
0
$0
5
$67,058
0
$0
0
$0
Aggregated Statistics For Year 2002 (Based on 4 partial tracts)
A) FHA, FSA/RHS & VA Home Purchase Loans
B) Conventional Home Purchase Loans
C) Refinancings
D) Home Improvement Loans
F) Non-occupant Loans on < 5 Family Dwellings (A B C & D)
Number
Average Value
Number
Average Value
Number
Average Value
Number
Average Value
Number
Average Value
LOANS ORIGINATED
2
$60,535
37
$54,936
66
$59,044
16
$14,605
9
$52,224
APPLICATIONS APPROVED, NOT ACCEPTED
0
$0
2
$58,795
12
$45,562
1
$14,910
1
$42,020
APPLICATIONS DENIED
1
$51,410
9
$40,106
44
$48,796
7
$17,120
2
$44,850
APPLICATIONS WITHDRAWN
0
$0
3
$42,623
15
$59,747
0
$0
1
$44,280
FILES CLOSED FOR INCOMPLETENESS
0
$0
0
$0
10
$62,590
0
$0
0
$0
Aggregated Statistics For Year 2001 (Based on 4 partial tracts)
A) FHA, FSA/RHS & VA Home Purchase Loans
B) Conventional Home Purchase Loans
C) Refinancings
D) Home Improvement Loans
F) Non-occupant Loans on < 5 Family Dwellings (A B C & D)
Number
Average Value
Number
Average Value
Number
Average Value
Number
Average Value
Number
Average Value
LOANS ORIGINATED
2
$59,000
28
$52,537
50
$51,992
17
$21,066
11
$37,858
APPLICATIONS APPROVED, NOT ACCEPTED
0
$0
6
$32,748
15
$46,042
5
$23,376
1
$15,520
APPLICATIONS DENIED
0
$0
6
$36,798
42
$51,543
8
$10,166
3
$29,227
APPLICATIONS WITHDRAWN
0
$0
2
$48,975
28
$45,385
1
$24,640
0
$0
FILES CLOSED FOR INCOMPLETENESS
0
$0
0
$0
9
$69,140
0
$0
0
$0
Aggregated Statistics For Year 2000 (Based on 4 partial tracts)
A) FHA, FSA/RHS & VA Home Purchase Loans
B) Conventional Home Purchase Loans
C) Refinancings
D) Home Improvement Loans
F) Non-occupant Loans on < 5 Family Dwellings (A B C & D)
Number
Average Value
Number
Average Value
Number
Average Value
Number
Average Value
Number
Average Value
LOANS ORIGINATED
1
$51,710
36
$45,381
34
$46,289
26
$11,252
9
$27,837
APPLICATIONS APPROVED, NOT ACCEPTED
0
$0
3
$73,527
9
$46,786
1
$9,550
0
$0
APPLICATIONS DENIED
1
$39,240
16
$31,681
38
$42,612
18
$14,969
2
$33,200
APPLICATIONS WITHDRAWN
1
$57,320
2
$22,720
20
$45,912
3
$26,863
0
$0
FILES CLOSED FOR INCOMPLETENESS
0
$0
0
$0
7
$45,299
0
$0
0
$0
Aggregated Statistics For Year 1999 (Based on 2 partial tracts)
B) Conventional Home Purchase Loans
C) Refinancings
D) Home Improvement Loans
F) Non-occupant Loans on < 5 Family Dwellings (A B C & D)
Detailed PMIC statistics for the following Tracts:0206.00
, 0211.00
2003 - 2018 National Fire Incident Reporting System (NFIRS) incidents
According to the data from the years 2003 - 2018 the average number of fire incidents per year is 10. The highest number of reported fire incidents - 25 took place in 2017, and the least - 2 in 2006. The data has a growing trend.
When looking into fire subcategories, the most reports belonged to: Structure Fires (66.9%), and Outside Fires (18.8%).
Fire incident types reported to NFIRS in Zip Code 26040


 Nearest zip codes: 26031, 26038, 43906, 43947, 26041, 26003.


 According to the data from the years 2003 - 2018 the average number of fire incidents per year is 10. The highest number of reported fire incidents - 25 took place in 2017, and the least - 2 in 2006. The data has a growing trend.
 When looking into fire subcategories, the most reports belonged to: Structure Fires (66.9%), and Outside Fires (18.8%).