Estimated zip code population in 2022: 5,649 Zip code population in 2010: 6,222 Zip code population in 2000: 6,555
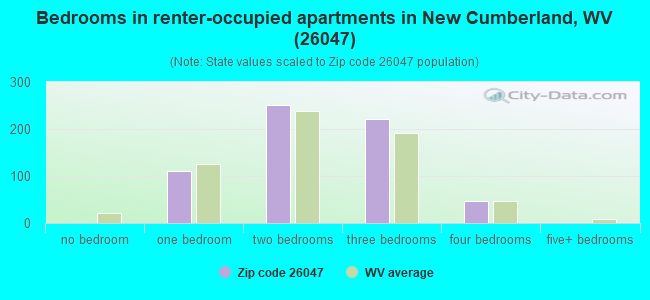
Houses and condos: 2,800 Renter-occupied apartments: 624
% of renters here:
25%
State:
26%
March 2022 cost of living index in zip code 26047: 83.8 (less than average, U.S. average is 100)
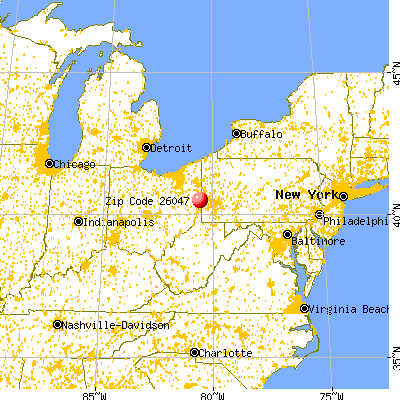
Land area: 42.8 sq. mi. Water area: 1.3 sq. mi.
Population density: 132 people per square mile
(very low).
OSM Map
General Map
Google Map
MSN Map
OSM Map
General Map
Google Map
MSN Map
OSM Map
General Map
Google Map
MSN Map
OSM Map
General Map
Google Map
MSN Map
Please wait while loading the map...
Real estate property taxes paid for housing units in 2022:
This zip code:
0.6% ($724)
West Virginia:
0.5% ($821)
Median real estate property taxes paid for housing units with mortgages in 2022: $849 (0.6%) Median real estate property taxes paid for housing units with no mortgage in 2022: $604 (0.5%)
Business Search- 14 Million verified businesses
Males: 3,026
(53.6%)
Females: 2,620
(46.4%)
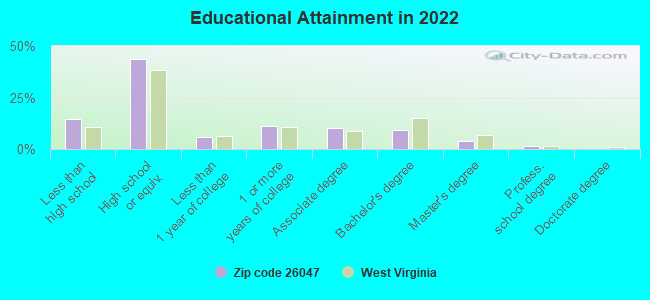
For population 25 years and over in 26047:
High school or higher: 84.7%
Bachelor's degree or higher: 14.4%
Graduate or professional degree: 5.1%
Unemployed: 4.0%
Mean travel time to work (commute): 28.6 minutes
For population 15 years and over in 26047:
Never married: 26.5%
Now married: 53.4%
Separated: 0.9%
Widowed: 8.2%
Divorced: 11.1%
Zip code 26047 compared to state average:
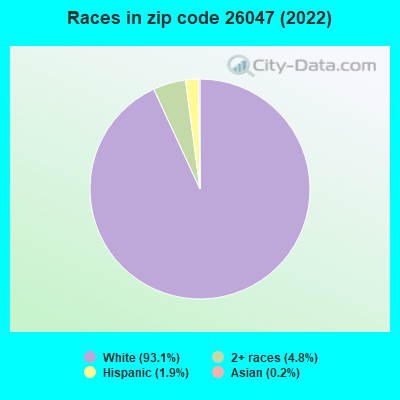
Black race population percentage significantly below state average.
Median age above state average.
Foreign-born population percentage significantly below state average.
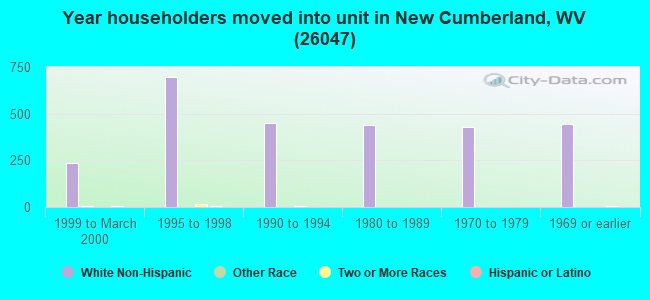
Length of stay since moving in above state average.
Number of college students below state average.
Percentage of population with a bachelor's degree or higher below state average.
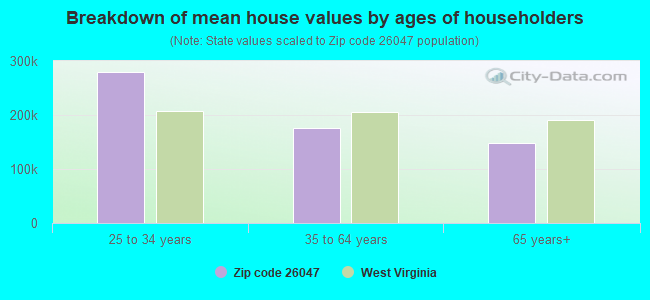
Estimated median house/condo value in 2022: $128,080
26047:
$128,080
West Virginia:
$155,100
According to our research of West Virginia and other state lists, there were 16 registered sex offenders living in 26047 zip code as of June 19, 2024. The ratio of all residents to sex offenders in zip code 26047 is 387 to 1. The ratio of registered sex offenders to all residents in this zip code is near the state average.
Median resident age:
This zip code:
47.4 years
West Virginia median age:
42.9 years
Average household size:
This zip code:
2.3 people
West Virginia:
2.3 people
Averages for the 2020 tax year for zip code 26047, filed in 2021:
Average Adjusted Gross Income (AGI) in 2020: $56,569 (Individual Income Tax Returns)
Here:
$56,569
State:
$56,292
Salary/wage: $50,912 (reported on 77.9% of returns)
Here:
$50,912
State:
$49,093
(% of AGI for various income ranges: 1028.3% for AGIs below $25k, 3057.1% for AGIs $25k-50k, 5846.7% for AGIs $50k-75k, 8455.0% for AGIs $75k-100k, 14191.5% for AGIs $100k-200k)
Taxable interest for individuals: $581 (reported on 27.7% of returns)
This zip code:
$581
West Virginia:
$1,141
(% of AGI for various income ranges: 12.0% for AGIs below $25k, 19.3% for AGIs $25k-50k, 21.5% for AGIs $50k-75k, 30.0% for AGIs $75k-100k, 27.8% for AGIs $100k-200k)
Ordinary dividends: $2,522 (reported on 11.8% of returns)
Here:
$2,522
State:
$5,456
(% of AGI for various income ranges: 11.2% for AGIs below $25k, 17.6% for AGIs $25k-50k, 26.7% for AGIs $50k-75k, 46.4% for AGIs $75k-100k, 165.9% for AGIs $100k-200k)
Net capital gain/loss in AGI: +$4,493 (reported on 10.3% of returns)
Here:
+$4,493
State:
+$11,656
(% of AGI for various income ranges: 7.8% for AGIs below $25k, 10.2% for AGIs $25k-50k, 55.8% for AGIs $50k-75k, 84.1% for AGIs $75k-100k, 290.0% for AGIs $100k-200k)
Profit/loss from business: +$7,844 (reported on 9.2% of returns)
Here:
+$7,844
State:
+$12,084
(% of AGI for various income ranges: 37.2% for AGIs below $25k, 51.8% for AGIs $25k-50k, 51.5% for AGIs $50k-75k, 80.0% for AGIs $75k-100k, 404.4% for AGIs $100k-200k)
Taxable individual retirement arrangement distribution: $12,000 (reported on 10.7% of returns)
26047:
$12,000
West Virginia:
$15,311
(% of AGI for various income ranges: 50.9% for AGIs below $25k, 117.5% for AGIs $25k-50k, 190.9% for AGIs $50k-75k, 265.0% for AGIs $75k-100k, 479.6% for AGIs $100k-200k)
Total itemized deductions: $33,850 (reported on 1.5% of returns)
Here:
$33,850
State:
$31,950
(% of AGI for various income ranges: 501.5% for AGIs $100k-200k)
Charity contributions: $7,867 (reported on 1.1% of returns)
Here:
$7,867
State:
$12,364
(% of AGI for various income ranges: 107.3% for AGIs $75k-100k)
Taxes paid: $7,650 (reported on 1.5% of returns)
26047:
$7,650
State:
$7,665
(% of AGI for various income ranges: 113.3% for AGIs $100k-200k)
Earned income credit: $2,180 (reported on 12.9% of returns)
Here:
$2,180
State:
$2,258
(% of AGI for various income ranges: 73.3% for AGIs below $25k, 53.5% for AGIs $25k-50k)
Percentage of individuals using paid preparers for their 2020 taxes: 92.6%
Here:
93%
State:
93%
(% for various income ranges: 91.0% for AGIs below $25k, 92.6% for AGIs $25k-50k, 93.0% for AGIs $50k-75k, 93.1% for AGIs $75k-100k, 94.7% for AGIs $100k-200k, 100.0% for AGIs over 200k)
Averages for the 2012 tax year for zip code 26047, filed in 2013:
Average Adjusted Gross Income (AGI) in 2012: $51,936 (Individual Income Tax Returns)
Here:
$51,936
State:
$48,628
Salary/wage: $41,434 (reported on 82.1% of returns)
Here:
$41,434
State:
$42,328
(% of AGI for various income ranges: 66.0% for AGIs below $25k, 74.3% for AGIs $25k-50k, 75.5% for AGIs $50k-75k, 74.6% for AGIs $75k-100k, 70.5% for AGIs $100k-200k, 23.6% for AGIs over 200k)
Taxable interest for individuals: $685 (reported on 34.1% of returns)
This zip code:
$685
West Virginia:
$1,211
(% of AGI for various income ranges: 1.1% for AGIs below $25k, 0.5% for AGIs $25k-50k, 0.3% for AGIs $50k-75k, 0.6% for AGIs $75k-100k, 0.4% for AGIs $100k-200k)
Ordinary dividends: $1,272 (reported on 13.2% of returns)
Here:
$1,272
State:
$4,262
(% of AGI for various income ranges: 0.7% for AGIs below $25k, 0.3% for AGIs $25k-50k, 0.3% for AGIs $50k-75k, 0.2% for AGIs $75k-100k, 0.5% for AGIs $100k-200k)
Net capital gain/loss in AGI: +$1,738 (reported on 7.7% of returns)
Here:
+$1,738
State:
+$8,875
(% of AGI for various income ranges: 0.6% for AGIs $25k-50k, 0.3% for AGIs $75k-100k, 0.5% for AGIs $100k-200k)
Profit/loss from business: +$5,971 (reported on 10.3% of returns)
Here:
+$5,971
State:
+$13,636
(% of AGI for various income ranges: 4.4% for AGIs below $25k, 1.6% for AGIs $25k-50k, 0.7% for AGIs $50k-75k, 0.5% for AGIs $75k-100k, 1.1% for AGIs $100k-200k)
Taxable individual retirement arrangement distribution: $7,615 (reported on 9.5% of returns)
26047:
$7,615
West Virginia:
$11,787
(% of AGI for various income ranges: 2.8% for AGIs below $25k, 1.3% for AGIs $25k-50k, 1.4% for AGIs $50k-75k, 2.0% for AGIs $75k-100k, 1.3% for AGIs $100k-200k)
Total itemized deductions: $18,807 (17% of AGI, reported on 15.8% of returns)
Here:
$18,807
State:
$21,148
Here:
16.7% of AGI
State:
18.1% of AGI
(% of AGI for various income ranges: 3.0% for AGIs below $25k, 3.1% for AGIs $25k-50k, 5.2% for AGIs $50k-75k, 6.5% for AGIs $75k-100k, 7.4% for AGIs $100k-200k, 7.5% for AGIs over 200k)
Charity contributions: $3,003 (reported on 10.6% of returns)
Here:
$3,003
State:
$4,508
(% of AGI for various income ranges: 0.5% for AGIs $25k-50k, 0.6% for AGIs $50k-75k, 0.8% for AGIs $75k-100k, 0.9% for AGIs $100k-200k, 0.5% for AGIs over 200k)
Taxes paid: $7,516 (reported on 15.8% of returns)
26047:
$7,516
State:
$8,103
(% of AGI for various income ranges: 0.3% for AGIs below $25k, 0.6% for AGIs $25k-50k, 1.5% for AGIs $50k-75k, 2.3% for AGIs $75k-100k, 3.5% for AGIs $100k-200k, 4.5% for AGIs over 200k)
Earned income credit: $2,163 (reported on 16.8% of returns)
Here:
$2,163
State:
$2,140
(% of AGI for various income ranges: 5.9% for AGIs below $25k, 0.9% for AGIs $25k-50k)
Percentage of individuals using paid preparers for their 2012 taxes: 61.9%
Here:
62%
State:
49%
(% for various income ranges: 56.2% for AGIs below $25k, 60.9% for AGIs $25k-50k, 64.1% for AGIs $50k-75k, 65.5% for AGIs $75k-100k, 73.1% for AGIs $100k-200k, 100.0% for AGIs over 200k)
Averages for the 2004 tax year for zip code 26047, filed in 2005:
Average Adjusted Gross Income (AGI) in 2004: $37,920 (Individual Income Tax Returns)
Here:
$37,920
State:
$37,498
Salary/wage: $34,287 (reported on 82.9% of returns)
Here:
$34,287
State:
$33,645
(% of AGI for various income ranges: 84.2% for AGIs below $10k, 65.9% for AGIs $10k-25k, 79.5% for AGIs $25k-50k, 81.1% for AGIs $50k-75k, 84.3% for AGIs $75k-100k, 52.0% for AGIs over 100k)
Taxable interest for individuals: $781 (reported on 50.4% of returns)
This zip code:
$781
West Virginia:
$1,465
(% of AGI for various income ranges: 4.3% for AGIs below $10k, 2.3% for AGIs $10k-25k, 1.1% for AGIs $25k-50k, 0.9% for AGIs $50k-75k, 0.6% for AGIs $75k-100k, 0.2% for AGIs over 100k)
Taxable dividends: $1,072 (reported on 16.0% of returns)
Here:
$1,072
State:
$2,913
(% of AGI for various income ranges: 2.4% for AGIs below $10k, 0.7% for AGIs $10k-25k, 0.4% for AGIs $25k-50k, 0.5% for AGIs $50k-75k, 0.3% for AGIs $75k-100k, 0.2% for AGIs over 100k)
Net capital gain/loss: +$412 (reported on 13.5% of returns)
Here:
+$412
State:
+$6,331
(% of AGI for various income ranges: -1.4% for AGIs below $10k, -0.2% for AGIs $10k-25k, -0.1% for AGIs $25k-50k, 0.2% for AGIs $50k-75k, -0.0% for AGIs $75k-100k, 1.2% for AGIs over 100k)
Profit/loss from business: +$7,898 (reported on 11.7% of returns)
Here:
+$7,898
State:
+$11,074
(% of AGI for various income ranges: 5.3% for AGIs below $10k, 3.4% for AGIs $10k-25k, 0.4% for AGIs $25k-50k, 2.2% for AGIs $50k-75k, 1.6% for AGIs $75k-100k, 5.8% for AGIs over 100k)
IRA payment deduction: $2,800 (reported on 3.0% of returns)
26047:
$2,800
West Virginia:
$2,796
Total itemized deductions: $15,440 (18% of AGI, reported on 13.7% of returns)
Here:
$15,440
State:
$16,976
Here:
18.0% of AGI
State:
19.0% of AGI
(% of AGI for various income ranges: 3.1% for AGIs $10k-25k, 3.5% for AGIs $25k-50k, 6.1% for AGIs $50k-75k, 7.5% for AGIs $75k-100k, 8.6% for AGIs over 100k)
Charity contributions deductions: $2,500 (3% of AGI, reported on 11.1% of returns)
Here:
$2,500
State:
$3,529
Here:
2.7% of AGI
State:
3.7% of AGI
(% of AGI for various income ranges: 0.4% for AGIs $10k-25k, 0.3% for AGIs $25k-50k, 1.0% for AGIs $50k-75k, 1.1% for AGIs $75k-100k, 0.9% for AGIs over 100k)
Total tax: $4,251 (reported on 74.0% of returns)
26047:
$4,251
State:
$5,372
(% of AGI for various income ranges: 2.9% for AGIs below $10k, 3.6% for AGIs $10k-25k, 6.3% for AGIs $25k-50k, 8.8% for AGIs $50k-75k, 10.9% for AGIs $75k-100k, 12.1% for AGIs over 100k)
Earned income credit: $1,710 (reported on 15.8% of returns)
Here:
$1,710
State:
$1,662
Percentage of individuals using paid preparers for their 2004 taxes: 59.9%
Here:
60%
State:
55%
(% for various income ranges: 51.4% for AGIs below $10k, 60.6% for AGIs $10k-25k, 61.1% for AGIs $25k-50k, 62.9% for AGIs $50k-75k, 65.0% for AGIs $75k-100k, 70.9% for AGIs over 100k)
Likely homosexual households (counted as self-reported same-sex unmarried-partner households)
Lesbian couples: 0.3% of all households
Gay men: 0.0% of all households
Household received Food Stamps/SNAP in the past 12 months: 561 Household did not receive Food Stamps/SNAP in the past 12 months: 1,918
Women who had a birth in the past 12 months: 49 (45 now married, 4 unmarried) Women who did not have a birth in the past 12 months: 1,142 (529 now married, 612 unmarried)
Housing units in zip code 26047 with a mortgage: 771 (75 second mortgage, 75 both second mortgage and home equity loan) Houses without a mortgage: 12
Median monthly owner costs for units with a mortgage: $1,092 Median monthly owner costs for units without a mortgage: $318
Residents with income below the poverty level in 2022:
This zip code:
14.9%
Whole state:
17.9%
Residents with income below 50% of the poverty level in 2022:
This zip code:
6.4%
Whole state:
9.7%
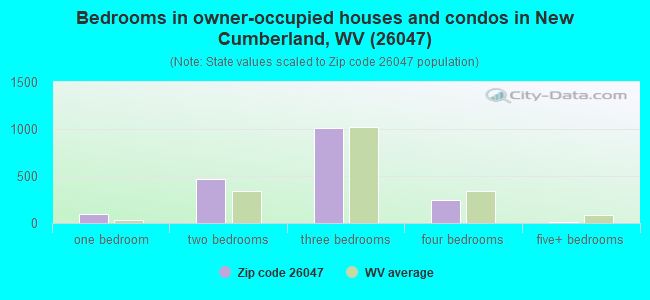
Median number of rooms in houses and condos:
Here:
6.2
State:
6.5
Median number of rooms in apartments:
Here:
4.4
State:
4.7
Notable locations in this zip code not listed on our city pages
Notable locations in zip code 26047: Freemans Landing (A), Mountaineer Woodview Golf Course (B), Pleasant Hills Golf Course (C), Arroyo (D), New Manchester Volunteer Fire Department (E), Mahan Light (F), Swaney Memorial Library (G), Oakland District Volunteer Fire Department (H), New Cumberland Fire Department (I), New Cumberland Ambulance Service Incorporated (J). Display/hide their locations on the map
Streams, rivers, and creeks: Tomlinson Run (A), Mercer Run (B), Langfitt Run (C), Holbert Run (D), Herron Run (E), Hardin Run (F), Deep Gut Run (G), Whiteoak Run (H). Display/hide their locations on the map
Parks in zip code 26047 include: Tomlinson Run State Park (1), Hillcrest Wildlife Management Area (2), Waterford Park (3). Display/hide their locations on the map
Size of family households: 837 2-persons, 326 3-persons, 301 4-persons, 169 5-persons
Size of nonfamily households: 703 1-person, 83 2-persons, 24 5-persons
581 married couples with children.
331 single-parent households (72 men, 259 women).
99.1% of residents of 26047 zip code speak English at home.
0.3% of residents speak Spanish at home (12% very well, 88% well).
0.6% of residents speak other Indo-European language at home (100% well).
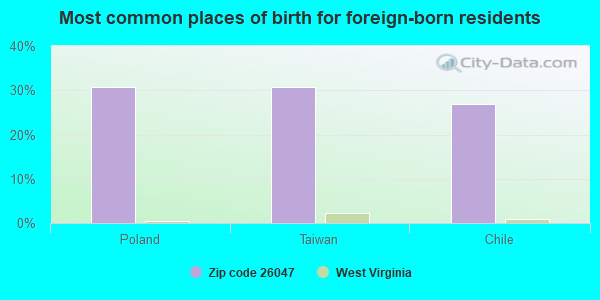
Foreign born population: 28 (0.5%) (41.2% of them are naturalized citizens)
This zip code:
0.5%
Whole state:
1.8%
31%Poland
31%Taiwan
27%Chile
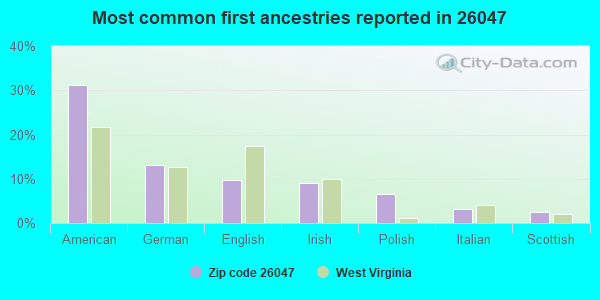
31%American
13%German
10%English
9%Irish
7%Polish
3%Italian
2%Scottish
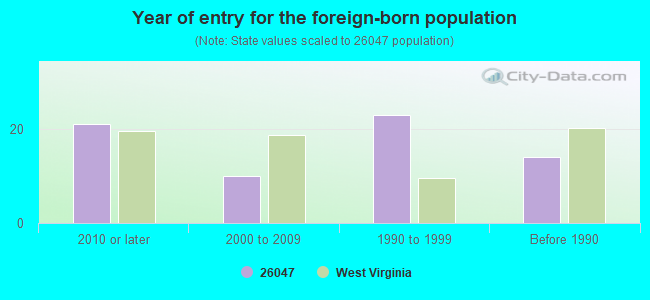
Year of entry for the foreign-born population
212010 or later
102000 to 2009
231990 to 1999
14Before 1990
Facilities with environmental interests located in this zip code:
BEL MESA MANOR (FERNDALE ROAD in NEW CUMBERLAND, WV)
ENFORCEMENT/COMPLIANCE ACTIVITY (Integrated Compliance Information System) National Pollutant Discharge Elimination System NON-MAJOR (Tracking pollutant discharge elimination systems) - permit - ICIS-, ENFORCEMENT/COMPLIANCE ACTIVITY Business SIC classification: OPERATORS OF RESIDENTIAL MOBILE HOME SITES Organizations: PIETRANTON, DOLORES (CONTACT/OWNER)
Alternative names: DELORES PIETRANTON, DOLORES K. PIETRANTON, PIETRANTON, DELORES
DOSS PETROLEUM (1601 COMMERCE WAY in WELLSBURG, WV)
(Integrated Compliance Information System) - ICIS-03-2003-0324, FORMAL ENFORCEMENT ACTION
CHESAPEAKE & POTOMAC TELEPHONE CO (GRANT ST in NEW CUMBERLAND, WV)
(Resource Conservation and Recovery Act (tracking hazardous waste)) Organizations: OPERNAME (CONTACT/OPERATOR)
, VERIZON WEST VIRGINIA INC (CONTACT/OWNER)
Alternative names: VERIZON WEST VIRGINIA INC
CHERRY LAKE FISHING & RENTALS (CHERRY LAKE in NEW CUMBERLAND, WV)
National Pollutant Discharge Elimination System NON-MAJOR (Tracking pollutant discharge elimination systems) - permit Business SIC classification: OPERATORS OF RESIDENTIAL MOBILE HOME SITES Organizations: MCFADDEN, BARBARA (CONTACT/OWNER)
Alternative names: BARBARA MCFADDEN, MCFADDEN, BARBARA
CM TECH INC. (BARKHURST BLDG., SOUTH CHESTER in NEW CUMBERLAND, WV)
(Resource Conservation and Recovery Act (tracking hazardous waste)) Organizations: JAMEGY WV INC. (CONTACT/OWNER)
DAN CAIN (RD 2 BOX 113 FLAT CEMETARY RD in NEW CUMBERLAND, WV)
(Resource Conservation and Recovery Act (tracking hazardous waste)) Organizations: DANIEL A CAIN (CONTACT/OWNER)
DORICH BP SVC (RT 2 2 1/2 MI N OF WEIRTON in NEW CUMBERLAND, WV)
DEER RUN TRAILER PARK (RR 2 BOX 400 in NEW CUMBERLAND, WV)
National Pollutant Discharge Elimination System NON-MAJOR (Tracking pollutant discharge elimination systems) - permit Business SIC classification: OPERATORS OF RESIDENTIAL MOBILE HOME SITES Alternative names: JOHN F PORTER, PORTER, JOHN F
BOWENS SERVICE STATION (100 SOUTH CHESTER ST in NEW CUMBERLAND, WV)
Conditionally Exempt Small Quantity Generators, less than 100 kg/month of hazardous waste (Resource Conservation and Recovery Act (tracking hazardous waste)) - notification Organizations: DON BOWEN (CONTACT/OWNER)
FUCCY HAULING INC (205 MARSHALL ST in NEW CUMBERLAND, WV)
Conditionally Exempt Small Quantity Generators, less than 100 kg/month of hazardous waste (Resource Conservation and Recovery Act (tracking hazardous waste)) - notification
Housing units lacking complete plumbing facilities: 2.8% Housing units lacking complete kitchen facilities: 2.7%
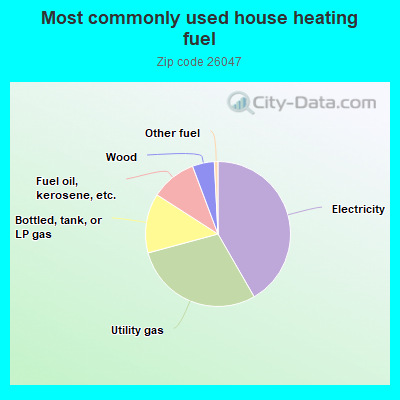
41.7%Electricity
29.1%Utility gas
13.3%Bottled, tank, or LP gas
10.2%Fuel oil, kerosene, etc.
4.9%Wood
0.8%Other fuel
Population in 1990: 5,779. Population change in the 1990s: +776 (+13.4%).
Place of birth for U.S.-born residents:
This state: 2,698
Northeast: 642
Midwest: 1,977
South: 285
72% of the 26047 zip code residents lived in the same house 5 years ago. Out of people who lived in different houses, 74% lived in this county. Out of people who lived in different counties, 50% lived in West Virginia.
94% of the 26047 zip code residents lived in the same house 1 year ago. Out of people who lived in different houses, 63% moved from this county. Out of people who lived in different houses, 2% moved from different county within same state. Out of people who lived in different houses, 34% moved from different state.
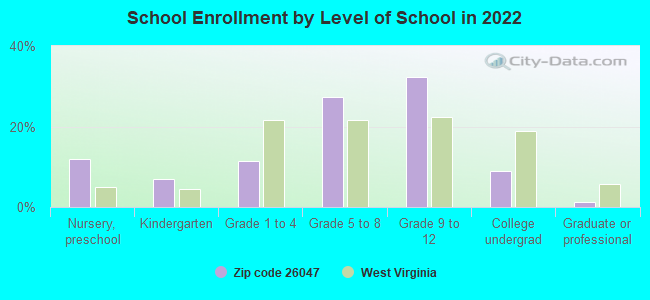
Private vs. public school enrollment:
Students in private schools in grades 1 to 8 (elementary and middle school):
Here:
0.0%
West Virginia:
12.2%
Students in private schools in grades 9 to 12 (high school):
Here:
0.0%
West Virginia:
8.8%
Students in private undergraduate colleges: 14
Here:
14.4%
West Virginia:
17.3%
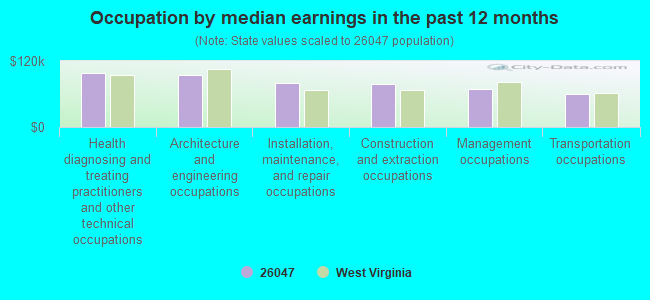
Occupation by median earnings in the past 12 months ($)
98,330Health diagnosing and treating practitioners and other technical occupations
94,222Architecture and engineering occupations
79,188Installation, maintenance, and repair occupations
78,321Construction and extraction occupations
68,484Management occupations
59,130Transportation occupations
Top industries in this zip code by the number of employees in 2005:
Health Care and Social Assistance: Ambulance Services (20-49 employees: 1 establishment)
Arts, Entertainment, and Recreation: Other Spectator Sports (10-19: 1, 5-9: 1, 1-4: 1)
Other Services (except Public Administration): Religious Organizations (5-9: 2, 1-4: 5)
Accommodation and Food Services: Full-Service Restaurants (10-19: 1, 1-4: 2)
Management of Companies and Enterprises: Corporate, Subsidiary, and Regional Managing Offices (10-19: 1)
Health Care and Social Assistance: Services for the Elderly and Persons with Disabilities (10-19: 1)
People in group quarters in 2000:
12 people in local jails and other confinement facilities (including police lockups)
Fatal accident statistics in 2014:
Fatal accident count: 1
Vehicles involved in fatal accidents: 2
Fatal accidents caused by drunken drivers: 0
Fatalities: 3
Persons involved in fatal accidents: 9
Pedestrians involved in fatal accidents: 0
Fatal accident statistics in 2012:
Fatal accident count: 2
Vehicles involved in fatal accidents: 4
Fatal accidents caused by drunken drivers: 1
Fatalities: 2
Persons involved in fatal accidents: 5
Pedestrians involved in fatal accidents: 0
Home Mortgage Disclosure Act Aggregated Statistics For Year 2009 (Based on 6 partial tracts)
A) FHA, FSA/RHS & VA Home Purchase Loans
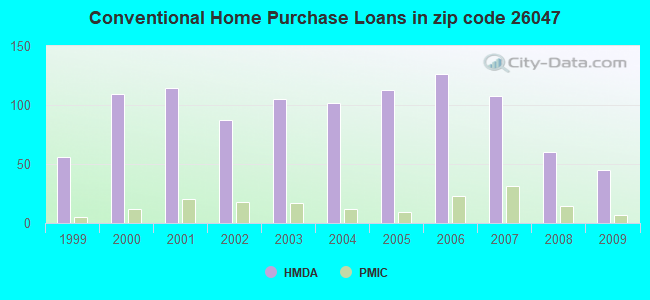
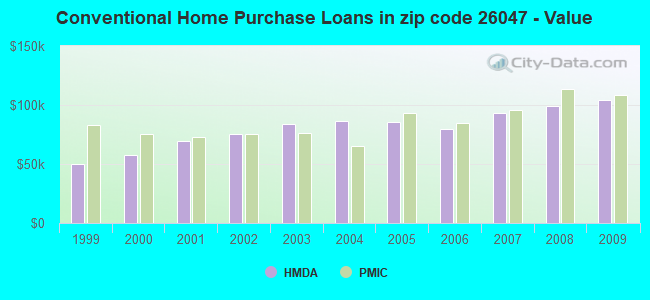
B) Conventional Home Purchase Loans
C) Refinancings
D) Home Improvement Loans
F) Non-occupant Loans on < 5 Family Dwellings (A B C & D)
G) Loans On Manufactured Home Dwelling (A B C & D)
Number
Average Value
Number
Average Value
Number
Average Value
Number
Average Value
Number
Average Value
Number
Average Value
LOANS ORIGINATED
25
$94,189
45
$104,299
140
$100,957
76
$71,252
6
$46,758
7
$91,249
APPLICATIONS APPROVED, NOT ACCEPTED
0
$0
0
$0
13
$190,880
6
$20,700
1
$4,930
1
$65,030
APPLICATIONS DENIED
5
$92,190
16
$93,098
66
$93,922
15
$35,727
3
$82,967
8
$62,546
APPLICATIONS WITHDRAWN
3
$128,930
5
$86,274
44
$108,667
4
$49,025
0
$0
2
$75,635
FILES CLOSED FOR INCOMPLETENESS
0
$0
0
$0
11
$80,119
1
$24,640
0
$0
2
$18,825
Aggregated Statistics For Year 2008 (Based on 6 partial tracts)
A) FHA, FSA/RHS & VA Home Purchase Loans
B) Conventional Home Purchase Loans
C) Refinancings
D) Home Improvement Loans
F) Non-occupant Loans on < 5 Family Dwellings (A B C & D)
G) Loans On Manufactured Home Dwelling (A B C & D)
Number
Average Value
Number
Average Value
Number
Average Value
Number
Average Value
Number
Average Value
Number
Average Value
LOANS ORIGINATED
19
$95,825
60
$99,134
103
$92,343
64
$36,906
6
$38,488
17
$71,085
APPLICATIONS APPROVED, NOT ACCEPTED
1
$61,600
7
$93,179
19
$137,906
5
$57,522
3
$41,070
6
$81,193
APPLICATIONS DENIED
2
$96,710
11
$65,069
113
$101,872
46
$69,202
3
$35,777
15
$59,451
APPLICATIONS WITHDRAWN
2
$114,115
7
$68,127
60
$107,636
3
$30,597
4
$70,448
2
$103,420
FILES CLOSED FOR INCOMPLETENESS
1
$107,180
1
$39,360
14
$111,299
0
$0
3
$65,303
1
$85,560
Aggregated Statistics For Year 2007 (Based on 6 partial tracts)
A) FHA, FSA/RHS & VA Home Purchase Loans
B) Conventional Home Purchase Loans
C) Refinancings
D) Home Improvement Loans
E) Loans on Dwellings For 5+ Families
F) Non-occupant Loans on < 5 Family Dwellings (A B C & D)
G) Loans On Manufactured Home Dwelling (A B C & D)
Number
Average Value
Number
Average Value
Number
Average Value
Number
Average Value
Number
Average Value
Number
Average Value
Number
Average Value
LOANS ORIGINATED
9
$120,326
108
$93,250
125
$84,668
82
$52,034
2
$2,700,945
11
$64,193
17
$71,248
APPLICATIONS APPROVED, NOT ACCEPTED
0
$0
5
$61,588
22
$67,499
4
$52,742
0
$0
0
$0
2
$50,480
APPLICATIONS DENIED
2
$20,230
13
$83,251
136
$71,136
40
$53,440
0
$0
4
$38,012
15
$73,064
APPLICATIONS WITHDRAWN
2
$56,290
7
$75,694
35
$92,473
5
$76,008
0
$0
1
$147,840
2
$51,765
FILES CLOSED FOR INCOMPLETENESS
1
$169,410
0
$0
11
$101,841
6
$96,627
0
$0
1
$85,560
3
$104,403
Aggregated Statistics For Year 2006 (Based on 6 partial tracts)
A) FHA, FSA/RHS & VA Home Purchase Loans
B) Conventional Home Purchase Loans
C) Refinancings
D) Home Improvement Loans
F) Non-occupant Loans on < 5 Family Dwellings (A B C & D)
G) Loans On Manufactured Home Dwelling (A B C & D)
Number
Average Value
Number
Average Value
Number
Average Value
Number
Average Value
Number
Average Value
Number
Average Value
LOANS ORIGINATED
19
$93,405
126
$79,571
130
$73,308
76
$37,286
16
$55,171
27
$70,297
APPLICATIONS APPROVED, NOT ACCEPTED
0
$0
13
$64,788
31
$87,376
4
$39,768
0
$0
12
$49,184
APPLICATIONS DENIED
3
$222,330
32
$72,619
118
$72,858
36
$33,668
2
$42,215
23
$66,610
APPLICATIONS WITHDRAWN
1
$27,100
7
$82,646
37
$71,710
4
$53,900
5
$83,570
1
$34,500
FILES CLOSED FOR INCOMPLETENESS
0
$0
4
$75,138
9
$98,200
0
$0
0
$0
0
$0
Aggregated Statistics For Year 2005 (Based on 6 partial tracts)
A) FHA, FSA/RHS & VA Home Purchase Loans
B) Conventional Home Purchase Loans
C) Refinancings
D) Home Improvement Loans
F) Non-occupant Loans on < 5 Family Dwellings (A B C & D)
G) Loans On Manufactured Home Dwelling (A B C & D)
Number
Average Value
Number
Average Value
Number
Average Value
Number
Average Value
Number
Average Value
Number
Average Value
LOANS ORIGINATED
19
$103,688
113
$85,481
170
$82,706
66
$36,873
20
$60,633
38
$62,234
APPLICATIONS APPROVED, NOT ACCEPTED
2
$61,565
16
$112,301
33
$75,966
13
$32,192
3
$64,350
5
$63,272
APPLICATIONS DENIED
4
$114,335
39
$66,899
205
$84,651
44
$29,710
9
$106,743
35
$63,391
APPLICATIONS WITHDRAWN
4
$55,792
14
$102,193
59
$97,365
12
$33,382
2
$94,985
2
$59,465
FILES CLOSED FOR INCOMPLETENESS
0
$0
6
$56,582
9
$87,501
2
$173,095
1
$68,450
1
$147,840
Aggregated Statistics For Year 2004 (Based on 6 partial tracts)
A) FHA, FSA/RHS & VA Home Purchase Loans
B) Conventional Home Purchase Loans
C) Refinancings
D) Home Improvement Loans
F) Non-occupant Loans on < 5 Family Dwellings (A B C & D)
G) Loans On Manufactured Home Dwelling (A B C & D)
Number
Average Value
Number
Average Value
Number
Average Value
Number
Average Value
Number
Average Value
Number
Average Value
LOANS ORIGINATED
20
$87,532
102
$86,176
200
$79,262
106
$46,376
23
$80,240
21
$46,931
APPLICATIONS APPROVED, NOT ACCEPTED
0
$0
14
$64,364
24
$77,806
14
$17,275
3
$62,083
8
$57,838
APPLICATIONS DENIED
5
$64,380
23
$61,944
106
$79,511
52
$23,778
3
$74,190
22
$50,693
APPLICATIONS WITHDRAWN
1
$52,190
17
$86,329
60
$87,776
3
$26,810
5
$63,998
3
$50,980
FILES CLOSED FOR INCOMPLETENESS
3
$92,720
2
$56,470
8
$93,660
0
$0
0
$0
2
$71,240
Aggregated Statistics For Year 2003 (Based on 6 partial tracts)
A) FHA, FSA/RHS & VA Home Purchase Loans
B) Conventional Home Purchase Loans
C) Refinancings
D) Home Improvement Loans
E) Loans on Dwellings For 5+ Families
F) Non-occupant Loans on < 5 Family Dwellings (A B C & D)
Number
Average Value
Number
Average Value
Number
Average Value
Number
Average Value
Number
Average Value
Number
Average Value
LOANS ORIGINATED
15
$83,328
105
$83,541
544
$74,580
56
$20,756
2
$35,180
19
$49,779
APPLICATIONS APPROVED, NOT ACCEPTED
0
$0
14
$53,384
44
$76,409
6
$23,112
0
$0
0
$0
APPLICATIONS DENIED
5
$45,738
30
$53,263
136
$78,158
37
$15,163
0
$0
5
$82,362
APPLICATIONS WITHDRAWN
0
$0
12
$80,522
62
$88,700
4
$20,130
0
$0
2
$80,915
FILES CLOSED FOR INCOMPLETENESS
4
$64,198
5
$63,860
12
$97,332
3
$31,083
0
$0
1
$34,220
Aggregated Statistics For Year 2002 (Based on 6 partial tracts)
A) FHA, FSA/RHS & VA Home Purchase Loans
B) Conventional Home Purchase Loans
C) Refinancings
D) Home Improvement Loans
E) Loans on Dwellings For 5+ Families
F) Non-occupant Loans on < 5 Family Dwellings (A B C & D)
Number
Average Value
Number
Average Value
Number
Average Value
Number
Average Value
Number
Average Value
Number
Average Value
LOANS ORIGINATED
11
$80,607
87
$75,204
302
$73,833
44
$18,646
0
$0
21
$44,698
APPLICATIONS APPROVED, NOT ACCEPTED
0
$0
15
$42,805
30
$66,811
5
$20,058
0
$0
0
$0
APPLICATIONS DENIED
0
$0
27
$48,187
99
$67,147
27
$10,863
1
$24,810
2
$17,970
APPLICATIONS WITHDRAWN
3
$26,810
11
$73,839
48
$78,736
5
$11,828
0
$0
1
$25,670
FILES CLOSED FOR INCOMPLETENESS
1
$54,760
5
$49,406
30
$72,797
2
$26,385
0
$0
0
$0
Aggregated Statistics For Year 2001 (Based on 6 partial tracts)
A) FHA, FSA/RHS & VA Home Purchase Loans
B) Conventional Home Purchase Loans
C) Refinancings
D) Home Improvement Loans
F) Non-occupant Loans on < 5 Family Dwellings (A B C & D)
Number
Average Value
Number
Average Value
Number
Average Value
Number
Average Value
Number
Average Value
LOANS ORIGINATED
16
$71,811
114
$69,839
279
$71,303
66
$16,142
16
$54,397
APPLICATIONS APPROVED, NOT ACCEPTED
2
$36,365
21
$50,519
21
$48,651
6
$9,600
2
$13,195
APPLICATIONS DENIED
0
$0
66
$37,955
115
$59,529
33
$11,101
4
$40,040
APPLICATIONS WITHDRAWN
1
$21,390
17
$42,970
74
$69,585
11
$20,780
1
$269,810
FILES CLOSED FOR INCOMPLETENESS
0
$0
6
$49,967
24
$83,218
1
$16,260
0
$0
Aggregated Statistics For Year 2000 (Based on 6 partial tracts)
A) FHA, FSA/RHS & VA Home Purchase Loans
B) Conventional Home Purchase Loans
C) Refinancings
D) Home Improvement Loans
F) Non-occupant Loans on < 5 Family Dwellings (A B C & D)
Number
Average Value
Number
Average Value
Number
Average Value
Number
Average Value
Number
Average Value
LOANS ORIGINATED
11
$69,084
109
$57,466
120
$58,595
60
$12,415
12
$33,376
APPLICATIONS APPROVED, NOT ACCEPTED
1
$50,510
47
$44,944
31
$60,551
15
$15,648
3
$26,067
APPLICATIONS DENIED
2
$78,215
107
$41,766
116
$59,866
49
$15,094
2
$43,360
APPLICATIONS WITHDRAWN
2
$13,195
13
$45,868
45
$49,212
7
$24,477
0
$0
FILES CLOSED FOR INCOMPLETENESS
0
$0
1
$45,350
5
$39,418
0
$0
0
$0
Aggregated Statistics For Year 1999 (Based on 3 partial tracts)
A) FHA, FSA/RHS & VA Home Purchase Loans
B) Conventional Home Purchase Loans
C) Refinancings
D) Home Improvement Loans
E) Loans on Dwellings For 5+ Families
F) Non-occupant Loans on < 5 Family Dwellings (A B C & D)
2003 - 2018 National Fire Incident Reporting System (NFIRS) incidents
Based on the data from the years 2003 - 2018 the average number of fires per year is 40. The highest number of reported fires - 59 took place in 2008, and the least - 25 in 2016. The data has a dropping trend.
When looking into fire subcategories, the most reports belonged to: Structure Fires (54.0%), and Outside Fires (27.2%).
Fire incident types reported to NFIRS in Zip Code 26047


 Nearest zip codes: 26056, 43926, 43961, 43964, 26034, 26050.


 Based on the data from the years 2003 - 2018 the average number of fires per year is 40. The highest number of reported fires - 59 took place in 2008, and the least - 25 in 2016. The data has a dropping trend.
 When looking into fire subcategories, the most reports belonged to: Structure Fires (54.0%), and Outside Fires (27.2%).