Estimated zip code population in 2022: 2,918 Zip code population in 2010: 3,131 Zip code population in 2000: 3,328
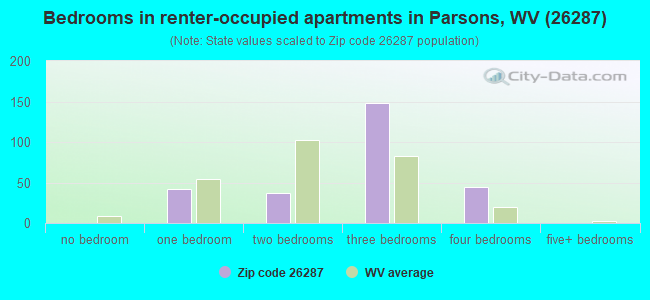
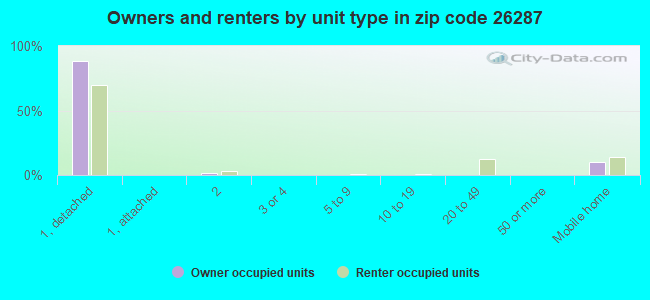
Houses and condos: 1,433 Renter-occupied apartments: 259
% of renters here:
22%
State:
26%
March 2022 cost of living index in zip code 26287: 84.8 (less than average, U.S. average is 100)
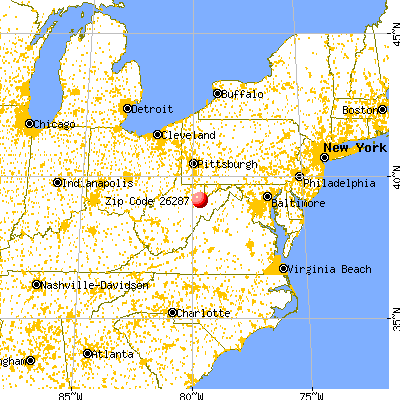
Land area: 152.0 sq. mi. Water area: 1.6 sq. mi.
Population density: 19 people per square mile
(very low).
OSM Map
General Map
Google Map
MSN Map
OSM Map
General Map
Google Map
MSN Map
OSM Map
General Map
Google Map
MSN Map
OSM Map
General Map
Google Map
MSN Map
Please wait while loading the map...
Real estate property taxes paid for housing units in 2022:
This zip code:
0.3% ($437)
West Virginia:
0.5% ($821)
Median real estate property taxes paid for housing units with mortgages in 2022: $455 (0.4%) Median real estate property taxes paid for housing units with no mortgage in 2022: $420 (0.3%)
Business Search- 14 Million verified businesses
Males: 1,502
(51.5%)
Females: 1,415
(48.5%)
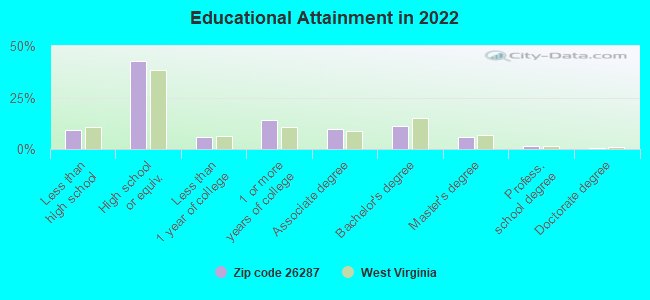
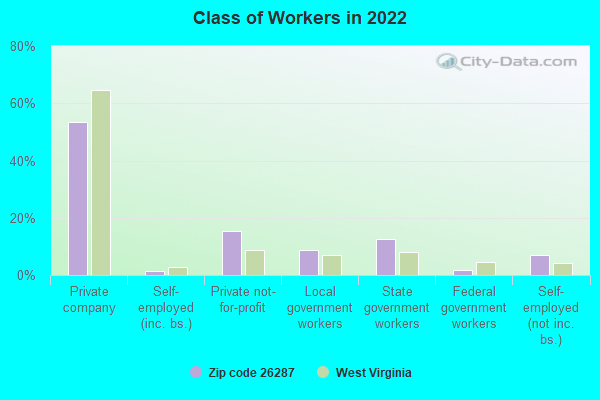
For population 25 years and over in 26287:
High school or higher: 90.0%
Bachelor's degree or higher: 18.7%
Graduate or professional degree: 7.6%
Unemployed: 6.7%
Mean travel time to work (commute): 33.7 minutes
For population 15 years and over in 26287:
Never married: 26.1%
Now married: 52.4%
Separated: 0.0%
Widowed: 9.1%
Divorced: 12.4%
Zip code 26287 compared to state average:
Black race population percentage significantly below state average.
Hispanic race population percentage significantly below state average.
Median age above state average.
Foreign-born population percentage significantly below state average.
Length of stay since moving in significantly above state average.
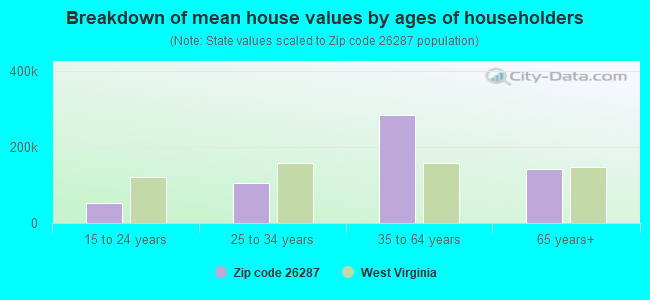
Estimated median house/condo value in 2022: $127,548
26287:
$127,548
West Virginia:
$155,100
According to our research of West Virginia and other state lists, there were 9 registered sex offenders living in 26287 zip code as of June 19, 2024. The ratio of all residents to sex offenders in zip code 26287 is 337 to 1. The ratio of registered sex offenders to all residents in this zip code is near the state average.
Median resident age:
This zip code:
48.7 years
West Virginia median age:
42.9 years
Average household size:
This zip code:
2.5 people
West Virginia:
2.3 people
Averages for the 2020 tax year for zip code 26287, filed in 2021:
Average Adjusted Gross Income (AGI) in 2020: $48,122 (Individual Income Tax Returns)
Here:
$48,122
State:
$56,292
Salary/wage: $41,345 (reported on 81.0% of returns)
Here:
$41,345
State:
$49,093
(% of AGI for various income ranges: 1073.2% for AGIs below $25k, 3342.7% for AGIs $25k-50k, 6555.6% for AGIs $50k-75k, 7795.8% for AGIs $75k-100k, 15062.5% for AGIs $100k-200k)
Taxable interest for individuals: $738 (reported on 29.2% of returns)
This zip code:
$738
West Virginia:
$1,141
(% of AGI for various income ranges: 20.5% for AGIs below $25k, 21.0% for AGIs $25k-50k, 29.4% for AGIs $50k-75k, 40.8% for AGIs $75k-100k, 75.0% for AGIs $100k-200k)
Ordinary dividends: $3,381 (reported on 11.7% of returns)
Here:
$3,381
State:
$5,456
(% of AGI for various income ranges: 15.4% for AGIs below $25k, 7.7% for AGIs $25k-50k, 63.1% for AGIs $50k-75k, 71.7% for AGIs $75k-100k, 342.5% for AGIs $100k-200k)
Net capital gain/loss in AGI: +$5,838 (reported on 9.5% of returns)
Here:
+$5,838
State:
+$11,656
(% of AGI for various income ranges: 27.3% for AGIs below $25k, 63.7% for AGIs $50k-75k, 695.0% for AGIs $100k-200k)
Profit/loss from business: +$6,943 (reported on 10.2% of returns)
Here:
+$6,943
State:
+$12,084
(% of AGI for various income ranges: 65.1% for AGIs below $25k, 97.7% for AGIs $25k-50k, 83.1% for AGIs $50k-75k, 67.5% for AGIs $75k-100k, 280.0% for AGIs $100k-200k)
Taxable individual retirement arrangement distribution: $12,269 (reported on 9.5% of returns)
26287:
$12,269
West Virginia:
$15,311
(% of AGI for various income ranges: 50.0% for AGIs below $25k, 124.7% for AGIs $25k-50k, 245.0% for AGIs $50k-75k, 536.7% for AGIs $75k-100k)
Earned income credit: $1,921 (reported on 17.5% of returns)
Here:
$1,921
State:
$2,258
(% of AGI for various income ranges: 74.9% for AGIs below $25k, 61.3% for AGIs $25k-50k)
Percentage of individuals using paid preparers for their 2020 taxes: 91.2%
Here:
91%
State:
93%
(% for various income ranges: 88.2% for AGIs below $25k, 91.9% for AGIs $25k-50k, 95.5% for AGIs $50k-75k, 92.9% for AGIs $75k-100k, 92.3% for AGIs $100k-200k)
Averages for the 2012 tax year for zip code 26287, filed in 2013:
Average Adjusted Gross Income (AGI) in 2012: $38,651 (Individual Income Tax Returns)
Here:
$38,651
State:
$48,628
Salary/wage: $35,902 (reported on 82.1% of returns)
Here:
$35,902
State:
$42,328
(% of AGI for various income ranges: 72.9% for AGIs below $25k, 79.4% for AGIs $25k-50k, 80.6% for AGIs $50k-75k, 83.0% for AGIs $75k-100k, 64.3% for AGIs $100k-200k)
Taxable interest for individuals: $863 (reported on 30.7% of returns)
This zip code:
$863
West Virginia:
$1,211
(% of AGI for various income ranges: 1.7% for AGIs below $25k, 0.7% for AGIs $25k-50k, 0.4% for AGIs $50k-75k, 0.5% for AGIs $75k-100k, 0.6% for AGIs $100k-200k)
Ordinary dividends: $2,286 (reported on 10.0% of returns)
Here:
$2,286
State:
$4,262
(% of AGI for various income ranges: 0.5% for AGIs below $25k, 0.5% for AGIs $25k-50k, 1.0% for AGIs $50k-75k, 0.7% for AGIs $100k-200k)
Net capital gain/loss in AGI: +$412 (reported on 5.7% of returns)
Here:
+$412
State:
+$8,875
(% of AGI for various income ranges: 0.3% for AGIs $25k-50k)
Profit/loss from business: +$7,400 (reported on 10.0% of returns)
Here:
+$7,400
State:
+$13,636
(% of AGI for various income ranges: 2.6% for AGIs below $25k, 1.8% for AGIs $25k-50k, 2.2% for AGIs $50k-75k, 3.4% for AGIs $75k-100k)
Taxable individual retirement arrangement distribution: $9,010 (reported on 7.1% of returns)
26287:
$9,010
West Virginia:
$11,787
(% of AGI for various income ranges: 2.8% for AGIs below $25k, 1.2% for AGIs $25k-50k, 4.0% for AGIs $50k-75k)
Total itemized deductions: $20,153 (24% of AGI, reported on 10.7% of returns)
Here:
$20,153
State:
$21,148
Here:
23.7% of AGI
State:
18.1% of AGI
(% of AGI for various income ranges: 5.2% for AGIs $25k-50k, 5.7% for AGIs $50k-75k, 7.6% for AGIs $75k-100k, 8.1% for AGIs $100k-200k)
Charity contributions: $3,760 (reported on 7.1% of returns)
Here:
$3,760
State:
$4,508
(% of AGI for various income ranges: 0.5% for AGIs $25k-50k, 0.6% for AGIs $50k-75k, 1.1% for AGIs $75k-100k, 1.3% for AGIs $100k-200k)
Taxes paid: $5,233 (reported on 10.7% of returns)
26287:
$5,233
State:
$8,103
(% of AGI for various income ranges: 0.6% for AGIs $25k-50k, 0.9% for AGIs $50k-75k, 2.0% for AGIs $75k-100k, 3.6% for AGIs $100k-200k)
Earned income credit: $2,033 (reported on 19.3% of returns)
Here:
$2,033
State:
$2,140
(% of AGI for various income ranges: 5.0% for AGIs below $25k, 1.3% for AGIs $25k-50k)
Percentage of individuals using paid preparers for their 2012 taxes: 51.4%
Here:
51%
State:
49%
(% for various income ranges: 47.6% for AGIs below $25k, 52.8% for AGIs $25k-50k, 54.5% for AGIs $50k-75k, 54.5% for AGIs $75k-100k, 62.5% for AGIs $100k-200k)
Averages for the 2004 tax year for zip code 26287, filed in 2005:
Average Adjusted Gross Income (AGI) in 2004: $32,197 (Individual Income Tax Returns)
Here:
$32,197
State:
$37,498
Salary/wage: $28,452 (reported on 88.0% of returns)
Here:
$28,452
State:
$33,645
(% of AGI for various income ranges: 79.1% for AGIs below $10k, 78.0% for AGIs $10k-25k, 84.6% for AGIs $25k-50k, 82.0% for AGIs $50k-75k, 79.8% for AGIs $75k-100k, 49.2% for AGIs over 100k)
Taxable interest for individuals: $1,560 (reported on 42.2% of returns)
This zip code:
$1,560
West Virginia:
$1,465
(% of AGI for various income ranges: 1.7% for AGIs below $10k, 1.9% for AGIs $10k-25k, 0.7% for AGIs $25k-50k, 2.0% for AGIs $50k-75k, 0.9% for AGIs $75k-100k, 7.0% for AGIs over 100k)
Taxable dividends: $1,840 (reported on 13.0% of returns)
Here:
$1,840
State:
$2,913
(% of AGI for various income ranges: 0.1% for AGIs below $10k, 0.7% for AGIs $10k-25k, 0.9% for AGIs $25k-50k, 0.4% for AGIs $50k-75k, 0.3% for AGIs $75k-100k, 1.3% for AGIs over 100k)
Net capital gain/loss: +$13,057 (reported on 9.4% of returns)
Here:
+$13,057
State:
+$6,331
(% of AGI for various income ranges: -1.0% for AGIs below $10k, 0.1% for AGIs $10k-25k, 0.7% for AGIs $25k-50k, 1.2% for AGIs $50k-75k, 1.0% for AGIs $75k-100k, 24.5% for AGIs over 100k)
Profit/loss from business: +$7,580 (reported on 11.0% of returns)
Here:
+$7,580
State:
+$11,074
(% of AGI for various income ranges: -2.5% for AGIs below $10k, 2.8% for AGIs $10k-25k, 2.7% for AGIs $25k-50k, 4.0% for AGIs $50k-75k, 2.9% for AGIs over 100k)
IRA payment deduction: $3,167 (reported on 1.8% of returns)
26287:
$3,167
West Virginia:
$2,796
Total itemized deductions: $17,286 (22% of AGI, reported on 9.1% of returns)
Here:
$17,286
State:
$16,976
Here:
22.5% of AGI
State:
19.0% of AGI
(% of AGI for various income ranges: 3.6% for AGIs $25k-50k, 5.9% for AGIs $50k-75k, 5.8% for AGIs $75k-100k, 13.1% for AGIs over 100k)
Charity contributions deductions: $4,585 (6% of AGI, reported on 7.2% of returns)
Here:
$4,585
State:
$3,529
Here:
5.7% of AGI
State:
3.7% of AGI
(% of AGI for various income ranges: 0.8% for AGIs $25k-50k, 0.6% for AGIs $50k-75k, 1.1% for AGIs $75k-100k, 3.8% for AGIs over 100k)
Total tax: $3,556 (reported on 71.8% of returns)
26287:
$3,556
State:
$5,372
(% of AGI for various income ranges: 1.7% for AGIs below $10k, 3.7% for AGIs $10k-25k, 6.0% for AGIs $25k-50k, 8.8% for AGIs $50k-75k, 11.2% for AGIs $75k-100k, 15.8% for AGIs over 100k)
Earned income credit: $1,476 (reported on 19.0% of returns)
Here:
$1,476
State:
$1,662
Percentage of individuals using paid preparers for their 2004 taxes: 48.4%
Here:
48%
State:
55%
(% for various income ranges: 40.8% for AGIs below $10k, 45.9% for AGIs $10k-25k, 52.2% for AGIs $25k-50k, 52.2% for AGIs $50k-75k, 46.9% for AGIs $75k-100k, 73.0% for AGIs over 100k)
Household received Food Stamps/SNAP in the past 12 months: 160 Household did not receive Food Stamps/SNAP in the past 12 months: 1,014
Women who did not have a birth in the past 12 months: 579 (294 now married, 284 unmarried)
Housing units in zip code 26287 with a mortgage: 425 (29 second mortgage, 18 both second mortgage and home equity loan) Median monthly owner costs for units with a mortgage: $945 Median monthly owner costs for units without a mortgage: $326
Residents with income below the poverty level in 2022:
This zip code:
13.1%
Whole state:
17.9%
Residents with income below 50% of the poverty level in 2022:
This zip code:
5.8%
Whole state:
9.7%
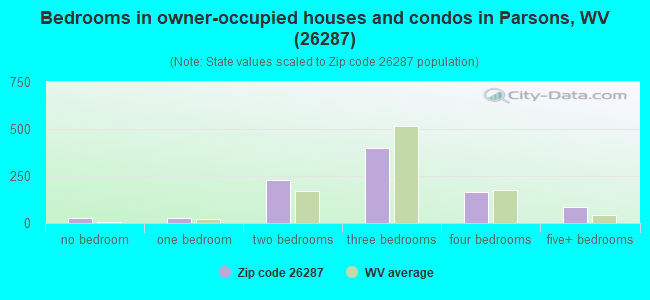
Median number of rooms in houses and condos:
Here:
6.1
State:
6.5
Median number of rooms in apartments:
Here:
5.8
State:
4.7
Notable locations in this zip code not listed on our city pages
Notable locations in zip code 26287: Cheat District Ranger Station (A), Horseshore Recreation Site (B), Camp Kidd (C), Horseshoe YMCA Camp (D), Holly Meadows Golf Course (E), Lamberts Ambulance Service Parsons (F), Tucker County Emergency Medical Services 54735 (G), Parsons Volunteer Fire Department (H), Parsons Town Hall (I), Tucker County Courthouse (J), Tucker County Jail (K). Display/hide their locations on the map
Churches in zip code 26287 include: Ann Eliza Methodist Episcopal Church (A), Bretz Church of Christ (B), Church of God (C), First Baptist Church (D), First Methodist Church (E), First United Brethren Church (F), Parsons Presbyterian Church (G), White Ridge Church (H), Saint Johns Methodist Church (I). Display/hide their locations on the map
Cemeteries: Bonifield Cemetery (1), Knotts Cemetery (2), Hile Cemetery (3), Bethel Cemetery (4), Fairview Cemetery (5), Limestone Cemetery (6), Mount Olivet Cemetery (7). Display/hide their locations on the map
Streams, rivers, and creeks: Lime Hollow Run (A), Licking Creek (B), Lick Drain (C), Leadmine Run (D), Jonathan Run (E), Johnson Run (F), Jacobs Run (G), Indian Run (H), Horseshoe Run (I). Display/hide their locations on the map
214 married couples with children.
148 single-parent households (93 men, 55 women).
99.8% of residents of 26287 zip code speak English at home.
0.1% of residents speak Spanish at home (100% very well).
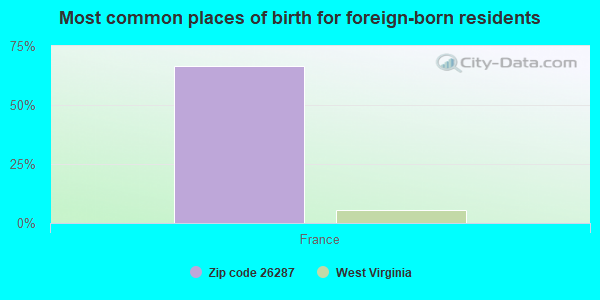
Foreign born population: 3 (0.1%) (100.0% of them are naturalized citizens)
This zip code:
0.1%
Whole state:
1.8%
67%France
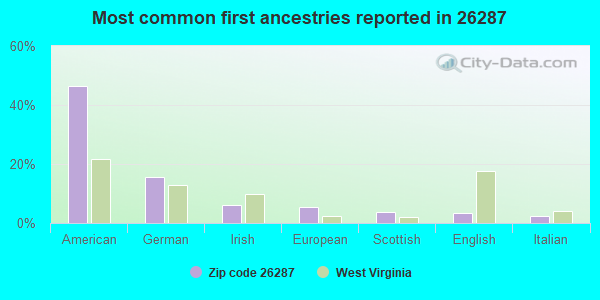
47%American
16%German
6%Irish
5%European
4%Scottish
3%English
2%Italian
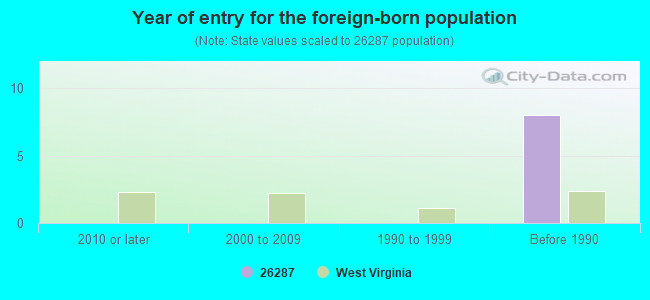
Year of entry for the foreign-born population
02010 or later
02000 to 2009
01990 to 1999
8Before 1990
Facilities with environmental interests located in this zip code:
D & D SALES & SERVICE (308 CENTRAL AVE in PARSONS, WV)
(Resource Conservation and Recovery Act (tracking hazardous waste)) Organizations: DALE G NESTOR (CONTACT/OWNER)
D & W TRUCK LINES (400 PENNSYLVANIA AVE in PARSONS, WV)
Small Quantity Generators, between 100 kg and 1000 kg of hazardous waste/month (Resource Conservation and Recovery Act (tracking hazardous waste)) - notification Organizations: OPERNAME (CONTACT/OPERATOR)
, WILFONG, DEWEY L (CONTACT/OWNER)
DAMARK LIMESTONE, INC. (RT. 38 in ST. GEORGE, WV)
AIR MINOR (AIRS/AFS) Business SIC classification: CRUSHED AND BROKEN LIMESTONE
D&W TRUCK LINES INC (400 PENN AVE. in PARSONS, WV)
National Pollutant Discharge Elimination System NON-MAJOR (Tracking pollutant discharge elimination systems) - permit Business SIC classification: TRUCKING, EXCEPT LOCAL Alternative names: DEWEY L WILFONG, WILFONG, DEWEY L
BONNERS BODY SHOP (314 POPLAR ST in PARSONS, WV)
Conditionally Exempt Small Quantity Generators, less than 100 kg/month of hazardous waste (Resource Conservation and Recovery Act (tracking hazardous waste)) - notification Organizations: GARRY BONNER (CONTACT/OWNER)
Housing units lacking complete plumbing facilities: 6.4% Housing units lacking complete kitchen facilities: 4.1%
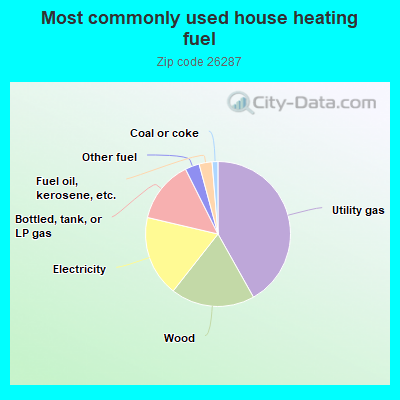
42.0%Utility gas
18.8%Wood
18.1%Electricity
14.0%Bottled, tank, or LP gas
3.2%Other fuel
2.9%Fuel oil, kerosene, etc.
1.3%Coal or coke
Population in 1990: 2,432. Population change in the 1990s: +896 (+36.8%).
Place of birth for U.S.-born residents:
This state: 2,157
Northeast: 160
Midwest: 141
South: 426
West: 10
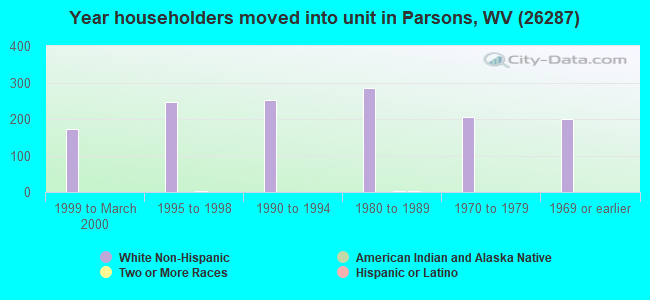
74% of the 26287 zip code residents lived in the same house 5 years ago. Out of people who lived in different houses, 66% lived in this county. Out of people who lived in different counties, 50% lived in West Virginia.
93% of the 26287 zip code residents lived in the same house 1 year ago. Out of people who lived in different houses, 59% moved from this county. Out of people who lived in different houses, 23% moved from different county within same state. Out of people who lived in different houses, 14% moved from different state. Out of people who lived in different houses, 2% moved from abroad.
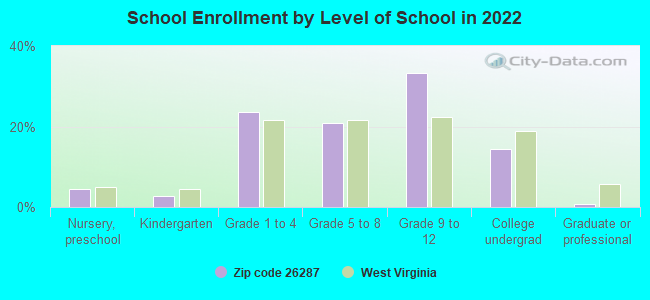
Private vs. public school enrollment:
Students in private schools in grades 1 to 8 (elementary and middle school): 10
Here:
5.2%
West Virginia:
12.2%
Students in private schools in grades 9 to 12 (high school): 54
Here:
36.4%
West Virginia:
8.8%
Students in private undergraduate colleges: 2
Here:
4.6%
West Virginia:
17.3%
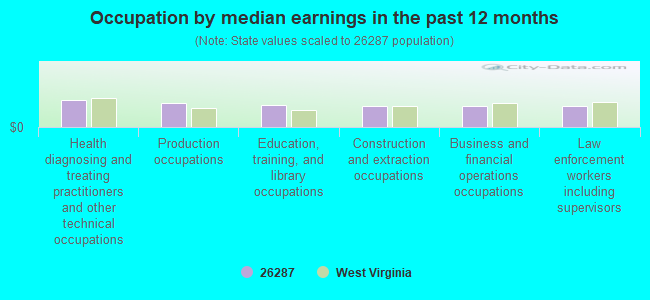
Occupation by median earnings in the past 12 months ($)
66,299Health diagnosing and treating practitioners and other technical occupations
59,012Production occupations
55,471Education, training, and library occupations
52,733Construction and extraction occupations
52,432Business and financial operations occupations
52,393Law enforcement workers including supervisors
Top industries in this zip code by the number of employees in 2005:
Health Care and Social Assistance: All Other Outpatient Care Centers (20-49: 1, 1-4: 1)
Construction: Power and Communication Line and Related Structures Construction (20-49: 1)
Administrative and Support and Waste Management and Remediation Services: Professional Employer Organizations (20-49: 1)
Fatal accident statistics in 2013:
Fatal accident count: 1
Vehicles involved in fatal accidents: 1
Fatal accidents caused by drunken drivers: 0
Fatalities: 1
Persons involved in fatal accidents: 1
Pedestrians involved in fatal accidents: 0
Fatal accident statistics in 2012:
Fatal accident count: 2
Vehicles involved in fatal accidents: 2
Fatal accidents caused by drunken drivers: 2
Fatalities: 2
Persons involved in fatal accidents: 2
Pedestrians involved in fatal accidents: 0
2003 - 2018 National Fire Incident Reporting System (NFIRS) incidents
According to the data from the years 2003 - 2018 the average number of fires per year is 11. The highest number of fire incidents - 24 took place in 2009, and the least - 5 in 2012. The data has a growing trend.
When looking into fire subcategories, the most incidents belonged to: Structure Fires (68.5%), and Outside Fires (19.1%).
Fire incident types reported to NFIRS in Zip Code 26287


 Nearest zip codes: 26269, 26292, 26716, 26425, 26705, 26271.


 According to the data from the years 2003 - 2018 the average number of fires per year is 11. The highest number of fire incidents - 24 took place in 2009, and the least - 5 in 2012. The data has a growing trend.
 When looking into fire subcategories, the most incidents belonged to: Structure Fires (68.5%), and Outside Fires (19.1%).