Estimated zip code population in 2022: 5,814 Zip code population in 2010: 5,399 Zip code population in 2000: 4,841
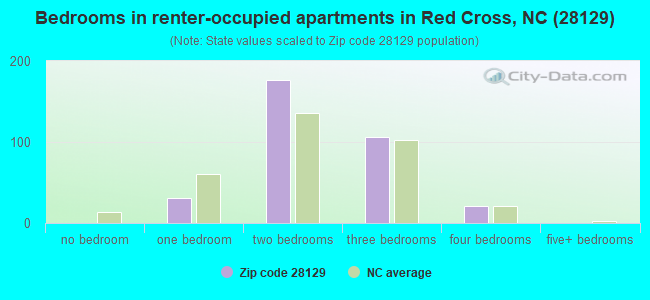
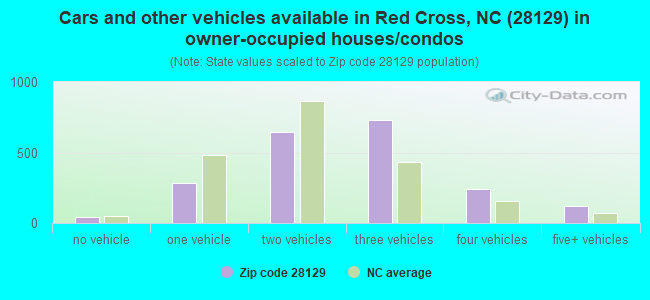
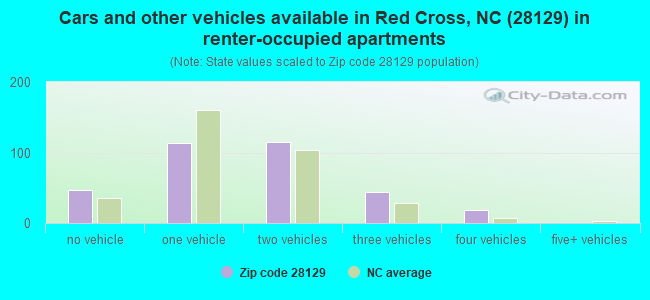
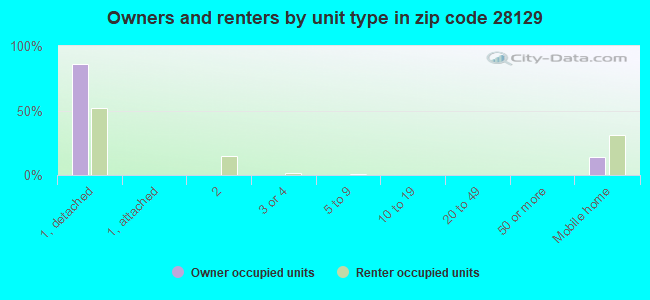
Houses and condos: 2,631 Renter-occupied apartments: 337
% of renters here:
14%
State:
33%
March 2022 cost of living index in zip code 28129: 80.5 (low, U.S. average is 100)
Land area: 42.7 sq. mi. Water area: 0.0 sq. mi.
Population density: 136 people per square mile
(very low).
OSM Map
General Map
Google Map
MSN Map
OSM Map
General Map
Google Map
MSN Map
OSM Map
General Map
Google Map
MSN Map
OSM Map
General Map
Google Map
MSN Map
Please wait while loading the map...
Real estate property taxes paid for housing units in 2022:
This zip code:
0.5% ($1,343)
North Carolina:
0.6% ($1,769)
Median real estate property taxes paid for housing units with mortgages in 2022: $1,398 (0.5%) Median real estate property taxes paid for housing units with no mortgage in 2022: $1,138 (0.6%)
Business Search- 14 Million verified businesses
Males: 2,801
(48.2%)
Females: 3,012
(51.8%)
For population 25 years and over in 28129:
High school or higher: 91.6%
Bachelor's degree or higher: 21.2%
Graduate or professional degree: 4.4%
Unemployed: 0.9%
Mean travel time to work (commute): 31.6 minutes
For population 15 years and over in 28129:
Never married: 26.7%
Now married: 55.2%
Separated: 1.2%
Widowed: 4.5%
Divorced: 12.4%
Zip code 28129 compared to state average:
Unemployed percentage significantly below state average.
Black race population percentage significantly below state average.
Hispanic race population percentage below state average.
Foreign-born population percentage significantly below state average.
Renting percentage significantly below state average.
Length of stay since moving in significantly above state average.
Percentage of population with a bachelor's degree or higher below state average.
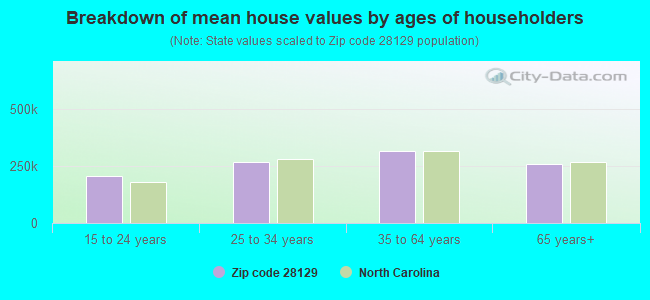
Estimated median house/condo value in 2022: $275,822
28129:
$275,822
North Carolina:
$280,600
According to our research of North Carolina and other state lists, there were 5 registered sex offenders living in 28129 zip code as of June 16, 2024. The ratio of all residents to sex offenders in zip code 28129 is 1,130 to 1. The ratio of registered sex offenders to all residents in this zip code is lower than the state average.
Median resident age:
This zip code:
43.0 years
North Carolina median age:
39.2 years
Average household size:
This zip code:
2.4 people
North Carolina:
2.4 people
Averages for the 2020 tax year for zip code 28129, filed in 2021:
Average Adjusted Gross Income (AGI) in 2020: $61,537 (Individual Income Tax Returns)
Here:
$61,537
State:
$70,020
Salary/wage: $54,173 (reported on 83.0% of returns)
Here:
$54,173
State:
$58,387
(% of AGI for various income ranges: 1260.0% for AGIs below $25k, 3868.8% for AGIs $25k-50k, 7533.1% for AGIs $50k-75k, 10760.5% for AGIs $75k-100k, 17792.1% for AGIs $100k-200k, 45670.0% for AGIs over 200k)
Taxable interest for individuals: $1,031 (reported on 31.7% of returns)
This zip code:
$1,031
North Carolina:
$1,479
(% of AGI for various income ranges: 22.3% for AGIs below $25k, 20.2% for AGIs $25k-50k, 29.6% for AGIs $50k-75k, 46.4% for AGIs $75k-100k, 106.2% for AGIs $100k-200k, 1150.0% for AGIs over 200k)
Ordinary dividends: $2,925 (reported on 13.3% of returns)
Here:
$2,925
State:
$7,888
(% of AGI for various income ranges: 19.1% for AGIs below $25k, 16.3% for AGIs $25k-50k, 30.4% for AGIs $50k-75k, 62.7% for AGIs $75k-100k, 197.9% for AGIs $100k-200k, 875.0% for AGIs over 200k)
Net capital gain/loss in AGI: +$9,791 (reported on 12.5% of returns)
Here:
+$9,791
State:
+$23,652
(% of AGI for various income ranges: 7.4% for AGIs below $25k, 37.9% for AGIs $25k-50k, 46.2% for AGIs $50k-75k, 75.9% for AGIs $75k-100k, 695.4% for AGIs $100k-200k, 5685.0% for AGIs over 200k)
Profit/loss from business: +$10,505 (reported on 15.5% of returns)
Here:
+$10,505
State:
+$11,710
(% of AGI for various income ranges: 179.1% for AGIs below $25k, 181.5% for AGIs $25k-50k, 238.1% for AGIs $50k-75k, 187.3% for AGIs $75k-100k, 620.0% for AGIs $100k-200k)
Taxable individual retirement arrangement distribution: $15,789 (reported on 10.0% of returns)
28129:
$15,789
North Carolina:
$20,247
(% of AGI for various income ranges: 99.6% for AGIs below $25k, 95.8% for AGIs $25k-50k, 218.1% for AGIs $50k-75k, 330.0% for AGIs $75k-100k, 810.0% for AGIs $100k-200k)
Total itemized deductions: $29,650 (reported on 5.2% of returns)
Here:
$29,650
State:
$34,549
(% of AGI for various income ranges: 127.1% for AGIs $25k-50k, 269.1% for AGIs $75k-100k, 677.5% for AGIs $100k-200k, 6360.0% for AGIs over 200k)
Charity contributions: $13,518 (reported on 4.1% of returns)
Here:
$13,518
State:
$13,360
(% of AGI for various income ranges: 20.6% for AGIs $25k-50k, 78.2% for AGIs $75k-100k, 237.9% for AGIs $100k-200k, 3185.0% for AGIs over 200k)
Taxes paid: $7,243 (reported on 5.2% of returns)
28129:
$7,243
State:
$7,586
(% of AGI for various income ranges: 26.3% for AGIs $25k-50k, 70.5% for AGIs $75k-100k, 192.1% for AGIs $100k-200k, 1305.0% for AGIs over 200k)
Earned income credit: $2,067 (reported on 14.4% of returns)
Here:
$2,067
State:
$2,337
(% of AGI for various income ranges: 82.5% for AGIs below $25k, 71.0% for AGIs $25k-50k)
Percentage of individuals using paid preparers for their 2020 taxes: 94.1%
Here:
94%
State:
93%
(% for various income ranges: 92.4% for AGIs below $25k, 94.3% for AGIs $25k-50k, 95.1% for AGIs $50k-75k, 94.1% for AGIs $75k-100k, 95.2% for AGIs $100k-200k, 100.0% for AGIs over 200k)
Averages for the 2012 tax year for zip code 28129, filed in 2013:
Average Adjusted Gross Income (AGI) in 2012: $52,315 (Individual Income Tax Returns)
Here:
$52,315
State:
$54,937
Salary/wage: $43,285 (reported on 85.1% of returns)
Here:
$43,285
State:
$46,336
(% of AGI for various income ranges: 72.3% for AGIs below $25k, 80.3% for AGIs $25k-50k, 81.4% for AGIs $50k-75k, 82.9% for AGIs $75k-100k, 75.2% for AGIs $100k-200k, 21.7% for AGIs over 200k)
Taxable interest for individuals: $1,180 (reported on 35.3% of returns)
This zip code:
$1,180
North Carolina:
$1,298
(% of AGI for various income ranges: 1.1% for AGIs below $25k, 0.8% for AGIs $25k-50k, 0.3% for AGIs $50k-75k, 0.9% for AGIs $75k-100k, 1.7% for AGIs $100k-200k)
Ordinary dividends: $1,915 (reported on 14.0% of returns)
Here:
$1,915
State:
$6,213
(% of AGI for various income ranges: 0.2% for AGIs below $25k, 0.3% for AGIs $25k-50k, 0.3% for AGIs $50k-75k, 0.5% for AGIs $75k-100k, 1.4% for AGIs $100k-200k)
Net capital gain/loss in AGI: +$4,548 (reported on 8.9% of returns)
Here:
+$4,548
State:
+$12,740
(% of AGI for various income ranges: 0.6% for AGIs $50k-75k, 1.1% for AGIs $75k-100k, 2.4% for AGIs $100k-200k)
Profit/loss from business: +$7,739 (reported on 15.3% of returns)
Here:
+$7,739
State:
+$10,311
(% of AGI for various income ranges: 6.7% for AGIs below $25k, 2.8% for AGIs $25k-50k, 2.9% for AGIs $50k-75k, 1.4% for AGIs $75k-100k, 1.6% for AGIs $100k-200k)
Taxable individual retirement arrangement distribution: $11,214 (reported on 12.3% of returns)
28129:
$11,214
North Carolina:
$15,575
(% of AGI for various income ranges: 5.0% for AGIs below $25k, 3.3% for AGIs $25k-50k, 2.3% for AGIs $50k-75k, 2.4% for AGIs $75k-100k, 3.5% for AGIs $100k-200k)
Total itemized deductions: $19,666 (21% of AGI, reported on 33.6% of returns)
Here:
$19,666
State:
$23,438
Here:
21.3% of AGI
State:
21.5% of AGI
(% of AGI for various income ranges: 10.8% for AGIs below $25k, 9.7% for AGIs $25k-50k, 13.1% for AGIs $50k-75k, 13.9% for AGIs $75k-100k, 17.1% for AGIs $100k-200k, 9.7% for AGIs over 200k)
Charity contributions: $4,769 (reported on 27.7% of returns)
Here:
$4,769
State:
$4,687
(% of AGI for various income ranges: 1.5% for AGIs below $25k, 1.7% for AGIs $25k-50k, 2.3% for AGIs $50k-75k, 2.1% for AGIs $75k-100k, 6.4% for AGIs $100k-200k)
Taxes paid: $6,563 (reported on 33.6% of returns)
28129:
$6,563
State:
$8,823
(% of AGI for various income ranges: 1.9% for AGIs below $25k, 2.3% for AGIs $25k-50k, 3.9% for AGIs $50k-75k, 4.9% for AGIs $75k-100k, 6.7% for AGIs $100k-200k, 4.3% for AGIs over 200k)
Earned income credit: $2,053 (reported on 18.3% of returns)
Here:
$2,053
State:
$2,376
(% of AGI for various income ranges: 5.4% for AGIs below $25k, 1.2% for AGIs $25k-50k)
Percentage of individuals using paid preparers for their 2012 taxes: 68.1%
Here:
68%
State:
53%
(% for various income ranges: 63.1% for AGIs below $25k, 67.2% for AGIs $25k-50k, 73.0% for AGIs $50k-75k, 69.2% for AGIs $75k-100k, 78.9% for AGIs $100k-200k, 100.0% for AGIs over 200k)
Averages for the 2004 tax year for zip code 28129, filed in 2005:
Average Adjusted Gross Income (AGI) in 2004: $40,852 (Individual Income Tax Returns)
Here:
$40,852
State:
$45,376
Salary/wage: $37,656 (reported on 86.2% of returns)
Here:
$37,656
State:
$39,442
(% of AGI for various income ranges: 87.5% for AGIs below $10k, 78.5% for AGIs $10k-25k, 85.8% for AGIs $25k-50k, 87.3% for AGIs $50k-75k, 84.9% for AGIs $75k-100k, 59.5% for AGIs over 100k)
Taxable interest for individuals: $1,255 (reported on 40.3% of returns)
This zip code:
$1,255
North Carolina:
$1,515
(% of AGI for various income ranges: 5.1% for AGIs below $10k, 2.1% for AGIs $10k-25k, 1.1% for AGIs $25k-50k, 0.5% for AGIs $50k-75k, 0.5% for AGIs $75k-100k, 2.0% for AGIs over 100k)
Taxable dividends: $1,922 (reported on 15.5% of returns)
Here:
$1,922
State:
$4,016
(% of AGI for various income ranges: 1.3% for AGIs below $10k, 0.8% for AGIs $10k-25k, 0.4% for AGIs $25k-50k, 0.3% for AGIs $50k-75k, 0.3% for AGIs $75k-100k, 1.9% for AGIs over 100k)
Net capital gain/loss: +$3,020 (reported on 10.8% of returns)
Here:
+$3,020
State:
+$11,152
(% of AGI for various income ranges: -1.0% for AGIs below $10k, 0.4% for AGIs $10k-25k, 0.2% for AGIs $25k-50k, 1.1% for AGIs $50k-75k, 0.0% for AGIs $75k-100k, 2.0% for AGIs over 100k)
Profit/loss from business: +$7,561 (reported on 16.5% of returns)
Here:
+$7,561
State:
+$9,490
(% of AGI for various income ranges: 9.5% for AGIs below $10k, 6.0% for AGIs $10k-25k, 3.5% for AGIs $25k-50k, 2.7% for AGIs $50k-75k, 3.7% for AGIs $75k-100k, 0.5% for AGIs over 100k)
IRA payment deduction: $3,143 (reported on 1.8% of returns)
28129:
$3,143
North Carolina:
$2,967
Total itemized deductions: $16,244 (22% of AGI, reported on 31.7% of returns)
Here:
$16,244
State:
$19,464
Here:
22.2% of AGI
State:
22.7% of AGI
(% of AGI for various income ranges: 10.8% for AGIs below $10k, 6.2% for AGIs $10k-25k, 10.1% for AGIs $25k-50k, 13.6% for AGIs $50k-75k, 15.4% for AGIs $75k-100k, 15.5% for AGIs over 100k)
Charity contributions deductions: $3,626 (5% of AGI, reported on 26.5% of returns)
Here:
$3,626
State:
$4,035
Here:
4.8% of AGI
State:
4.5% of AGI
(% of AGI for various income ranges: 1.6% for AGIs below $10k, 1.0% for AGIs $10k-25k, 1.5% for AGIs $25k-50k, 2.2% for AGIs $50k-75k, 2.5% for AGIs $75k-100k, 4.1% for AGIs over 100k)
Total tax: $5,325 (reported on 76.7% of returns)
28129:
$5,325
State:
$7,257
(% of AGI for various income ranges: 4.6% for AGIs below $10k, 4.2% for AGIs $10k-25k, 6.8% for AGIs $25k-50k, 8.2% for AGIs $50k-75k, 10.4% for AGIs $75k-100k, 18.5% for AGIs over 100k)
Earned income credit: $1,743 (reported on 15.6% of returns)
Here:
$1,743
State:
$1,851
Percentage of individuals using paid preparers for their 2004 taxes: 73.5%
Here:
74%
State:
62%
(% for various income ranges: 64.1% for AGIs below $10k, 76.2% for AGIs $10k-25k, 73.2% for AGIs $25k-50k, 78.4% for AGIs $50k-75k, 73.7% for AGIs $75k-100k, 80.2% for AGIs over 100k)
Household received Food Stamps/SNAP in the past 12 months: 222 Household did not receive Food Stamps/SNAP in the past 12 months: 2,160
Women who had a birth in the past 12 months: 48 (22 now married, 25 unmarried) Women who did not have a birth in the past 12 months: 1,299 (702 now married, 599 unmarried)
Housing units in zip code 28129 with a mortgage: 1,370 (78 second mortgage, 74 both second mortgage and home equity loan) Houses without a mortgage: 96
Median monthly owner costs for units with a mortgage: $1,291 Median monthly owner costs for units without a mortgage: $379
Residents with income below the poverty level in 2022:
This zip code:
4.5%
Whole state:
12.8%
Residents with income below 50% of the poverty level in 2022:
This zip code:
1.5%
Whole state:
6.8%
Median number of rooms in houses and condos:
Here:
6.5
State:
6.4
Median number of rooms in apartments:
Here:
4.7
State:
4.4
Notable locations in this zip code not listed on our city pages
Churches in zip code 28129 include: Hatley Grove Church (A), Liberty Hill Church (B), Barbee Church (C), West Oakboro Church (D), Mineral Springs Church (E), Pleasant Grove Church (F), Smith Grove Church (G). Display/hide their locations on the map
Streams, rivers, and creeks: Coldwater Branch (A), Allison Branch (B), Big Bear Creek (C), Stony Run (D), Horse Branch (E), Gilberts Creek (F). Display/hide their locations on the map
651 married couples with children.
242 single-parent households (88 men, 154 women).
95.6% of residents of 28129 zip code speak English at home.
3.9% of residents speak Spanish at home (64% very well, 12% well, 13% not well, 11% not at all).
0.2% of residents speak other Indo-European language at home (100% very well).
Foreign born population: 96 (1.7%) (13.8% of them are naturalized citizens)
This zip code:
1.7%
Whole state:
8.6%
69%Honduras
7%Serbia
6%France
4%Guatemala
3%Bolivia
2%El Salvador
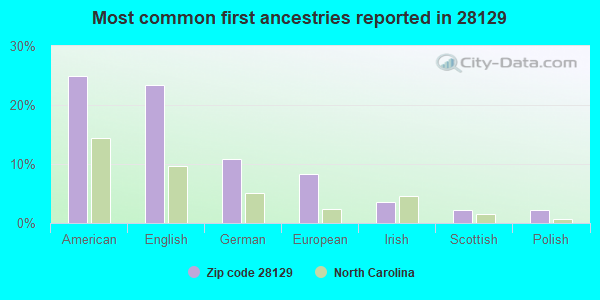
25%American
23%English
11%German
8%European
4%Irish
2%Scottish
2%Polish
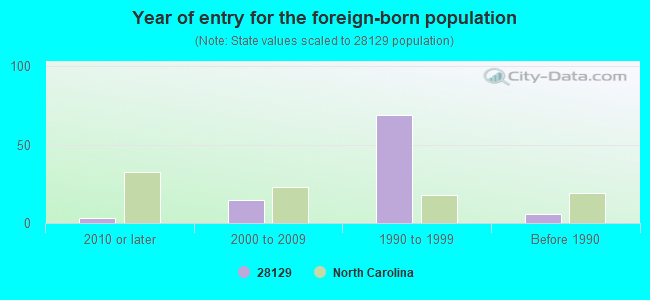
Year of entry for the foreign-born population
32010 or later
152000 to 2009
691990 to 1999
6Before 1990
Facilities with environmental interests located in this zip code:
AUTOTECH BODY SHOP INC (19328 WADE RD in OAKBORO, NC)
Conditionally Exempt Small Quantity Generators, less than 100 kg/month of hazardous waste (Resource Conservation and Recovery Act (tracking hazardous waste)) - notification Organizations: BILLY J HUNEYCUTT (CONTACT/OWNER)
Housing units lacking complete plumbing facilities: 0.3% Housing units lacking complete kitchen facilities: 0.6%
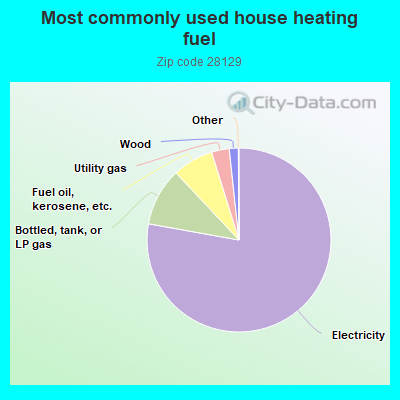
77.9%Electricity
10.2%Bottled, tank, or LP gas
7.2%Fuel oil, kerosene, etc.
3.1%Utility gas
1.6%Wood
Population in 1990: 6,336.
Place of birth for U.S.-born residents:
This state: 4,616
Northeast: 492
Midwest: 79
South: 391
West: 49
70% of the 28129 zip code residents lived in the same house 5 years ago. Out of people who lived in different houses, 54% lived in this county. Out of people who lived in different counties, 50% lived in North Carolina.
91% of the 28129 zip code residents lived in the same house 1 year ago. Out of people who lived in different houses, 37% moved from this county. Out of people who lived in different houses, 61% moved from different county within same state. Out of people who lived in different houses, 2% moved from different state. Out of people who lived in different houses, 1% moved from abroad.
Private vs. public school enrollment:
Students in private schools in grades 1 to 8 (elementary and middle school): 88
Here:
18.0%
North Carolina:
13.8%
Students in private schools in grades 9 to 12 (high school): 20
Here:
10.2%
North Carolina:
11.9%
Students in private undergraduate colleges: 14
Here:
5.6%
North Carolina:
19.3%
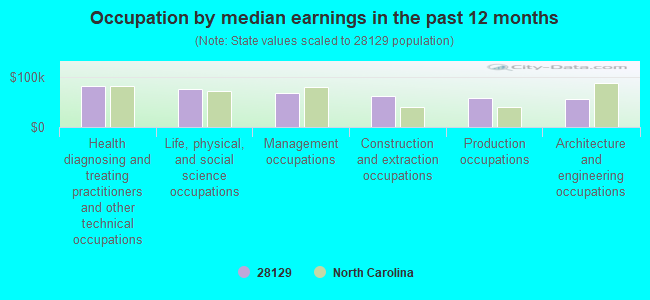
Occupation by median earnings in the past 12 months ($)
81,653Health diagnosing and treating practitioners and other technical occupations
75,809Life, physical, and social science occupations
68,996Management occupations
63,195Construction and extraction occupations
58,076Production occupations
56,714Architecture and engineering occupations
Top industries in this zip code by the number of employees in 2005:
Health Care and Social Assistance: Child Day Care Services (50-99 employees: 1 establishment, 5-9 employees: 1 establishment, 1-4 employees: 1 establishment)
Wholesale Trade: Metal Service Centers and Other Metal Merchant Wholesalers (50-99: 1, 5-9: 1)
Wholesale Trade: Construction and Mining (except Oil Well) Machinery and Equipment Merchant Wholesalers (20-49: 1, 1-4: 1)
People in group quarters in 2000:
7 people in other noninstitutional group quarters
Fatal accident statistics in 2013:
Fatal accident count: 1
Vehicles involved in fatal accidents: 2
Fatal accidents caused by drunken drivers: 0
Fatalities: 1
Persons involved in fatal accidents: 3
Pedestrians involved in fatal accidents: 0
2002 - 2018 National Fire Incident Reporting System (NFIRS) incidents
According to the data from the years 2002 - 2018 the average number of fires per year is 29. The highest number of fire incidents - 68 took place in 2007, and the least - 14 in 2017. The data has a dropping trend.
When looking into fire subcategories, the most incidents belonged to: Outside Fires (42.2%), and Structure Fires (38.6%).
Fire incident types reported to NFIRS in Zip Code 28129


 Nearest zip codes: 28097, 28163, 28001, 28128, 28124, 28107.


 According to the data from the years 2002 - 2018 the average number of fires per year is 29. The highest number of fire incidents - 68 took place in 2007, and the least - 14 in 2017. The data has a dropping trend.
 When looking into fire subcategories, the most incidents belonged to: Outside Fires (42.2%), and Structure Fires (38.6%).