Estimated zip code population in 2022: 2,764 Zip code population in 2010: 2,445 Zip code population in 2000: 2,543
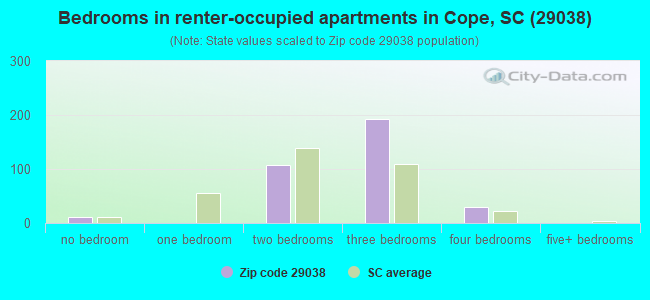
Houses and condos: 1,327 Renter-occupied apartments: 347
% of renters here:
29%
State:
28%
March 2022 cost of living index in zip code 29038: 79.6 (low, U.S. average is 100)
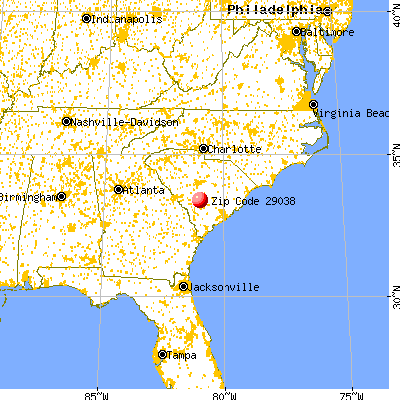
Land area: 80.2 sq. mi. Water area: 0.4 sq. mi.
Population density: 34 people per square mile
(very low).
OSM Map
General Map
Google Map
MSN Map
OSM Map
General Map
Google Map
MSN Map
OSM Map
General Map
Google Map
MSN Map
OSM Map
General Map
Google Map
MSN Map
Please wait while loading the map...
Real estate property taxes paid for housing units in 2022:
This zip code:
0.5% ($682)
South Carolina:
0.5% ($1,185)
Median real estate property taxes paid for housing units with mortgages in 2022: $1,196 (0.6%) Median real estate property taxes paid for housing units with no mortgage in 2022: $479 (0.5%)
Business Search- 14 Million verified businesses
Males: 1,202
(43.5%)
Females: 1,563
(56.5%)
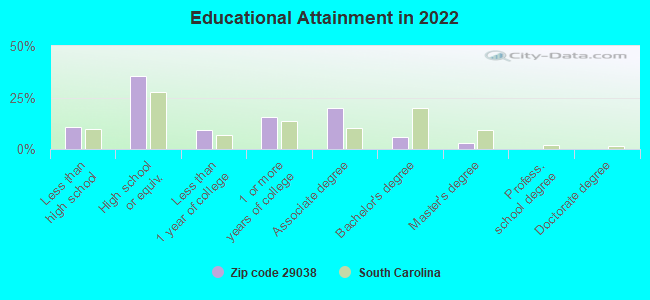
For population 25 years and over in 29038:
High school or higher: 87.8%
Bachelor's degree or higher: 8.9%
Graduate or professional degree: 3.2%
Unemployed: 4.2%
Mean travel time to work (commute): 32.0 minutes
For population 15 years and over in 29038:
Never married: 32.2%
Now married: 47.0%
Separated: 5.1%
Widowed: 9.5%
Divorced: 6.2%
Zip code 29038 compared to state average:
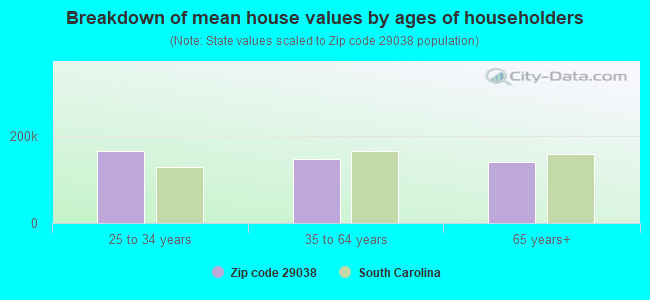
Median house value below state average.
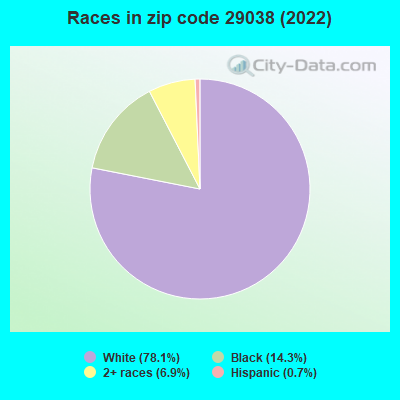
Black race population percentage below state average.
Hispanic race population percentage significantly below state average.
Foreign-born population percentage significantly below state average.
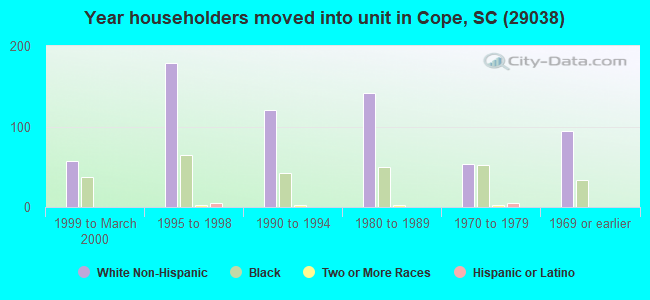
Length of stay since moving in significantly above state average.
Percentage of population with a bachelor's degree or higher significantly below state average.
Estimated median house/condo value in 2022: $130,597
29038:
$130,597
South Carolina:
$254,600
According to our research of South Carolina and other state lists, there was 1 registered sex offender living in 29038 zip code as of May 09, 2024. The ratio of all residents to sex offenders in zip code 29038 is 2,056 to 1. The ratio of registered sex offenders to all residents in this zip code is lower than the state average.
Median resident age:
This zip code:
37.8 years
South Carolina median age:
40.5 years
Average household size:
This zip code:
2.3 people
South Carolina:
2.4 people
Averages for the 2020 tax year for zip code 29038, filed in 2021:
Average Adjusted Gross Income (AGI) in 2020: $46,678 (Individual Income Tax Returns)
Here:
$46,678
State:
$65,754
Salary/wage: $42,275 (reported on 85.3% of returns)
Here:
$42,275
State:
$52,566
(% of AGI for various income ranges: 1354.8% for AGIs below $25k, 4283.0% for AGIs $25k-50k, 7674.4% for AGIs $50k-75k, 11926.0% for AGIs $75k-100k, 21110.0% for AGIs $100k-200k)
Taxable interest for individuals: $317 (reported on 16.5% of returns)
This zip code:
$317
South Carolina:
$1,749
(% of AGI for various income ranges: 2.4% for AGIs below $25k, 9.1% for AGIs $25k-50k, 4.4% for AGIs $50k-75k, 4.0% for AGIs $75k-100k, 38.3% for AGIs $100k-200k)
Ordinary dividends: $1,512 (reported on 7.3% of returns)
Here:
$1,512
State:
$8,783
(% of AGI for various income ranges: 16.5% for AGIs $25k-50k, 138.3% for AGIs $100k-200k)
Net capital gain/loss in AGI: +$3,071 (reported on 6.4% of returns)
Here:
+$3,071
State:
+$24,194
(% of AGI for various income ranges: 8.3% for AGIs $25k-50k, 326.7% for AGIs $100k-200k)
Profit/loss from business: +$7,362 (reported on 14.7% of returns)
Here:
+$7,362
State:
+$11,253
(% of AGI for various income ranges: 186.6% for AGIs below $25k, 117.4% for AGIs $25k-50k, 90.0% for AGIs $50k-75k, 572.0% for AGIs $75k-100k)
Taxable individual retirement arrangement distribution: $13,617 (reported on 5.5% of returns)
29038:
$13,617
South Carolina:
$21,604
(% of AGI for various income ranges: 210.9% for AGIs $25k-50k, 664.0% for AGIs $75k-100k)
Total itemized deductions: $32,900 (reported on 2.8% of returns)
Here:
$32,900
State:
$35,199
(% of AGI for various income ranges: 1974.0% for AGIs $75k-100k)
Charity contributions: $8,567 (reported on 2.8% of returns)
Here:
$8,567
State:
$14,319
(% of AGI for various income ranges: 285.6% for AGIs $50k-75k)
Taxes paid: $7,100 (reported on 2.8% of returns)
29038:
$7,100
State:
$7,486
(% of AGI for various income ranges: 426.0% for AGIs $75k-100k)
Earned income credit: $2,650 (reported on 23.9% of returns)
Here:
$2,650
State:
$2,397
(% of AGI for various income ranges: 159.3% for AGIs below $25k, 98.7% for AGIs $25k-50k)
Percentage of individuals using paid preparers for their 2020 taxes: 93.6%
Here:
94%
State:
93%
(% for various income ranges: 92.7% for AGIs below $25k, 93.9% for AGIs $25k-50k, 92.9% for AGIs $50k-75k, 100.0% for AGIs $75k-100k, 91.7% for AGIs $100k-200k)
Averages for the 2012 tax year for zip code 29038, filed in 2013:
Average Adjusted Gross Income (AGI) in 2012: $39,095 (Individual Income Tax Returns)
Here:
$39,095
State:
$51,133
Salary/wage: $35,729 (reported on 89.1% of returns)
Here:
$35,729
State:
$42,173
(% of AGI for various income ranges: 79.4% for AGIs below $25k, 85.5% for AGIs $25k-50k, 81.1% for AGIs $50k-75k, 85.8% for AGIs $75k-100k, 75.3% for AGIs $100k-200k)
Taxable interest for individuals: $525 (reported on 18.2% of returns)
This zip code:
$525
South Carolina:
$1,468
(% of AGI for various income ranges: 0.6% for AGIs below $25k, 0.4% for AGIs $25k-50k, 0.1% for AGIs $75k-100k, 0.1% for AGIs $100k-200k)
Ordinary dividends: $1,588 (reported on 7.3% of returns)
Here:
$1,588
State:
$6,511
(% of AGI for various income ranges: 0.3% for AGIs $25k-50k, 0.2% for AGIs $50k-75k, 0.8% for AGIs $100k-200k)
Net capital gain/loss in AGI: +$3,780 (reported on 4.5% of returns)
Here:
+$3,780
State:
+$13,061
Profit/loss from business: +$4,380 (reported on 13.6% of returns)
Here:
+$4,380
State:
+$10,167
(% of AGI for various income ranges: 5.8% for AGIs below $25k, 1.3% for AGIs $25k-50k, 2.0% for AGIs $75k-100k)
Taxable individual retirement arrangement distribution: $11,362 (reported on 7.3% of returns)
29038:
$11,362
South Carolina:
$17,019
(% of AGI for various income ranges: 1.9% for AGIs below $25k, 2.1% for AGIs $25k-50k, 6.8% for AGIs $50k-75k)
Total itemized deductions: $18,891 (24% of AGI, reported on 20.9% of returns)
Here:
$18,891
State:
$22,890
Here:
23.7% of AGI
State:
21.4% of AGI
(% of AGI for various income ranges: 4.8% for AGIs below $25k, 7.4% for AGIs $25k-50k, 9.9% for AGIs $50k-75k, 12.5% for AGIs $75k-100k, 14.8% for AGIs $100k-200k)
Charity contributions: $5,111 (reported on 17.3% of returns)
Here:
$5,111
State:
$5,169
(% of AGI for various income ranges: 2.2% for AGIs $25k-50k, 1.8% for AGIs $50k-75k, 2.7% for AGIs $75k-100k, 3.8% for AGIs $100k-200k)
Taxes paid: $6,178 (reported on 20.9% of returns)
29038:
$6,178
State:
$7,644
(% of AGI for various income ranges: 1.1% for AGIs below $25k, 1.5% for AGIs $25k-50k, 2.9% for AGIs $50k-75k, 4.7% for AGIs $75k-100k, 5.9% for AGIs $100k-200k)
Earned income credit: $2,528 (reported on 29.1% of returns)
Here:
$2,528
State:
$2,418
(% of AGI for various income ranges: 10.1% for AGIs below $25k, 1.6% for AGIs $25k-50k)
Percentage of individuals using paid preparers for their 2012 taxes: 61.8%
Here:
62%
State:
57%
(% for various income ranges: 56.0% for AGIs below $25k, 63.3% for AGIs $25k-50k, 71.4% for AGIs $50k-75k, 66.7% for AGIs $75k-100k, 71.4% for AGIs $100k-200k)
Averages for the 2004 tax year for zip code 29038, filed in 2005:
Average Adjusted Gross Income (AGI) in 2004: $32,864 (Individual Income Tax Returns)
Here:
$32,864
State:
$41,965
Salary/wage: $31,150 (reported on 91.0% of returns)
Here:
$31,150
State:
$35,695
(% of AGI for various income ranges: 106.5% for AGIs below $10k, 88.2% for AGIs $10k-25k, 89.9% for AGIs $25k-50k, 86.3% for AGIs $50k-75k, 87.9% for AGIs $75k-100k, 67.4% for AGIs over 100k)
Taxable interest for individuals: $863 (reported on 23.3% of returns)
This zip code:
$863
South Carolina:
$1,623
(% of AGI for various income ranges: 1.4% for AGIs below $10k, 1.0% for AGIs $10k-25k, 0.8% for AGIs $25k-50k, 0.3% for AGIs $50k-75k, 0.2% for AGIs $75k-100k, 0.8% for AGIs over 100k)
Taxable dividends: $921 (reported on 10.4% of returns)
Here:
$921
State:
$3,999
(% of AGI for various income ranges: 0.3% for AGIs $10k-25k, 0.3% for AGIs $25k-50k, 0.2% for AGIs $50k-75k, 0.1% for AGIs $75k-100k, 0.8% for AGIs over 100k)
Net capital gain/loss: +$2,740 (reported on 7.0% of returns)
Here:
+$2,740
State:
+$13,100
(% of AGI for various income ranges: -0.1% for AGIs $10k-25k, 0.3% for AGIs $25k-50k, 0.0% for AGIs $50k-75k, 0.4% for AGIs $75k-100k, 4.0% for AGIs over 100k)
Profit/loss from business: +$3,535 (reported on 13.0% of returns)
Here:
+$3,535
State:
+$9,144
(% of AGI for various income ranges: 9.2% for AGIs below $10k, 2.5% for AGIs $10k-25k, 3.5% for AGIs $25k-50k, -0.6% for AGIs $50k-75k, -0.2% for AGIs $75k-100k)
IRA payment deduction: $2,000 (reported on 1.6% of returns)
29038:
$2,000
South Carolina:
$2,972
Total itemized deductions: $15,742 (25% of AGI, reported on 24.1% of returns)
Here:
$15,742
State:
$19,039
Here:
25.3% of AGI
State:
22.8% of AGI
(% of AGI for various income ranges: 5.7% for AGIs $10k-25k, 11.3% for AGIs $25k-50k, 12.7% for AGIs $50k-75k, 15.9% for AGIs $75k-100k, 14.6% for AGIs over 100k)
Charity contributions deductions: $3,746 (6% of AGI, reported on 22.3% of returns)
Here:
$3,746
State:
$4,305
Here:
6.0% of AGI
State:
5.0% of AGI
(% of AGI for various income ranges: 0.9% for AGIs $10k-25k, 1.8% for AGIs $25k-50k, 2.9% for AGIs $50k-75k, 4.3% for AGIs $75k-100k, 4.1% for AGIs over 100k)
Total tax: $3,639 (reported on 67.2% of returns)
29038:
$3,639
State:
$6,497
(% of AGI for various income ranges: 2.7% for AGIs below $10k, 2.9% for AGIs $10k-25k, 6.2% for AGIs $25k-50k, 7.6% for AGIs $50k-75k, 9.8% for AGIs $75k-100k, 14.4% for AGIs over 100k)
Earned income credit: $1,977 (reported on 27.6% of returns)
Here:
$1,977
State:
$1,882
Percentage of individuals using paid preparers for their 2004 taxes: 72.0%
Here:
72%
State:
66%
(% for various income ranges: 66.8% for AGIs below $10k, 70.5% for AGIs $10k-25k, 74.7% for AGIs $25k-50k, 76.5% for AGIs $50k-75k, 71.8% for AGIs $75k-100k, 80.6% for AGIs over 100k)
Household received Food Stamps/SNAP in the past 12 months: 205 Household did not receive Food Stamps/SNAP in the past 12 months: 983
Women who had a birth in the past 12 months: 6 (0 now married, 5 unmarried) Women who did not have a birth in the past 12 months: 701 (344 now married, 358 unmarried)
Housing units in zip code 29038 with a mortgage: 276 (44 second mortgage, 44 both second mortgage and home equity loan) Median monthly owner costs for units with a mortgage: $965 Median monthly owner costs for units without a mortgage: $410
Residents with income below the poverty level in 2022:
This zip code:
17.4%
Whole state:
14.0%
Residents with income below 50% of the poverty level in 2022:
This zip code:
7.2%
Whole state:
7.3%
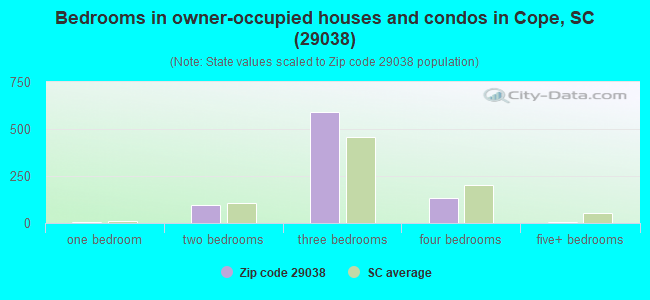
Median number of rooms in houses and condos:
Here:
6.0
State:
6.4
Median number of rooms in apartments:
Here:
5.1
State:
4.5
Notable locations in this zip code not listed on our city pages
Notable locations in zip code 29038: Roberts Swamp Landing (A), Simons Siding (B), Orangeburg County Fire Department Edisto (C), Orangeburg County Fire Department Edisto Station 2 (D), Orangeburg County Fire Department Canaan (E), Orangeburg County Fire Department Station 2 Canaan (F). Display/hide their locations on the map
Churches in zip code 29038 include: Sanctified Church (A), Pine Grove Baptist Church (B), Bethel Church (C), Cana of Galilee Church (D), Canaan Church (E), Cedar Grove Church (F), Emanuel Church (G), Edisto Baptist Church (H), Cope Baptist Church (I). Display/hide their locations on the map
Cemeteries: Canaan Cemetery (1), Bethlehem Cemetery (2), Oakland Cemetery (3), Old Union Cemetery (4), Emanuel Cemetery (5), Oak Grove Baptist Church Cemetery (6), Edisto Baptist Church Cemetery (7). Display/hide their locations on the map
Streams, rivers, and creeks: Twomile Swamp (A), Sucksand Branch (B), Snake Swamp (C), Sam Branch (D), Roberts Swamp (E), Dry Swamp (F), Cooper Swamp (G). Display/hide their locations on the map
Size of family households: 326 2-persons, 81 3-persons, 127 4-persons, 106 5-persons
Size of nonfamily households: 537 1-person
336 married couples with children.
211 single-parent households (45 men, 166 women).
94.7% of residents of 29038 zip code speak English at home.
3.6% of residents speak Spanish at home (100% very well).
1.5% of residents speak other Indo-European language at home (44% very well, 56% well).
0.5% of residents speak other language at home (21% very well, 79% well).
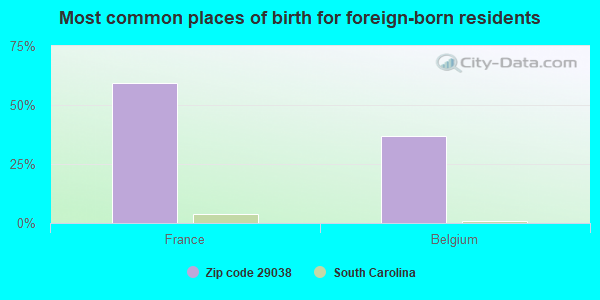
Foreign born population: 29 (1.1%) (100.0% of them are naturalized citizens)
This zip code:
1.1%
Whole state:
5.2%
59%France
37%Belgium
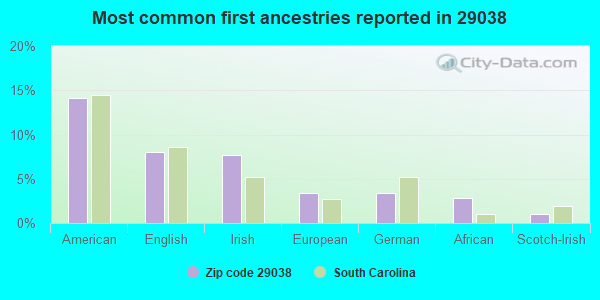
14%American
8%English
8%Irish
3%European
3%German
3%African
1%Scotch-Irish
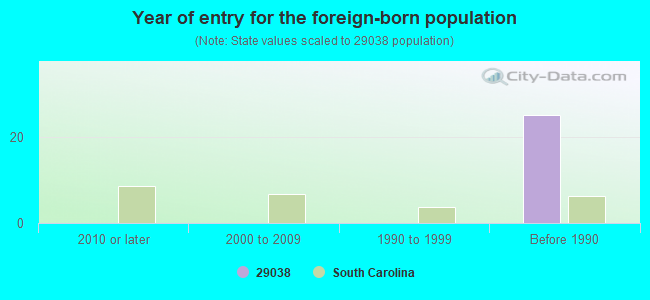
Year of entry for the foreign-born population
02010 or later
02000 to 2009
01990 to 1999
25Before 1990
Facilities with environmental interests located in this zip code:
COPE AREA CAREER CENTER (P O BOX 128 in COPE, SC)
(National Center for Education Statistics) - STATE ID-3880995
Housing units lacking complete plumbing facilities: 2.8% Housing units lacking complete kitchen facilities: 4.5%
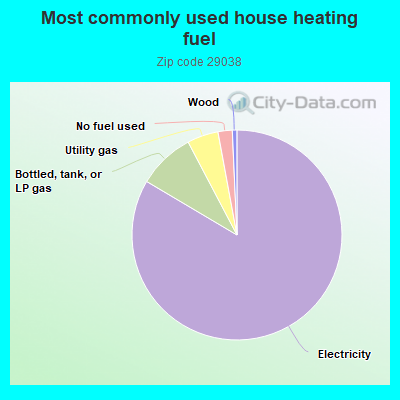
83.6%Electricity
8.8%Bottled, tank, or LP gas
4.8%Utility gas
2.2%No fuel used
0.7%Wood
Population in 1990: 1,962. Population change in the 1990s: +581 (+29.6%).
Place of birth for U.S.-born residents:
This state: 2,404
Northeast: 12
Midwest: 80
South: 172
West: 7
74% of the 29038 zip code residents lived in the same house 5 years ago. Out of people who lived in different houses, 70% lived in this county. Out of people who lived in different counties, 50% lived in South Carolina.
99% of the 29038 zip code residents lived in the same house 1 year ago. Out of people who lived in different houses, 41% moved from this county. Out of people who lived in different houses, 52% moved from different county within same state.
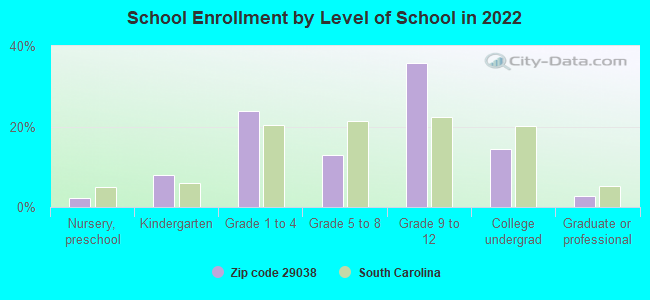
Private vs. public school enrollment:
Students in private schools in grades 1 to 8 (elementary and middle school): 26
Here:
10.9%
South Carolina:
14.4%
Students in private schools in grades 9 to 12 (high school): 17
Here:
7.5%
South Carolina:
11.1%
Students in private undergraduate colleges: 12
Here:
13.5%
South Carolina:
21.9%
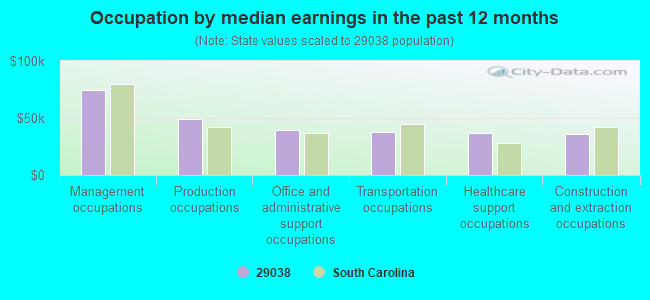
Occupation by median earnings in the past 12 months ($)
74,464Management occupations
48,745Production occupations
39,357Office and administrative support occupations
37,296Transportation occupations
36,677Healthcare support occupations
35,699Construction and extraction occupations
Companies with federal contracts located in this zip code:
WHITMAN MOLD INC (336 DEMPSEY RD in COPE, SC; small business) : $344,256 in 11 contractsfrom 2000 to 2005
Contracts for Training Aids, Fuses, Arresters, Absorbers, and Protectors, Miscellaneous Fabricated Nonmetallic Materials, Rubber and Plastics Working Machinery, and moreby Army Signed by year:2000: $31,455; 2001: $0; 2002: $83,594; 2003: $151,959; 2004: $0; 2005: $77,248; 2006: $0.
Biggest contracts:
$96,744 with Army for Training Aids. Signed on 2003-07-16. Completion date: 2003-09-05.
$51,392 with Army for Fuses, Arresters, Absorbers, and Protectors. Signed on 2002-08-09. Completion date: 2002-10-03.
$37,148 with Army for Miscellaneous Fabricated Nonmetallic Materials. Signed on 2005-08-13. Completion date: 2005-09-30.
$31,455 with Army for Fuses, Arresters, Absorbers, and Protectors. Signed on 2000-05-03. Completion date: 2000-06-15.
Top industries in this zip code by the number of employees in 2005:
Utilities: Electric Power Distribution (50-99 employees: 1 establishment)
Accommodation and Food Services: Limited-Service Restaurants (10-19: 1, 1-4: 1)
Other Services (except Public Administration): Religious Organizations (5-9: 1, 1-4: 2)
Administrative and Support and Waste Management and Remediation Services: Landscaping Services (1-4: 2)
Construction: Structural Steel and Precast Concrete Contractors (1-4: 1)
2003 - 2018 National Fire Incident Reporting System (NFIRS) incidents
Based on the data from the years 2003 - 2018 the average number of fires per year is 37. The highest number of reported fire incidents - 73 took place in 2011, and the least - 6 in 2003. The data has an increasing trend.
When looking into fire subcategories, the most reports belonged to: Outside Fires (38.9%), and Structure Fires (38.7%).
Fire incident types reported to NFIRS in Zip Code 29038


 Nearest zip codes: 29039, 29003, 29113, 29115, 29133, 29117.


 Based on the data from the years 2003 - 2018 the average number of fires per year is 37. The highest number of reported fire incidents - 73 took place in 2011, and the least - 6 in 2003. The data has an increasing trend.
 When looking into fire subcategories, the most reports belonged to: Outside Fires (38.9%), and Structure Fires (38.7%).