Estimated zip code population in 2022: 3,080 Zip code population in 2010: 2,963 Zip code population in 2000: 2,653
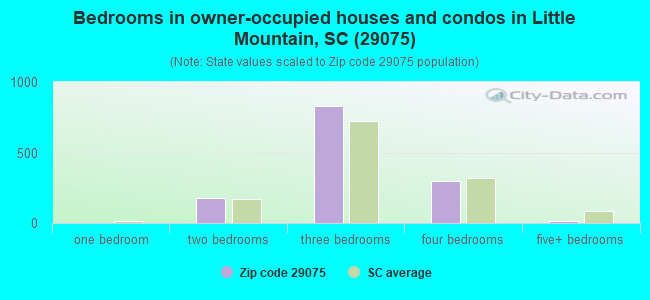
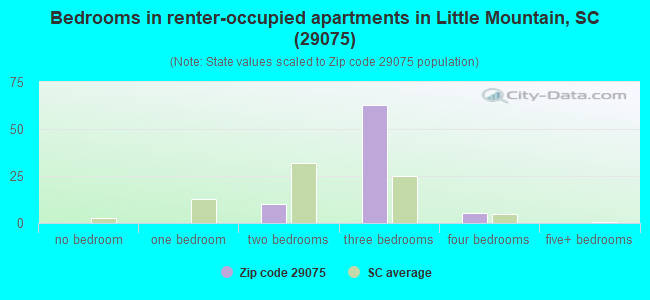
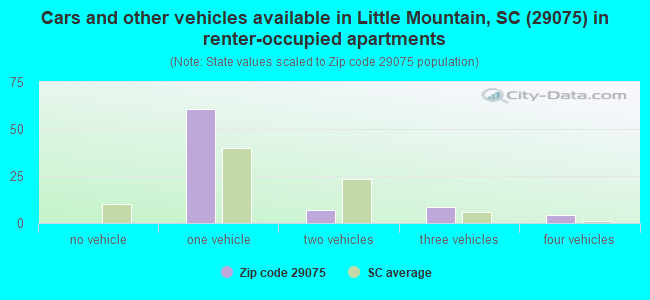
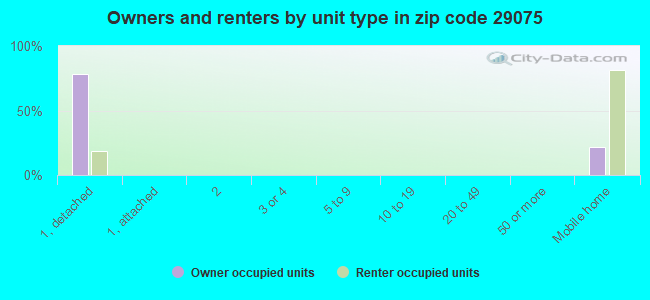
Houses and condos: 1,493 Renter-occupied apartments: 80
% of renters here:
6%
State:
28%
March 2022 cost of living index in zip code 29075: 80.1 (low, U.S. average is 100)
Land area: 42.4 sq. mi. Water area: 0.6 sq. mi.
Population density: 73 people per square mile
(very low).
OSM Map
General Map
Google Map
MSN Map
OSM Map
General Map
Google Map
MSN Map
OSM Map
General Map
Google Map
MSN Map
OSM Map
General Map
Google Map
MSN Map
Please wait while loading the map...
Real estate property taxes paid for housing units in 2022:
This zip code:
0.5% ($1,207)
South Carolina:
0.5% ($1,185)
Median real estate property taxes paid for housing units with mortgages in 2022: $1,780 (0.5%) Median real estate property taxes paid for housing units with no mortgage in 2022: $960 (0.5%)
Business Search- 14 Million verified businesses
Males: 1,518
(49.3%)
Females: 1,562
(50.7%)
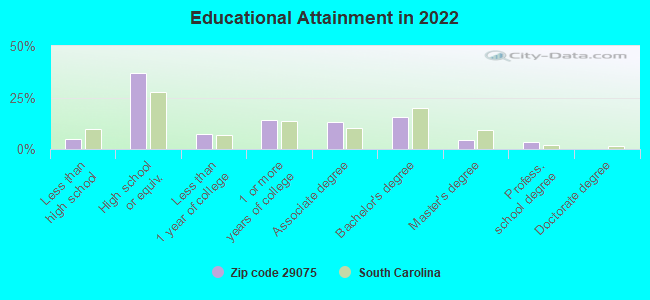
For population 25 years and over in 29075:
High school or higher: 94.0%
Bachelor's degree or higher: 23.3%
Graduate or professional degree: 7.9%
Unemployed: 4.1%
Mean travel time to work (commute): 28.7 minutes
For population 15 years and over in 29075:
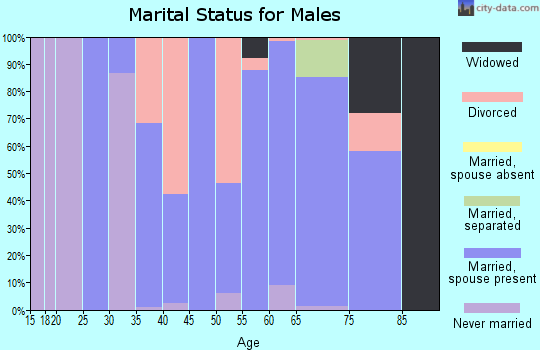
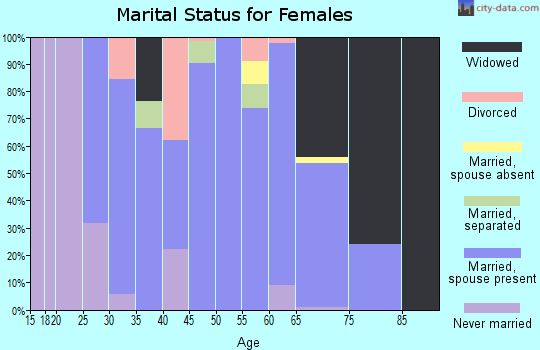
Never married: 16.9%
Now married: 72.0%
Separated: 0.6%
Widowed: 6.1%
Divorced: 4.4%
Zip code 29075 compared to state average:
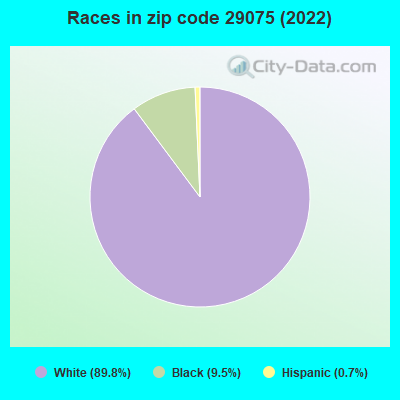
Black race population percentage below state average.
Hispanic race population percentage significantly below state average.
Median age above state average.
Foreign-born population percentage significantly below state average.
Renting percentage significantly below state average.
Length of stay since moving in significantly above state average.
Number of college students significantly below state average.
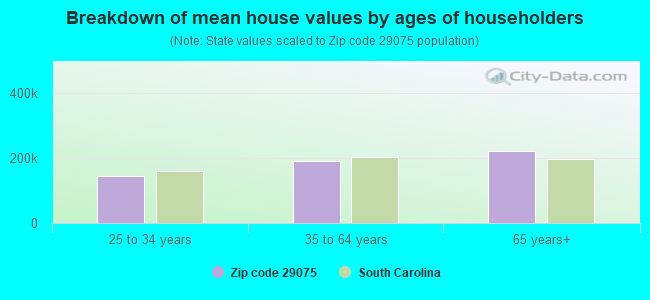
Estimated median house/condo value in 2022: $258,722
29075:
$258,722
South Carolina:
$254,600
According to our research of South Carolina and other state lists, there was 1 registered sex offender living in 29075 zip code as of May 06, 2024. The ratio of all residents to sex offenders in zip code 29075 is 2,973 to 1. The ratio of registered sex offenders to all residents in this zip code is lower than the state average.
Median resident age:
This zip code:
47.5 years
South Carolina median age:
40.5 years
Average household size:
This zip code:
2.2 people
South Carolina:
2.4 people
Averages for the 2020 tax year for zip code 29075, filed in 2021:
Average Adjusted Gross Income (AGI) in 2020: $64,606 (Individual Income Tax Returns)
Here:
$64,606
State:
$65,754
Salary/wage: $56,924 (reported on 79.7% of returns)
Here:
$56,924
State:
$52,566
(% of AGI for various income ranges: 1267.1% for AGIs below $25k, 3797.5% for AGIs $25k-50k, 6454.6% for AGIs $50k-75k, 9314.2% for AGIs $75k-100k, 18528.7% for AGIs $100k-200k)
Taxable interest for individuals: $922 (reported on 32.3% of returns)
This zip code:
$922
South Carolina:
$1,749
(% of AGI for various income ranges: 23.5% for AGIs below $25k, 15.4% for AGIs $25k-50k, 67.7% for AGIs $50k-75k, 122.5% for AGIs $75k-100k, 64.7% for AGIs $100k-200k)
Ordinary dividends: $4,544 (reported on 21.5% of returns)
Here:
$4,544
State:
$8,783
(% of AGI for various income ranges: 34.4% for AGIs below $25k, 28.3% for AGIs $25k-50k, 149.2% for AGIs $50k-75k, 206.7% for AGIs $75k-100k, 171.3% for AGIs $100k-200k)
Net capital gain/loss in AGI: +$4,882 (reported on 17.7% of returns)
Here:
+$4,882
State:
+$24,194
(% of AGI for various income ranges: 6.8% for AGIs below $25k, 1.2% for AGIs $25k-50k, 108.5% for AGIs $50k-75k, 168.3% for AGIs $75k-100k, 357.3% for AGIs $100k-200k)
Profit/loss from business: +$11,271 (reported on 17.7% of returns)
Here:
+$11,271
State:
+$11,253
(% of AGI for various income ranges: 50.3% for AGIs below $25k, 240.8% for AGIs $25k-50k, 201.5% for AGIs $50k-75k, 55.8% for AGIs $75k-100k, 1385.3% for AGIs $100k-200k)
Taxable individual retirement arrangement distribution: $18,916 (reported on 12.0% of returns)
29075:
$18,916
South Carolina:
$21,604
(% of AGI for various income ranges: 94.7% for AGIs below $25k, 154.6% for AGIs $25k-50k, 403.1% for AGIs $50k-75k, 464.2% for AGIs $75k-100k, 1213.3% for AGIs $100k-200k)
Total itemized deductions: $28,730 (reported on 6.3% of returns)
Here:
$28,730
State:
$35,199
(% of AGI for various income ranges: 757.7% for AGIs $50k-75k, 1258.7% for AGIs $100k-200k)
Charity contributions: $10,562 (reported on 5.1% of returns)
Here:
$10,562
State:
$14,319
(% of AGI for various income ranges: 128.5% for AGIs $50k-75k, 452.0% for AGIs $100k-200k)
Taxes paid: $7,350 (reported on 6.3% of returns)
29075:
$7,350
State:
$7,486
(% of AGI for various income ranges: 133.1% for AGIs $50k-75k, 241.3% for AGIs $100k-200k)
Earned income credit: $2,233 (reported on 13.3% of returns)
Here:
$2,233
State:
$2,397
(% of AGI for various income ranges: 93.2% for AGIs below $25k, 63.3% for AGIs $25k-50k)
Percentage of individuals using paid preparers for their 2020 taxes: 93.0%
Here:
93%
State:
93%
(% for various income ranges: 92.2% for AGIs below $25k, 94.1% for AGIs $25k-50k, 90.5% for AGIs $50k-75k, 94.7% for AGIs $75k-100k, 92.6% for AGIs $100k-200k, 100.0% for AGIs over 200k)
Averages for the 2012 tax year for zip code 29075, filed in 2013:
Average Adjusted Gross Income (AGI) in 2012: $51,565 (Individual Income Tax Returns)
Here:
$51,565
State:
$51,133
Salary/wage: $45,908 (reported on 83.1% of returns)
Here:
$45,908
State:
$42,173
(% of AGI for various income ranges: 71.2% for AGIs below $25k, 76.1% for AGIs $25k-50k, 69.9% for AGIs $50k-75k, 77.9% for AGIs $75k-100k, 95.1% for AGIs $100k-200k)
Taxable interest for individuals: $907 (reported on 32.4% of returns)
This zip code:
$907
South Carolina:
$1,468
(% of AGI for various income ranges: 1.2% for AGIs below $25k, 0.8% for AGIs $25k-50k, 0.7% for AGIs $50k-75k, 0.3% for AGIs $75k-100k, 0.5% for AGIs $100k-200k)
Ordinary dividends: $2,106 (reported on 21.8% of returns)
Here:
$2,106
State:
$6,511
(% of AGI for various income ranges: 1.4% for AGIs below $25k, 0.5% for AGIs $25k-50k, 0.8% for AGIs $50k-75k, 1.1% for AGIs $75k-100k, 1.1% for AGIs $100k-200k)
Profit/loss from business: +$8,441 (reported on 15.5% of returns)
Here:
+$8,441
State:
+$10,167
(% of AGI for various income ranges: 7.3% for AGIs below $25k, 1.4% for AGIs $25k-50k, 0.8% for AGIs $50k-75k, 2.2% for AGIs $75k-100k, 3.5% for AGIs $100k-200k)
Taxable individual retirement arrangement distribution: $12,500 (reported on 12.0% of returns)
29075:
$12,500
South Carolina:
$17,019
(% of AGI for various income ranges: 3.6% for AGIs below $25k, 3.3% for AGIs $25k-50k, 5.9% for AGIs $50k-75k, 3.5% for AGIs $100k-200k)
Total itemized deductions: $20,671 (22% of AGI, reported on 34.5% of returns)
Here:
$20,671
State:
$22,890
Here:
22.3% of AGI
State:
21.4% of AGI
(% of AGI for various income ranges: 8.5% for AGIs below $25k, 12.9% for AGIs $25k-50k, 14.3% for AGIs $50k-75k, 14.1% for AGIs $75k-100k, 15.6% for AGIs $100k-200k, 13.8% for AGIs over 200k)
Charity contributions: $4,243 (reported on 29.6% of returns)
Here:
$4,243
State:
$5,169
(% of AGI for various income ranges: 1.1% for AGIs below $25k, 1.7% for AGIs $25k-50k, 2.5% for AGIs $50k-75k, 2.5% for AGIs $75k-100k, 3.9% for AGIs $100k-200k)
Taxes paid: $7,116 (reported on 35.2% of returns)
29075:
$7,116
State:
$7,644
(% of AGI for various income ranges: 1.1% for AGIs below $25k, 2.6% for AGIs $25k-50k, 3.9% for AGIs $50k-75k, 4.9% for AGIs $75k-100k, 7.0% for AGIs $100k-200k, 7.3% for AGIs over 200k)
Earned income credit: $2,509 (reported on 15.5% of returns)
Here:
$2,509
State:
$2,418
(% of AGI for various income ranges: 6.7% for AGIs below $25k, 0.8% for AGIs $25k-50k)
Percentage of individuals using paid preparers for their 2012 taxes: 64.1%
Here:
64%
State:
57%
(% for various income ranges: 60.0% for AGIs below $25k, 61.8% for AGIs $25k-50k, 72.2% for AGIs $50k-75k, 68.8% for AGIs $75k-100k, 76.5% for AGIs $100k-200k)
Averages for the 2004 tax year for zip code 29075, filed in 2005:
Average Adjusted Gross Income (AGI) in 2004: $46,428 (Individual Income Tax Returns)
Here:
$46,428
State:
$41,965
Salary/wage: $40,678 (reported on 85.9% of returns)
Here:
$40,678
State:
$35,695
(% of AGI for various income ranges: 119.7% for AGIs below $10k, 79.8% for AGIs $10k-25k, 77.2% for AGIs $25k-50k, 80.8% for AGIs $50k-75k, 82.0% for AGIs $75k-100k, 63.7% for AGIs over 100k)
Taxable interest for individuals: $1,176 (reported on 44.5% of returns)
This zip code:
$1,176
South Carolina:
$1,623
(% of AGI for various income ranges: 1.6% for AGIs below $10k, 2.4% for AGIs $10k-25k, 1.3% for AGIs $25k-50k, 1.2% for AGIs $50k-75k, 0.8% for AGIs $75k-100k, 0.8% for AGIs over 100k)
Taxable dividends: $1,688 (reported on 26.0% of returns)
Here:
$1,688
State:
$3,999
(% of AGI for various income ranges: 2.3% for AGIs below $10k, 1.3% for AGIs $10k-25k, 0.8% for AGIs $25k-50k, 0.6% for AGIs $50k-75k, 0.9% for AGIs $75k-100k, 1.1% for AGIs over 100k)
Net capital gain/loss: +$6,553 (reported on 17.0% of returns)
Here:
+$6,553
State:
+$13,100
(% of AGI for various income ranges: -0.2% for AGIs below $10k, -0.5% for AGIs $10k-25k, 0.2% for AGIs $25k-50k, 2.4% for AGIs $50k-75k, 2.0% for AGIs $75k-100k, 4.8% for AGIs over 100k)
Profit/loss from business: +$8,446 (reported on 15.0% of returns)
Here:
+$8,446
State:
+$9,144
(% of AGI for various income ranges: -7.9% for AGIs below $10k, 3.3% for AGIs $10k-25k, 4.2% for AGIs $25k-50k, 1.5% for AGIs $50k-75k, 3.1% for AGIs $75k-100k, 2.7% for AGIs over 100k)
IRA payment deduction: $3,106 (reported on 3.6% of returns)
29075:
$3,106
South Carolina:
$2,972
(% of AGI for various income ranges: 0.4% for AGIs $10k-25k, 0.3% for AGIs $25k-50k, 0.3% for AGIs $50k-75k, 0.4% for AGIs $75k-100k)
Total itemized deductions: $17,033 (20% of AGI, reported on 35.0% of returns)
Here:
$17,033
State:
$19,039
Here:
20.3% of AGI
State:
22.8% of AGI
(% of AGI for various income ranges: 7.1% for AGIs $10k-25k, 10.8% for AGIs $25k-50k, 14.7% for AGIs $50k-75k, 15.2% for AGIs $75k-100k, 13.7% for AGIs over 100k)
Charity contributions deductions: $3,734 (4% of AGI, reported on 31.8% of returns)
Here:
$3,734
State:
$4,305
Here:
4.3% of AGI
State:
5.0% of AGI
(% of AGI for various income ranges: 1.8% for AGIs $10k-25k, 1.7% for AGIs $25k-50k, 2.1% for AGIs $50k-75k, 2.8% for AGIs $75k-100k, 3.6% for AGIs over 100k)
Total tax: $6,618 (reported on 78.0% of returns)
29075:
$6,618
State:
$6,497
(% of AGI for various income ranges: 2.7% for AGIs below $10k, 4.0% for AGIs $10k-25k, 7.2% for AGIs $25k-50k, 8.0% for AGIs $50k-75k, 10.3% for AGIs $75k-100k, 18.2% for AGIs over 100k)
Earned income credit: $1,809 (reported on 13.8% of returns)
Here:
$1,809
State:
$1,882
Percentage of individuals using paid preparers for their 2004 taxes: 68.5%
Here:
69%
State:
66%
(% for various income ranges: 59.9% for AGIs below $10k, 68.9% for AGIs $10k-25k, 72.2% for AGIs $25k-50k, 70.3% for AGIs $50k-75k, 70.2% for AGIs $75k-100k, 70.8% for AGIs over 100k)
Household received Food Stamps/SNAP in the past 12 months: 80 Household did not receive Food Stamps/SNAP in the past 12 months: 1,298
Women who had a birth in the past 12 months: 18 (19 now married, 0 unmarried) Women who did not have a birth in the past 12 months: 522 (356 now married, 170 unmarried)
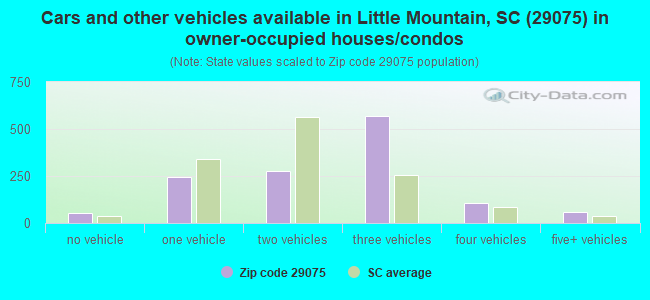
Housing units in zip code 29075 with a mortgage: 543 (96 second mortgage, 96 both second mortgage and home equity loan) Houses without a mortgage: 1
Median monthly owner costs for units with a mortgage: $1,532 Median monthly owner costs for units without a mortgage: $373
Residents with income below the poverty level in 2022:
This zip code:
5.0%
Whole state:
14.0%
Residents with income below 50% of the poverty level in 2022:
This zip code:
4.2%
Whole state:
7.3%
Median number of rooms in houses and condos:
Here:
6.0
State:
6.4
Median number of rooms in apartments:
Here:
4.1
State:
4.5
Notable locations in this zip code not listed on our city pages
Churches in zip code 29075 include: Providence Church (A), Holy Trinity Evangelical Lutheran Church (B), Mount Zion Church (C), Capers Chapel (D), Piney Grove Church (E). Display/hide their locations on the map
Cemeteries: Capers Chapel Cemetery (1), Holy Trinity Cemetery (2), Mount Tabor Cemetery (3), Mount Zion Cemetery (4), Thomas Boyd Cemetery (5), Schmitz Cemetery (6), Meetzer-Orris Cemetery (7). Display/hide their locations on the map
In group quarters: 19 (-1 institutionalized population)
Size of family households: 531 2-persons, 229 3-persons, 210 4-persons, 18 5-persons, 3 6-persons
Size of nonfamily households: 338 1-person, 50 2-persons
589 married couples with children.
12 single-parent households (12 women).
100.2% of residents of 29075 zip code speak English at home.
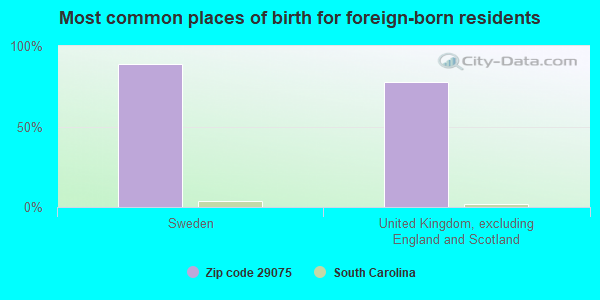
Foreign born population: 8 (0.3%) (24.9% of them are naturalized citizens)
This zip code:
0.3%
Whole state:
5.2%
89%Sweden
78%United Kingdom, excluding England and Scotland
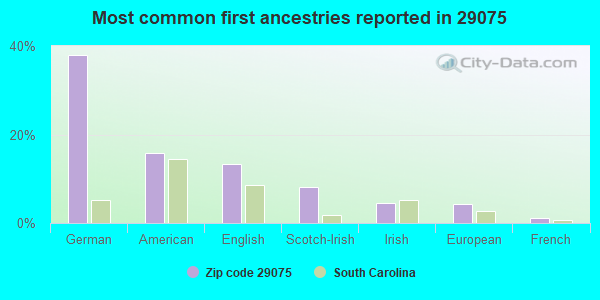
38%German
16%American
13%English
8%Scotch-Irish
5%Irish
4%European
1%French
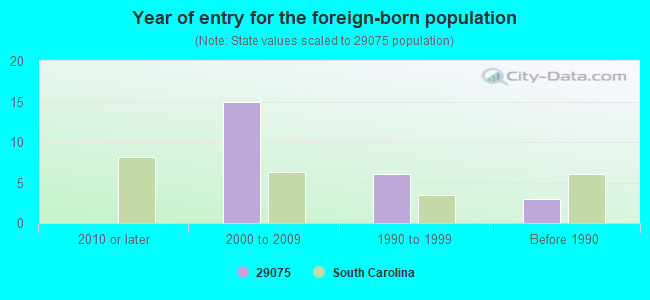
Year of entry for the foreign-born population
02010 or later
152000 to 2009
61990 to 1999
3Before 1990
Facilities with environmental interests located in this zip code:
AT&T LITTLE MOUNTAIN (MOUNTAIN RD in LITTLE MOUNTAIN, SC)
(Resource Conservation and Recovery Act (tracking hazardous waste)) STATE MASTER (South Carolina database) - HAZARDOUS WASTE PROGRAM Organizations: AT & T (CONTACT/OWNER)
Alternative names: AT&T - LITTLE MOUNTAIN (DEACTIVATED)
Housing units lacking complete plumbing facilities: 3.3% Housing units lacking complete kitchen facilities: 2.0%
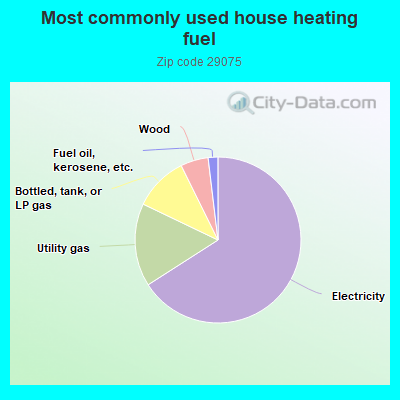
66.0%Electricity
16.2%Utility gas
10.6%Bottled, tank, or LP gas
5.4%Wood
1.9%Fuel oil, kerosene, etc.
Population in 1990: 3,322.
Place of birth for U.S.-born residents:
This state: 2,442
Northeast: 33
Midwest: 160
South: 364
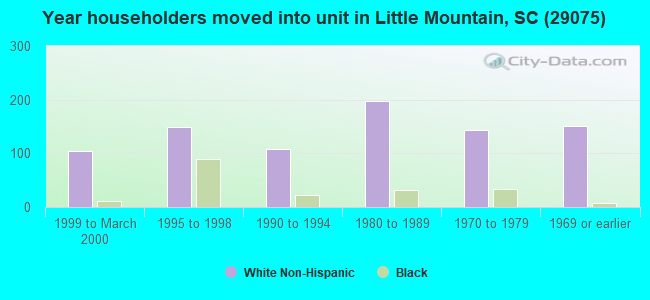
69% of the 29075 zip code residents lived in the same house 5 years ago. Out of people who lived in different houses, 40% lived in this county. Out of people who lived in different counties, 50% lived in South Carolina.
93% of the 29075 zip code residents lived in the same house 1 year ago. Out of people who lived in different houses, 72% moved from this county. Out of people who lived in different houses, 8% moved from different county within same state. Out of people who lived in different houses, 9% moved from abroad.
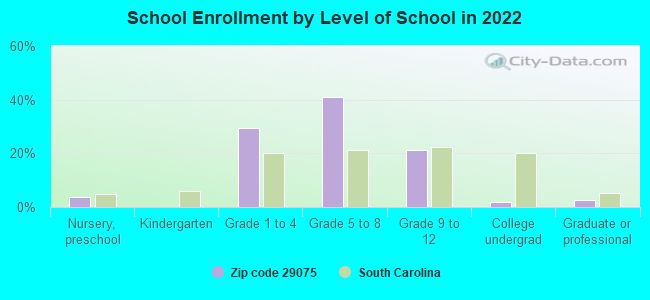
Private vs. public school enrollment:
Students in private schools in grades 1 to 8 (elementary and middle school):
Here:
0.0%
South Carolina:
14.4%
Students in private schools in grades 9 to 12 (high school): 7
Here:
8.9%
South Carolina:
11.1%
Students in private undergraduate colleges:
Here:
0.0%
South Carolina:
21.9%
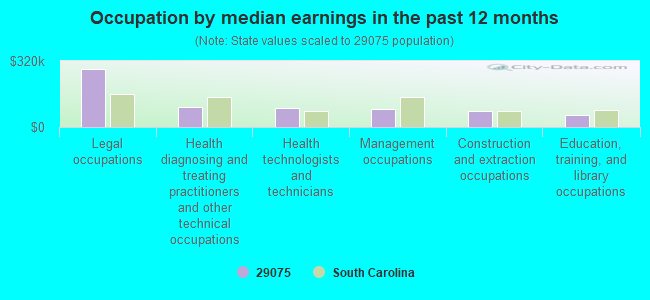
Occupation by median earnings in the past 12 months ($)
282,444Legal occupations
98,414Health diagnosing and treating practitioners and other technical occupations
90,350Health technologists and technicians
88,573Management occupations
76,912Construction and extraction occupations
57,291Education, training, and library occupations
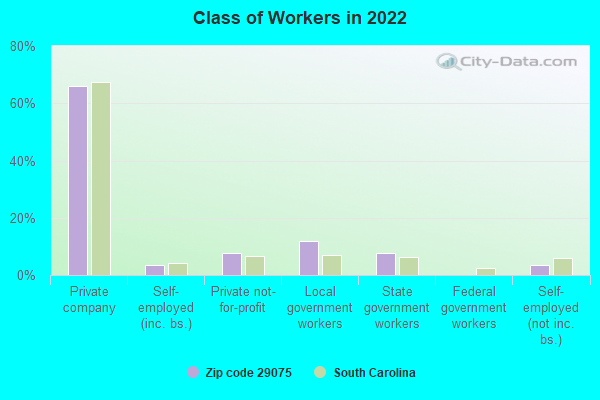
Top industries in this zip code by the number of employees in 2005:
Construction: Water and Sewer Line and Related Structures Construction (20-49 employees: 1 establishment, 10-19 employees: 2 establishments)
Administrative and Support and Waste Management and Remediation Services: Landscaping Services (10-19: 1, 1-4: 1)
Management of Companies and Enterprises: Corporate, Subsidiary, and Regional Managing Offices (10-19: 1)
Health Care and Social Assistance: Child Day Care Services (10-19: 1)
Construction: Site Preparation Contractors (5-9: 1, 1-4: 1)
Construction: Electrical Contractors (5-9: 1)
People in group quarters in 2010:
9 people in group homes for juveniles (non-correctional)
Fatal accident statistics in 2013:
Fatal accident count: 1
Vehicles involved in fatal accidents: 2
Fatal accidents caused by drunken drivers: 1
Fatalities: 1
Persons involved in fatal accidents: 4
Pedestrians involved in fatal accidents: 0
Fatal accident statistics in 2011:
Fatal accident count: 1
Vehicles involved in fatal accidents: 1
Fatal accidents caused by drunken drivers: 0
Fatalities: 1
Persons involved in fatal accidents: 1
Pedestrians involved in fatal accidents: 0
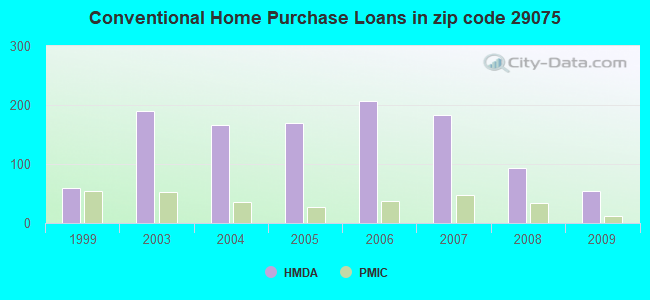
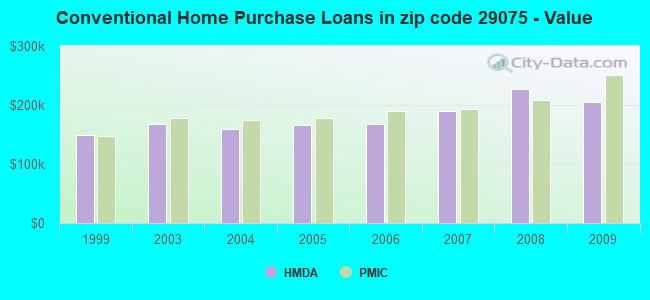
Home Mortgage Disclosure Act Aggregated Statistics For Year 2009 (Based on 4 partial tracts)
A) FHA, FSA/RHS & VA Home Purchase Loans
B) Conventional Home Purchase Loans
C) Refinancings
D) Home Improvement Loans
F) Non-occupant Loans on < 5 Family Dwellings (A B C & D)
G) Loans On Manufactured Home Dwelling (A B C & D)
Number
Average Value
Number
Average Value
Number
Average Value
Number
Average Value
Number
Average Value
Number
Average Value
LOANS ORIGINATED
46
$181,998
54
$205,808
280
$206,024
7
$135,824
12
$240,006
2
$85,390
APPLICATIONS APPROVED, NOT ACCEPTED
2
$231,685
3
$216,030
21
$211,553
3
$48,937
1
$195,500
0
$0
APPLICATIONS DENIED
6
$149,545
7
$221,433
61
$206,803
3
$137,003
4
$214,538
1
$116,460
APPLICATIONS WITHDRAWN
4
$196,188
8
$213,538
41
$211,720
2
$154,115
1
$152,280
1
$40,500
FILES CLOSED FOR INCOMPLETENESS
1
$228,080
4
$251,208
14
$236,758
0
$0
2
$171,715
0
$0
Aggregated Statistics For Year 2008 (Based on 4 partial tracts)
A) FHA, FSA/RHS & VA Home Purchase Loans
B) Conventional Home Purchase Loans
C) Refinancings
D) Home Improvement Loans
F) Non-occupant Loans on < 5 Family Dwellings (A B C & D)
G) Loans On Manufactured Home Dwelling (A B C & D)
Number
Average Value
Number
Average Value
Number
Average Value
Number
Average Value
Number
Average Value
Number
Average Value
LOANS ORIGINATED
33
$176,299
93
$227,228
147
$198,446
10
$81,914
17
$227,513
1
$69,430
APPLICATIONS APPROVED, NOT ACCEPTED
2
$116,985
6
$235,320
17
$195,529
1
$47,220
1
$117,300
1
$60,750
APPLICATIONS DENIED
6
$166,400
12
$181,698
69
$207,595
9
$94,388
6
$182,263
4
$77,648
APPLICATIONS WITHDRAWN
4
$190,660
7
$234,856
38
$187,845
1
$153,290
3
$149,890
0
$0
FILES CLOSED FOR INCOMPLETENESS
1
$183,240
3
$285,930
12
$204,022
0
$0
0
$0
0
$0
Aggregated Statistics For Year 2007 (Based on 4 partial tracts)
A) FHA, FSA/RHS & VA Home Purchase Loans
B) Conventional Home Purchase Loans
C) Refinancings
D) Home Improvement Loans
F) Non-occupant Loans on < 5 Family Dwellings (A B C & D)
G) Loans On Manufactured Home Dwelling (A B C & D)
Number
Average Value
Number
Average Value
Number
Average Value
Number
Average Value
Number
Average Value
Number
Average Value
LOANS ORIGINATED
13
$164,651
183
$190,245
134
$176,508
13
$84,944
24
$168,024
3
$60,917
APPLICATIONS APPROVED, NOT ACCEPTED
1
$108,800
20
$151,214
26
$189,908
6
$95,083
3
$110,647
2
$63,325
APPLICATIONS DENIED
2
$88,290
20
$179,206
74
$176,878
21
$124,630
3
$210,227
3
$64,483
APPLICATIONS WITHDRAWN
1
$186,670
18
$188,912
43
$168,074
2
$150,825
3
$136,147
0
$0
FILES CLOSED FOR INCOMPLETENESS
0
$0
8
$193,379
9
$174,829
0
$0
1
$73,400
0
$0
Aggregated Statistics For Year 2006 (Based on 4 partial tracts)
A) FHA, FSA/RHS & VA Home Purchase Loans
B) Conventional Home Purchase Loans
C) Refinancings
D) Home Improvement Loans
F) Non-occupant Loans on < 5 Family Dwellings (A B C & D)
G) Loans On Manufactured Home Dwelling (A B C & D)
Number
Average Value
Number
Average Value
Number
Average Value
Number
Average Value
Number
Average Value
Number
Average Value
LOANS ORIGINATED
14
$170,214
207
$168,339
123
$176,009
19
$73,186
23
$179,656
3
$70,353
APPLICATIONS APPROVED, NOT ACCEPTED
2
$131,750
24
$134,599
26
$139,855
4
$59,505
7
$123,047
1
$140,910
APPLICATIONS DENIED
2
$279,060
29
$164,409
78
$167,387
18
$72,128
6
$172,970
3
$49,387
APPLICATIONS WITHDRAWN
1
$99,620
21
$156,051
55
$184,702
3
$142,877
4
$192,438
1
$68,800
FILES CLOSED FOR INCOMPLETENESS
0
$0
7
$127,871
17
$225,444
0
$0
2
$148,945
0
$0
Aggregated Statistics For Year 2005 (Based on 4 partial tracts)
A) FHA, FSA/RHS & VA Home Purchase Loans
B) Conventional Home Purchase Loans
C) Refinancings
D) Home Improvement Loans
F) Non-occupant Loans on < 5 Family Dwellings (A B C & D)
G) Loans On Manufactured Home Dwelling (A B C & D)
Number
Average Value
Number
Average Value
Number
Average Value
Number
Average Value
Number
Average Value
Number
Average Value
LOANS ORIGINATED
8
$186,872
170
$165,743
139
$153,861
10
$103,957
22
$136,882
5
$95,172
APPLICATIONS APPROVED, NOT ACCEPTED
0
$0
8
$184,892
25
$154,447
6
$67,650
2
$169,470
1
$68,160
APPLICATIONS DENIED
1
$114,040
26
$168,619
78
$159,127
10
$62,971
6
$164,210
5
$56,390
APPLICATIONS WITHDRAWN
2
$109,030
22
$187,761
35
$170,861
7
$209,453
4
$135,222
2
$68,410
FILES CLOSED FOR INCOMPLETENESS
1
$87,170
5
$172,000
27
$175,152
2
$46,565
0
$0
1
$35,510
Aggregated Statistics For Year 2004 (Based on 4 partial tracts)
A) FHA, FSA/RHS & VA Home Purchase Loans
B) Conventional Home Purchase Loans
C) Refinancings
D) Home Improvement Loans
F) Non-occupant Loans on < 5 Family Dwellings (A B C & D)
G) Loans On Manufactured Home Dwelling (A B C & D)
Number
Average Value
Number
Average Value
Number
Average Value
Number
Average Value
Number
Average Value
Number
Average Value
LOANS ORIGINATED
13
$136,947
166
$159,900
149
$161,431
14
$61,742
17
$121,716
11
$79,405
APPLICATIONS APPROVED, NOT ACCEPTED
0
$0
10
$175,725
16
$136,256
2
$6,035
1
$67,480
1
$102,950
APPLICATIONS DENIED
2
$97,745
22
$144,990
63
$148,135
10
$25,372
3
$81,507
8
$69,785
APPLICATIONS WITHDRAWN
1
$158,610
10
$146,989
38
$167,659
4
$71,818
2
$138,885
1
$62,070
FILES CLOSED FOR INCOMPLETENESS
0
$0
3
$173,680
18
$187,010
0
$0
0
$0
1
$104,810
Aggregated Statistics For Year 2003 (Based on 4 partial tracts)
A) FHA, FSA/RHS & VA Home Purchase Loans
B) Conventional Home Purchase Loans
C) Refinancings
D) Home Improvement Loans
F) Non-occupant Loans on < 5 Family Dwellings (A B C & D)
Number
Average Value
Number
Average Value
Number
Average Value
Number
Average Value
Number
Average Value
LOANS ORIGINATED
37
$136,942
190
$167,172
454
$159,249
12
$33,032
16
$153,687
APPLICATIONS APPROVED, NOT ACCEPTED
0
$0
6
$135,085
33
$160,005
2
$12,980
0
$0
APPLICATIONS DENIED
2
$117,315
14
$149,429
86
$164,168
4
$60,365
3
$166,817
APPLICATIONS WITHDRAWN
4
$135,390
21
$171,191
60
$152,674
1
$28,770
2
$235,750
FILES CLOSED FOR INCOMPLETENESS
3
$130,207
3
$129,113
12
$141,682
1
$62,260
0
$0
Aggregated Statistics For Year 1999 (Based on 1 partial tract)
A) FHA, FSA/RHS & VA Home Purchase Loans
B) Conventional Home Purchase Loans
C) Refinancings
D) Home Improvement Loans
F) Non-occupant Loans on < 5 Family Dwellings (A B C & D)
Detailed PMIC statistics for the following Tracts:0103.07
, 0212.02
2004 - 2018 National Fire Incident Reporting System (NFIRS) incidents
Based on the data from the years 2004 - 2018 the average number of fires per year is 8. The highest number of fires - 32 took place in 2018, and the least - 2 in 2009. The data has an increasing trend.
When looking into fire subcategories, the most incidents belonged to: Outside Fires (45.1%), and Structure Fires (30.3%).
Fire incident types reported to NFIRS in Zip Code 29075


 Nearest zip codes: 29122, 29065, 29036, 29063, 29126, 29212.


 Based on the data from the years 2004 - 2018 the average number of fires per year is 8. The highest number of fires - 32 took place in 2018, and the least - 2 in 2009. The data has an increasing trend.
 When looking into fire subcategories, the most incidents belonged to: Outside Fires (45.1%), and Structure Fires (30.3%).