Estimated zip code population in 2022: 2,263 Zip code population in 2010: 2,271 Zip code population in 2000: 1,971
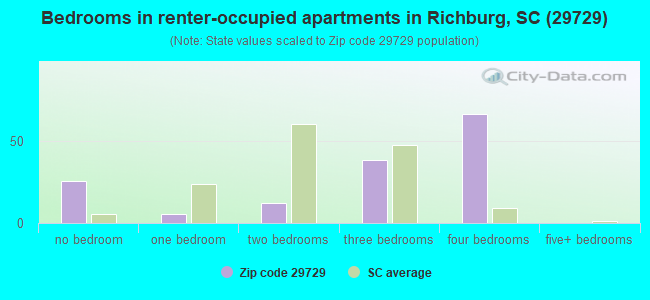
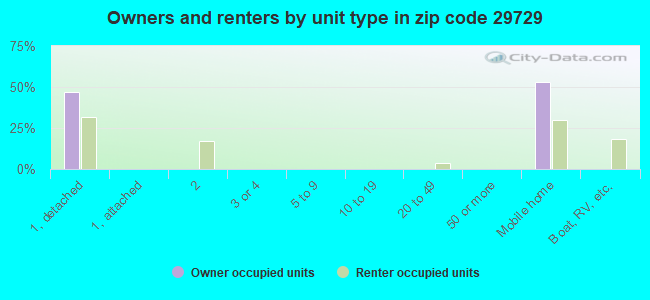
Houses and condos: 1,090 Renter-occupied apartments: 150
% of renters here:
16%
State:
28%
March 2022 cost of living index in zip code 29729: 80.4 (low, U.S. average is 100)
Land area: 67.1 sq. mi. Water area: 0.1 sq. mi.
Population density: 34 people per square mile
(very low).
OSM Map
General Map
Google Map
MSN Map
OSM Map
General Map
Google Map
MSN Map
OSM Map
General Map
Google Map
MSN Map
OSM Map
General Map
Google Map
MSN Map
Please wait while loading the map...
Real estate property taxes paid for housing units in 2022:
This zip code:
0.7% ($822)
South Carolina:
0.5% ($1,185)
Median real estate property taxes paid for housing units with mortgages in 2022: $924 (0.4%) Median real estate property taxes paid for housing units with no mortgage in 2022: $787 (0.9%)
Business Search- 14 Million verified businesses
Males: 1,184
(52.3%)
Females: 1,078
(47.7%)
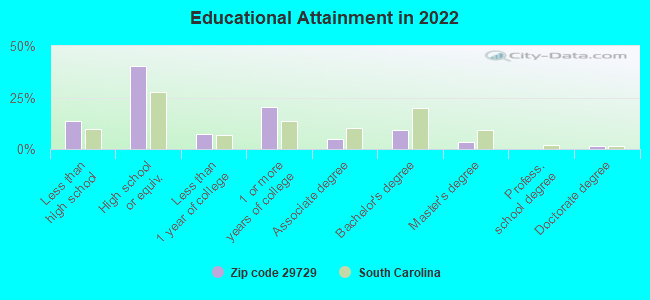
For population 25 years and over in 29729:
High school or higher: 84.7%
Bachelor's degree or higher: 13.4%
Graduate or professional degree: 4.5%
Unemployed: 3.0%
Mean travel time to work (commute): 26.8 minutes
For population 15 years and over in 29729:
Never married: 25.8%
Now married: 54.3%
Separated: 1.1%
Widowed: 6.3%
Divorced: 12.5%
Zip code 29729 compared to state average:
Median house value significantly below state average.
Foreign-born population percentage significantly below state average.
Renting percentage below state average.
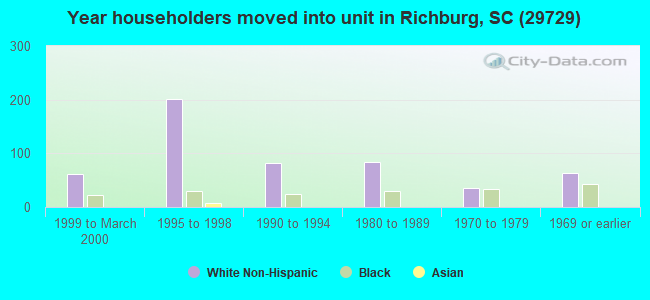
Length of stay since moving in significantly above state average.
Percentage of population with a bachelor's degree or higher significantly below state average.
Estimated median house/condo value in 2022: $111,873
29729:
$111,873
South Carolina:
$254,600
Median resident age:
This zip code:
39.8 years
South Carolina median age:
40.5 years
Average household size:
This zip code:
2.5 people
South Carolina:
2.4 people
Averages for the 2020 tax year for zip code 29729, filed in 2021:
Average Adjusted Gross Income (AGI) in 2020: $50,657 (Individual Income Tax Returns)
Here:
$50,657
State:
$65,754
Salary/wage: $44,557 (reported on 87.4% of returns)
Here:
$44,557
State:
$52,566
(% of AGI for various income ranges: 1342.6% for AGIs below $25k, 4101.7% for AGIs $25k-50k, 8204.0% for AGIs $50k-75k, 10322.9% for AGIs $75k-100k, 16401.7% for AGIs $100k-200k)
Taxable interest for individuals: $538 (reported on 18.9% of returns)
This zip code:
$538
South Carolina:
$1,749
(% of AGI for various income ranges: 6.8% for AGIs below $25k, 10.4% for AGIs $25k-50k, 30.0% for AGIs $50k-75k, 5.7% for AGIs $75k-100k, 56.7% for AGIs $100k-200k)
Ordinary dividends: $1,689 (reported on 8.1% of returns)
Here:
$1,689
State:
$8,783
(% of AGI for various income ranges: 22.6% for AGIs $25k-50k, 38.6% for AGIs $75k-100k, 121.7% for AGIs $100k-200k)
Net capital gain/loss in AGI: +$8,543 (reported on 6.3% of returns)
Here:
+$8,543
State:
+$24,194
(% of AGI for various income ranges: 100.0% for AGIs $50k-75k, 838.3% for AGIs $100k-200k)
Profit/loss from business: +$1,567 (reported on 13.5% of returns)
Here:
+$1,567
State:
+$11,253
(% of AGI for various income ranges: 27.1% for AGIs below $25k, 6.1% for AGIs $25k-50k, 35.0% for AGIs $50k-75k, 145.7% for AGIs $75k-100k)
Taxable individual retirement arrangement distribution: $14,743 (reported on 6.3% of returns)
29729:
$14,743
South Carolina:
$21,604
(% of AGI for various income ranges: 151.7% for AGIs $25k-50k, 975.7% for AGIs $75k-100k)
Total itemized deductions: $25,533 (reported on 5.4% of returns)
Here:
$25,533
State:
$35,199
(% of AGI for various income ranges: 827.0% for AGIs $50k-75k, 1175.0% for AGIs $100k-200k)
Charity contributions: $7,680 (reported on 4.5% of returns)
Here:
$7,680
State:
$14,319
(% of AGI for various income ranges: 73.0% for AGIs $25k-50k, 360.0% for AGIs $100k-200k)
Taxes paid: $7,520 (reported on 4.5% of returns)
29729:
$7,520
State:
$7,486
(% of AGI for various income ranges: 151.0% for AGIs $50k-75k, 375.0% for AGIs $100k-200k)
Earned income credit: $2,488 (reported on 22.5% of returns)
Here:
$2,488
State:
$2,397
(% of AGI for various income ranges: 138.4% for AGIs below $25k, 83.9% for AGIs $25k-50k)
Percentage of individuals using paid preparers for their 2020 taxes: 91.0%
Here:
91%
State:
93%
(% for various income ranges: 90.2% for AGIs below $25k, 90.3% for AGIs $25k-50k, 87.5% for AGIs $50k-75k, 90.9% for AGIs $75k-100k, 100.0% for AGIs $100k-200k, 100.0% for AGIs over 200k)
Averages for the 2012 tax year for zip code 29729, filed in 2013:
Average Adjusted Gross Income (AGI) in 2012: $39,981 (Individual Income Tax Returns)
Here:
$39,981
State:
$51,133
Salary/wage: $36,632 (reported on 89.8% of returns)
Here:
$36,632
State:
$42,173
(% of AGI for various income ranges: 79.5% for AGIs below $25k, 83.7% for AGIs $25k-50k, 84.0% for AGIs $50k-75k, 83.9% for AGIs $75k-100k, 79.9% for AGIs $100k-200k)
Taxable interest for individuals: $625 (reported on 20.4% of returns)
This zip code:
$625
South Carolina:
$1,468
(% of AGI for various income ranges: 0.5% for AGIs below $25k, 0.4% for AGIs $25k-50k, 0.5% for AGIs $50k-75k, 0.1% for AGIs $75k-100k, 0.1% for AGIs $100k-200k)
Ordinary dividends: $1,089 (reported on 9.2% of returns)
Here:
$1,089
State:
$6,511
(% of AGI for various income ranges: 0.6% for AGIs $25k-50k, 0.2% for AGIs $50k-75k, 0.2% for AGIs $100k-200k)
Net capital gain/loss in AGI: +$2,800 (reported on 4.1% of returns)
Here:
+$2,800
State:
+$13,061
Profit/loss from business: +$5,092 (reported on 12.2% of returns)
Here:
+$5,092
State:
+$10,167
(% of AGI for various income ranges: 5.6% for AGIs below $25k, 1.1% for AGIs $25k-50k, 0.7% for AGIs $50k-75k, 2.7% for AGIs $75k-100k)
Taxable individual retirement arrangement distribution: $11,633 (reported on 6.1% of returns)
29729:
$11,633
South Carolina:
$17,019
Total itemized deductions: $19,032 (26% of AGI, reported on 25.5% of returns)
Here:
$19,032
State:
$22,890
Here:
25.6% of AGI
State:
21.4% of AGI
(% of AGI for various income ranges: 6.0% for AGIs below $25k, 8.6% for AGIs $25k-50k, 13.7% for AGIs $50k-75k, 16.1% for AGIs $75k-100k, 15.5% for AGIs $100k-200k)
Charity contributions: $4,448 (reported on 21.4% of returns)
Here:
$4,448
State:
$5,169
(% of AGI for various income ranges: 1.9% for AGIs $25k-50k, 2.7% for AGIs $50k-75k, 3.0% for AGIs $75k-100k, 3.5% for AGIs $100k-200k)
Taxes paid: $5,544 (reported on 25.5% of returns)
29729:
$5,544
State:
$7,644
(% of AGI for various income ranges: 0.8% for AGIs below $25k, 1.5% for AGIs $25k-50k, 3.3% for AGIs $50k-75k, 5.0% for AGIs $75k-100k, 6.4% for AGIs $100k-200k)
Earned income credit: $2,179 (reported on 28.6% of returns)
Here:
$2,179
State:
$2,418
(% of AGI for various income ranges: 9.1% for AGIs below $25k, 1.5% for AGIs $25k-50k)
Percentage of individuals using paid preparers for their 2012 taxes: 61.2%
Here:
61%
State:
57%
(% for various income ranges: 57.1% for AGIs below $25k, 62.1% for AGIs $25k-50k, 69.2% for AGIs $50k-75k, 57.1% for AGIs $75k-100k, 71.4% for AGIs $100k-200k)
Averages for the 2004 tax year for zip code 29729, filed in 2005:
Average Adjusted Gross Income (AGI) in 2004: $34,125 (Individual Income Tax Returns)
Here:
$34,125
State:
$41,965
Salary/wage: $32,832 (reported on 90.7% of returns)
Here:
$32,832
State:
$35,695
(% of AGI for various income ranges: 80.6% for AGIs below $10k, 83.6% for AGIs $10k-25k, 89.4% for AGIs $25k-50k, 87.0% for AGIs $50k-75k, 90.2% for AGIs $75k-100k, 84.4% for AGIs over 100k)
Taxable interest for individuals: $435 (reported on 31.0% of returns)
This zip code:
$435
South Carolina:
$1,623
(% of AGI for various income ranges: 2.0% for AGIs below $10k, 0.7% for AGIs $10k-25k, 0.2% for AGIs $25k-50k, 0.4% for AGIs $50k-75k, 0.2% for AGIs $75k-100k, 0.3% for AGIs over 100k)
Taxable dividends: $684 (reported on 9.8% of returns)
Here:
$684
State:
$3,999
(% of AGI for various income ranges: 0.7% for AGIs $10k-25k, 0.1% for AGIs $25k-50k, 0.1% for AGIs $50k-75k, 0.1% for AGIs $75k-100k, 0.3% for AGIs over 100k)
Net capital gain/loss: +$557 (reported on 6.3% of returns)
Here:
+$557
State:
+$13,100
(% of AGI for various income ranges: -0.3% for AGIs $10k-25k, -0.1% for AGIs $25k-50k, 0.7% for AGIs $50k-75k, 0.2% for AGIs over 100k)
Profit/loss from business: +$6,117 (reported on 11.5% of returns)
Here:
+$6,117
State:
+$9,144
(% of AGI for various income ranges: 9.1% for AGIs below $10k, 4.5% for AGIs $10k-25k, 0.8% for AGIs $25k-50k, 3.2% for AGIs $50k-75k, 1.0% for AGIs $75k-100k)
IRA payment deduction: $2,400 (reported on 1.6% of returns)
29729:
$2,400
South Carolina:
$2,972
Total itemized deductions: $16,535 (27% of AGI, reported on 29.8% of returns)
Here:
$16,535
State:
$19,039
Here:
27.3% of AGI
State:
22.8% of AGI
(% of AGI for various income ranges: 9.2% for AGIs $10k-25k, 10.7% for AGIs $25k-50k, 17.5% for AGIs $50k-75k, 20.0% for AGIs $75k-100k, 20.0% for AGIs over 100k)
Charity contributions deductions: $3,490 (6% of AGI, reported on 25.4% of returns)
Here:
$3,490
State:
$4,305
Here:
5.5% of AGI
State:
5.0% of AGI
(% of AGI for various income ranges: 1.1% for AGIs $10k-25k, 1.7% for AGIs $25k-50k, 3.3% for AGIs $50k-75k, 3.4% for AGIs $75k-100k, 4.8% for AGIs over 100k)
Total tax: $3,618 (reported on 68.8% of returns)
29729:
$3,618
State:
$6,497
(% of AGI for various income ranges: 2.1% for AGIs below $10k, 3.0% for AGIs $10k-25k, 6.0% for AGIs $25k-50k, 8.4% for AGIs $50k-75k, 8.1% for AGIs $75k-100k, 13.5% for AGIs over 100k)
Earned income credit: $1,691 (reported on 26.5% of returns)
Here:
$1,691
State:
$1,882
Percentage of individuals using paid preparers for their 2004 taxes: 68.6%
Here:
69%
State:
66%
(% for various income ranges: 55.0% for AGIs below $10k, 70.3% for AGIs $10k-25k, 72.4% for AGIs $25k-50k, 70.7% for AGIs $50k-75k, 77.0% for AGIs $75k-100k, 76.5% for AGIs over 100k)
Household received Food Stamps/SNAP in the past 12 months: 302 Household did not receive Food Stamps/SNAP in the past 12 months: 615
Women who had a birth in the past 12 months: 46 (11 now married, 32 unmarried) Women who did not have a birth in the past 12 months: 565 (282 now married, 284 unmarried)
Housing units in zip code 29729 with a mortgage: 235 (38 second mortgage, 39 both second mortgage and home equity loan) Median monthly owner costs for units with a mortgage: $1,333 Median monthly owner costs for units without a mortgage: $392
Residents with income below the poverty level in 2022:
This zip code:
19.0%
Whole state:
14.0%
Residents with income below 50% of the poverty level in 2022:
This zip code:
14.2%
Whole state:
7.3%
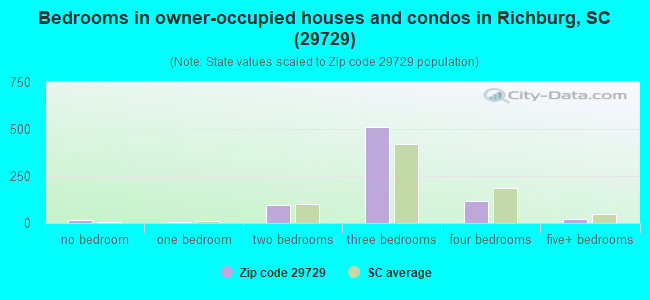
Median number of rooms in houses and condos:
Here:
6.4
State:
6.4
Median number of rooms in apartments:
Here:
6.4
State:
4.5
Notable locations in this zip code not listed on our city pages
Notable locations in zip code 29729: Rossville Fire Department Station 2 (A), Richburg Fire Department (B), Rossvillle Community Center (C), Rossville Fire Department (D). Display/hide their locations on the map
Churches in zip code 29729 include: Ararat Church (A), Mount Prospect Church (B), Mount Pleasant Church (C), Mount Nebo Church (D), Ebenezer Church (E), Cedar Shoals Church (F), Love-Charity Church (G), Gold Mine Church (H), Pleasant Grove Church (I). Display/hide their locations on the map
Cemeteries: Anderson Cemetery (1), Ararat Cemetery (2), Gold Mine Cemetery (3), Hopewell Cemetery (4), Blakles, Caldwells, and Strouds Cemetery (5), Browns-Strouds Cemetery (6), William Martin Cemetery (7). Display/hide their locations on the map
Streams, rivers, and creeks: South Fork Fishing Creek (A), Bull Skin Creek (B), Hicklin Branch (C), McDaniel Branch (D). Display/hide their locations on the map
Size of family households: 422 2-persons, 141 3-persons, 45 4-persons, 84 5-persons, 19 6-persons, 9 7-or-more-persons
Size of nonfamily households: 141 1-person, 51 2-persons
180 married couples with children.
66 single-parent households (66 women).
98.6% of residents of 29729 zip code speak English at home.
0.9% of residents speak Spanish at home (100% very well).
0.2% of residents speak Asian or Pacific Island language at home (100% very well).
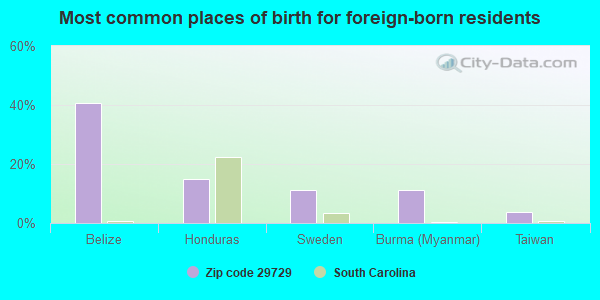
Foreign born population: 26 (1.2%) (40.6% of them are naturalized citizens)
This zip code:
1.2%
Whole state:
5.2%
41%Belize
15%Honduras
11%Sweden
11%Burma (Myanmar)
4%Taiwan
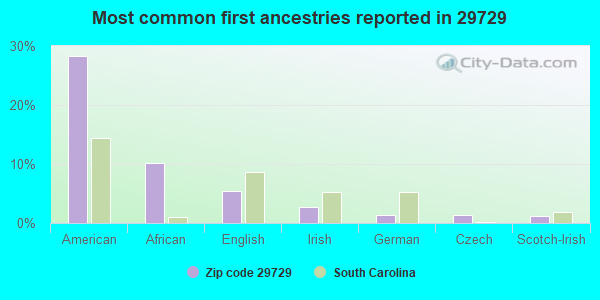
28%American
10%African
5%English
3%Irish
1%German
1%Czech
1%Scotch-Irish
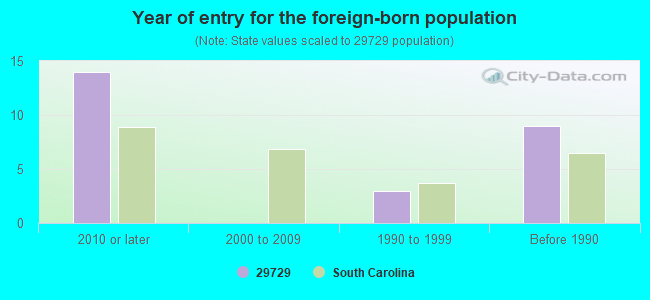
Year of entry for the foreign-born population
142010 or later
02000 to 2009
31990 to 1999
9Before 1990
Facilities with environmental interests located in this zip code:
AVESTAPOLARIT INCORPORATED BAR PRODUCTS (3043 CRENSHAW PARKWAY in RICHBURG, SC)
AIR MINOR (AIRS/AFS) Small Quantity Generators, between 100 kg and 1000 kg of hazardous waste/month (Resource Conservation and Recovery Act (tracking hazardous waste)) STATE MASTER (South Carolina database) - AIR PROGRAM STATE MASTER (South Carolina database) - X-RAY EQUIPMENT, HAZARDOUS WASTE PROGRAM TRI REPORTER (Tracking of toxic chemicals releasing facilities) Business SIC classification: COLD-ROLLED STEEL SHEET, STRIP, AND BARS; METALS SERVICE CENTERS AND OFFICES; SERVICES Organizations: AVESTAPOLARIT BAR CO (CONTACT/OPERATOR)
, OUTOKUMPU STAINLESS BAR INC (CONTACT/OPERATOR)
, OUTOKUMPU STAINLESS INC NAD (CONTACT/OWNER)
Alternative names: AVESTA SHEFFIELD BAR COMPANY, AVESTA SHEFIELD BAR CO, AVESTAPOLARIT BAR CO, OUTOKUMPU STAINLESS BAR INC
CIRCLE S RANCH (4937 MORRISON RD in RICHBURG, SC)
AIR MINOR (AIRS/AFS) National Pollutant Discharge Elimination System NON-MAJOR (Tracking pollutant discharge elimination systems) - permit National Pollutant Discharge Elimination System NON-MAJOR (Tracking pollutant discharge elimination systems) - permit STATE MASTER (South Carolina database) - AIR PROGRAM Business SIC classification: PREPARED FEEDS AND FEED INGREDIENTS FOR ANIMALS AND FOWLS, EXCEPT DOGS AND CATS Organizations: CIRCLE S RANCH FEEDMILL (CONTACT/OWNER)
DIVERSIFIED RECYCLING INC (1555 MOUNTAIN GAP RD in RICHBURG, SC)
(Resource Conservation and Recovery Act (tracking hazardous waste)) STATE MASTER (South Carolina database) - HAZARDOUS WASTE PROGRAM, OIL CONTROL Organizations: DONALD BURNETTE (CONTACT/OWNER)
Housing units lacking complete plumbing facilities: 6.5% Housing units lacking complete kitchen facilities: 6.2%
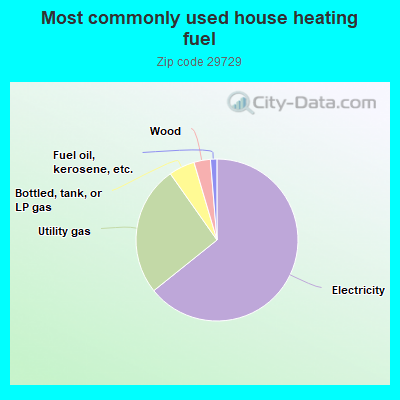
64.5%Electricity
26.1%Utility gas
5.2%Bottled, tank, or LP gas
3.3%Wood
1.3%Fuel oil, kerosene, etc.
Population in 1990: 2,393.
Place of birth for U.S.-born residents:
This state: 1,630
Northeast: 89
Midwest: 40
South: 386
West: 61
59% of the 29729 zip code residents lived in the same house 5 years ago. Out of people who lived in different houses, 49% lived in this county. Out of people who lived in different counties, 50% lived in South Carolina.
94% of the 29729 zip code residents lived in the same house 1 year ago. Out of people who lived in different houses, 20% moved from this county. Out of people who lived in different houses, 79% moved from different county within same state.
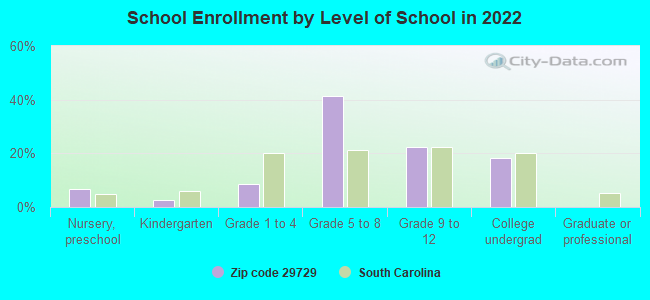
Private vs. public school enrollment:
Students in private schools in grades 1 to 8 (elementary and middle school): 10
Here:
5.6%
South Carolina:
14.4%
Students in private schools in grades 9 to 12 (high school): 13
Here:
14.9%
South Carolina:
11.1%
Students in private undergraduate colleges: 38
Here:
54.1%
South Carolina:
21.9%
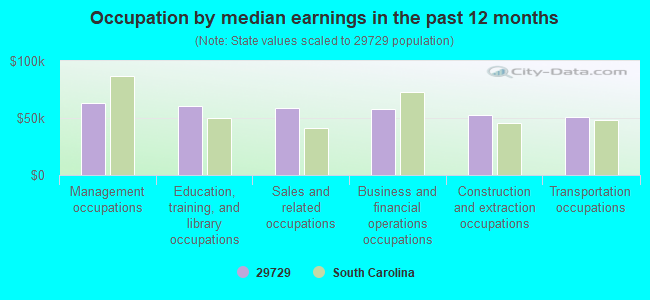
Occupation by median earnings in the past 12 months ($)
63,267Management occupations
60,816Education, training, and library occupations
58,703Sales and related occupations
58,260Business and financial operations occupations
52,476Construction and extraction occupations
50,527Transportation occupations
Companies with federal contracts located in this zip code:
CHESTER COUNTY DEPARTMENT OF E (3971 LEWISVILLE HIGH SCHOO in RICHBURG, SC)
$3,200 with Army for Other Professional Services. Signed on 2002-02-22. Completion date: 2002-05-05.
Top industries in this zip code by the number of employees in 2005:
Wholesale Trade: Home Furnishing Merchant Wholesalers (250-499 employees: 1 establishment)
Wholesale Trade: Metal Service Centers and Other Metal Merchant Wholesalers (100-249: 1, 5-9: 1)
Accommodation and Food Services: Limited-Service Restaurants (20-49: 3)
Accommodation and Food Services: Hotels (except Casino Hotels) and Motels (10-19: 2, 5-9: 1)
Accommodation and Food Services: Full-Service Restaurants (10-19: 2, 5-9: 1)
Fatal accident statistics in 2013:
Fatal accident count: 2
Vehicles involved in fatal accidents: 3
Fatal accidents caused by drunken drivers: 1
Fatalities: 4
Persons involved in fatal accidents: 6
Pedestrians involved in fatal accidents: 1
Fatal accident statistics in 2012:
Fatal accident count: 2
Vehicles involved in fatal accidents: 3
Fatal accidents caused by drunken drivers: 0
Fatalities: 2
Persons involved in fatal accidents: 3
Pedestrians involved in fatal accidents: 1
2002 - 2018 National Fire Incident Reporting System (NFIRS) incidents
According to the data from the years 2002 - 2018 the average number of fires per year is 40. The highest number of reported fire incidents - 71 took place in 2016, and the least - 0 in 2003. The data has an increasing trend.
When looking into fire subcategories, the most incidents belonged to: Outside Fires (44.4%), and Structure Fires (29.6%).
Fire incident types reported to NFIRS in Zip Code 29729

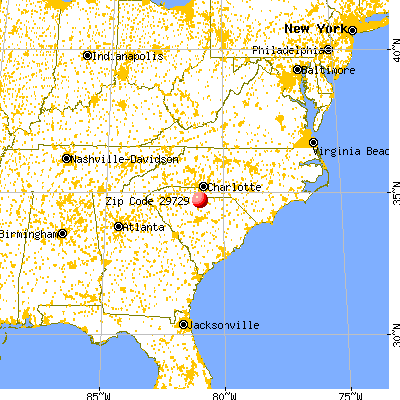


 Nearest zip codes: 29724, 29714, 29712, 29055, 29704, 29014.


 According to the data from the years 2002 - 2018 the average number of fires per year is 40. The highest number of reported fire incidents - 71 took place in 2016, and the least - 0 in 2003. The data has an increasing trend.
 When looking into fire subcategories, the most incidents belonged to: Outside Fires (44.4%), and Structure Fires (29.6%).