Estimated zip code population in 2022: 4,809 Zip code population in 2010: 5,237 Zip code population in 2000: 3,929
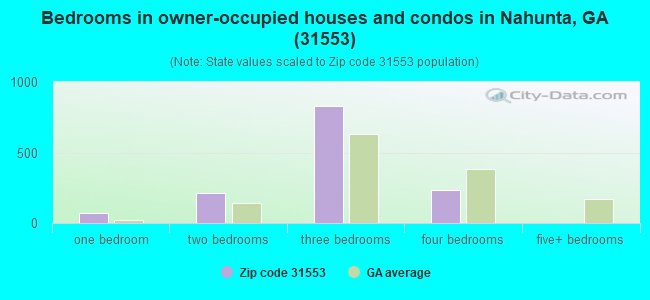
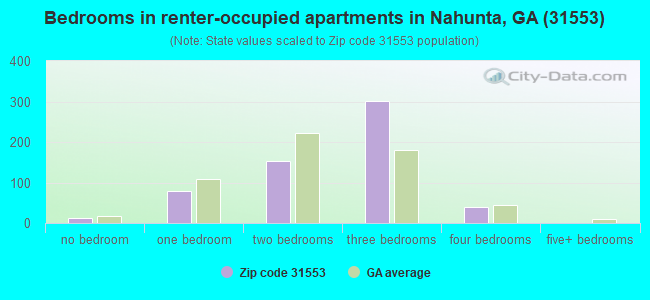
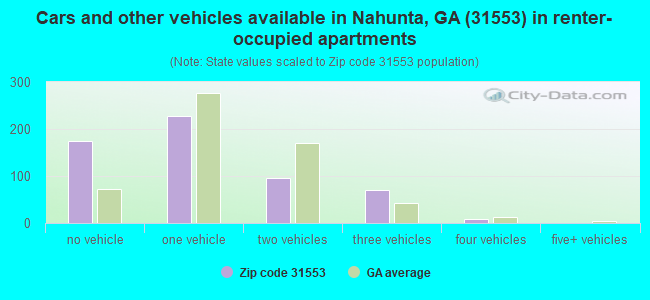
Houses and condos: 2,222 Renter-occupied apartments: 582
% of renters here:
30%
State:
34%
March 2022 cost of living index in zip code 31553: 79.8 (low, U.S. average is 100)
Land area: 171.2 sq. mi. Water area: 1.7 sq. mi.
Population density: 28 people per square mile
(very low).
OSM Map
General Map
Google Map
MSN Map
OSM Map
General Map
Google Map
MSN Map
OSM Map
General Map
Google Map
MSN Map
OSM Map
General Map
Google Map
MSN Map
Please wait while loading the map...
Real estate property taxes paid for housing units in 2022:
This zip code:
1.2% ($1,451)
Georgia:
0.7% ($2,160)
Median real estate property taxes paid for housing units with mortgages in 2022: $1,706 (0.9%) Median real estate property taxes paid for housing units with no mortgage in 2022: $1,326 (1.6%)
Business Search- 14 Million verified businesses
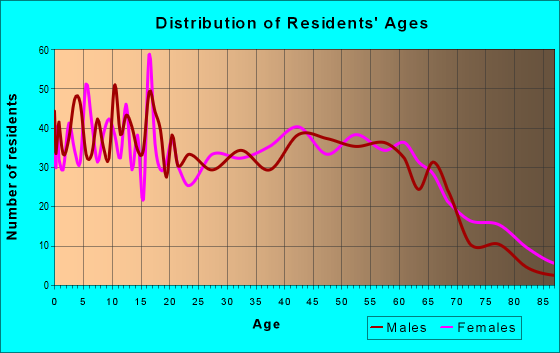
Males: 2,417
(50.3%)
Females: 2,392
(49.7%)
For population 25 years and over in 31553:
High school or higher: 83.6%
Bachelor's degree or higher: 13.8%
Graduate or professional degree: 8.0%
Unemployed: 3.9%
Mean travel time to work (commute): 35.7 minutes
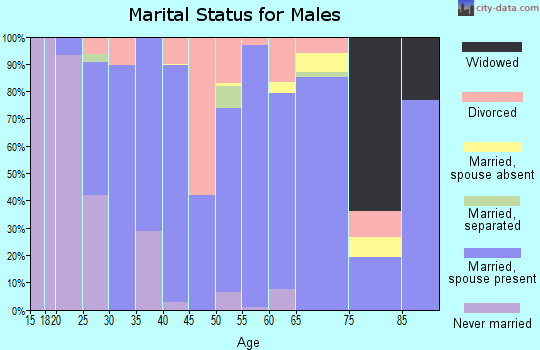
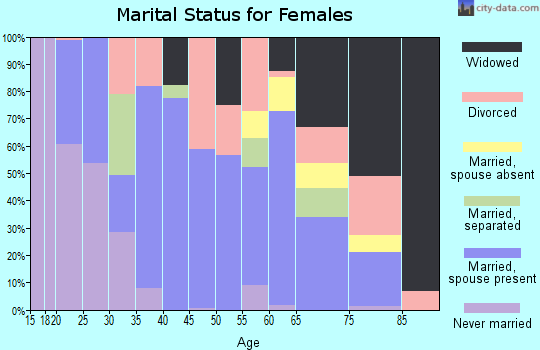
For population 15 years and over in 31553:
Never married: 28.1%
Now married: 50.3%
Separated: 2.1%
Widowed: 7.9%
Divorced: 11.5%
Zip code 31553 compared to state average:
Median household income below state average.
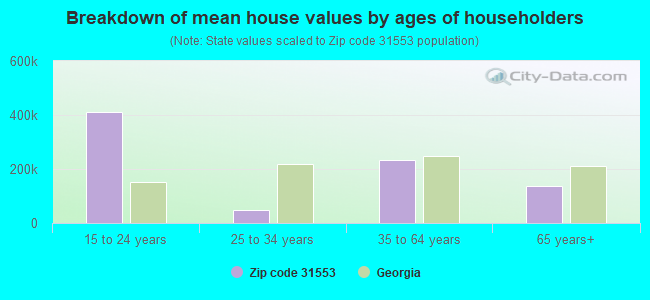
Median house value significantly below state average.
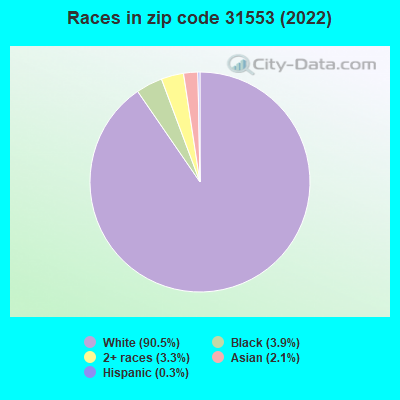
Black race population percentage significantly below state average.
Hispanic race population percentage significantly below state average.
Foreign-born population percentage significantly below state average.
Length of stay since moving in significantly above state average.
Number of college students below state average.
Percentage of population with a bachelor's degree or higher significantly below state average.
Averages for the 2020 tax year for zip code 31553, filed in 2021:
Average Adjusted Gross Income (AGI) in 2020: $45,800 (Individual Income Tax Returns)
Here:
$45,800
State:
$70,847
Salary/wage: $41,889 (reported on 83.7% of returns)
Here:
$41,889
State:
$59,126
(% of AGI for various income ranges: 1087.5% for AGIs below $25k, 3564.3% for AGIs $25k-50k, 6660.9% for AGIs $50k-75k, 9109.2% for AGIs $75k-100k, 14915.8% for AGIs $100k-200k)
Taxable interest for individuals: $802 (reported on 19.8% of returns)
This zip code:
$802
Georgia:
$2,011
(% of AGI for various income ranges: 2.9% for AGIs below $25k, 8.7% for AGIs $25k-50k, 33.5% for AGIs $50k-75k, 25.8% for AGIs $75k-100k, 128.3% for AGIs $100k-200k)
Ordinary dividends: $1,488 (reported on 7.9% of returns)
Here:
$1,488
State:
$8,996
(% of AGI for various income ranges: 4.3% for AGIs below $25k, 4.3% for AGIs $25k-50k, 29.6% for AGIs $50k-75k, 28.3% for AGIs $75k-100k, 73.3% for AGIs $100k-200k)
Net capital gain/loss in AGI: +$6,414 (reported on 6.9% of returns)
Here:
+$6,414
State:
+$28,402
(% of AGI for various income ranges: 2.0% for AGIs below $25k, 16.1% for AGIs $25k-50k, 107.0% for AGIs $50k-75k, 175.8% for AGIs $75k-100k, 295.0% for AGIs $100k-200k)
Profit/loss from business: +$5,834 (reported on 15.8% of returns)
Here:
+$5,834
State:
+$6,707
(% of AGI for various income ranges: 135.5% for AGIs below $25k, 157.0% for AGIs $25k-50k, 9.1% for AGIs $50k-75k, 257.5% for AGIs $100k-200k)
Taxable individual retirement arrangement distribution: $19,660 (reported on 5.0% of returns)
31553:
$19,660
Georgia:
$20,525
(% of AGI for various income ranges: 25.1% for AGIs below $25k, 62.4% for AGIs $25k-50k, 181.7% for AGIs $50k-75k, 915.0% for AGIs $75k-100k)
Total itemized deductions: $26,900 (reported on 3.5% of returns)
Here:
$26,900
State:
$34,001
(% of AGI for various income ranges: 312.6% for AGIs $50k-75k, 970.0% for AGIs $100k-200k)
Charity contributions: $9,167 (reported on 3.0% of returns)
Here:
$9,167
State:
$14,164
(% of AGI for various income ranges: 103.5% for AGIs $50k-75k, 260.0% for AGIs $100k-200k)
Taxes paid: $7,129 (reported on 3.5% of returns)
31553:
$7,129
State:
$7,540
(% of AGI for various income ranges: 74.8% for AGIs $50k-75k, 272.5% for AGIs $100k-200k)
Earned income credit: $2,461 (reported on 26.7% of returns)
Here:
$2,461
State:
$2,530
(% of AGI for various income ranges: 137.4% for AGIs below $25k, 94.8% for AGIs $25k-50k)
Percentage of individuals using paid preparers for their 2020 taxes: 96.5%
Here:
97%
State:
93%
(% for various income ranges: 96.2% for AGIs below $25k, 96.4% for AGIs $25k-50k, 96.8% for AGIs $50k-75k, 100.0% for AGIs $75k-100k, 94.4% for AGIs $100k-200k, 100.0% for AGIs over 200k)
Averages for the 2012 tax year for zip code 31553, filed in 2013:
Average Adjusted Gross Income (AGI) in 2012: $37,466 (Individual Income Tax Returns)
Here:
$37,466
State:
$56,131
Salary/wage: $33,227 (reported on 86.0% of returns)
Here:
$33,227
State:
$47,942
(% of AGI for various income ranges: 73.6% for AGIs below $25k, 82.5% for AGIs $25k-50k, 76.4% for AGIs $50k-75k, 79.9% for AGIs $75k-100k, 68.0% for AGIs $100k-200k)
Taxable interest for individuals: $805 (reported on 23.6% of returns)
This zip code:
$805
Georgia:
$1,706
(% of AGI for various income ranges: 1.0% for AGIs below $25k, 0.3% for AGIs $25k-50k, 0.4% for AGIs $50k-75k, 0.6% for AGIs $75k-100k, 0.4% for AGIs $100k-200k)
Ordinary dividends: $836 (reported on 6.2% of returns)
Here:
$836
State:
$7,265
(% of AGI for various income ranges: 0.2% for AGIs $50k-75k, 0.4% for AGIs $75k-100k)
Net capital gain/loss in AGI: +$5,808 (reported on 7.3% of returns)
Here:
+$5,808
State:
+$16,323
(% of AGI for various income ranges: 0.5% for AGIs below $25k, 0.7% for AGIs $25k-50k, 1.5% for AGIs $50k-75k, 2.6% for AGIs $100k-200k)
Profit/loss from business: +$7,600 (reported on 15.7% of returns)
Here:
+$7,600
State:
+$7,583
(% of AGI for various income ranges: 9.9% for AGIs below $25k, 3.0% for AGIs $25k-50k, 2.2% for AGIs $50k-75k, 0.4% for AGIs $75k-100k, 1.3% for AGIs $100k-200k)
Taxable individual retirement arrangement distribution: $14,927 (reported on 6.2% of returns)
31553:
$14,927
Georgia:
$17,199
(% of AGI for various income ranges: 2.6% for AGIs below $25k, 2.2% for AGIs $25k-50k, 2.5% for AGIs $50k-75k, 4.6% for AGIs $100k-200k)
Total itemized deductions: $17,498 (25% of AGI, reported on 24.2% of returns)
Here:
$17,498
State:
$23,886
Here:
24.8% of AGI
State:
21.5% of AGI
(% of AGI for various income ranges: 5.6% for AGIs below $25k, 8.4% for AGIs $25k-50k, 12.8% for AGIs $50k-75k, 16.9% for AGIs $75k-100k, 13.3% for AGIs $100k-200k)
Charity contributions: $3,562 (reported on 18.0% of returns)
Here:
$3,562
State:
$5,507
(% of AGI for various income ranges: 0.5% for AGIs below $25k, 1.1% for AGIs $25k-50k, 1.5% for AGIs $50k-75k, 2.9% for AGIs $75k-100k, 2.7% for AGIs $100k-200k)
Taxes paid: $5,344 (reported on 24.2% of returns)
31553:
$5,344
State:
$7,838
(% of AGI for various income ranges: 1.0% for AGIs below $25k, 2.2% for AGIs $25k-50k, 3.5% for AGIs $50k-75k, 5.3% for AGIs $75k-100k, 5.4% for AGIs $100k-200k)
Earned income credit: $2,646 (reported on 31.5% of returns)
Here:
$2,646
State:
$2,589
(% of AGI for various income ranges: 10.8% for AGIs below $25k, 1.8% for AGIs $25k-50k)
Percentage of individuals using paid preparers for their 2012 taxes: 66.9%
Here:
67%
State:
55%
(% for various income ranges: 63.2% for AGIs below $25k, 66.7% for AGIs $25k-50k, 70.8% for AGIs $50k-75k, 75.0% for AGIs $75k-100k, 80.0% for AGIs $100k-200k)
Averages for the 2004 tax year for zip code 31553, filed in 2005:
Average Adjusted Gross Income (AGI) in 2004: $31,359 (Individual Income Tax Returns)
Here:
$31,359
State:
$47,553
Salary/wage: $28,862 (reported on 86.8% of returns)
Here:
$28,862
State:
$42,178
(% of AGI for various income ranges: 148.1% for AGIs below $10k, 79.7% for AGIs $10k-25k, 84.8% for AGIs $25k-50k, 86.2% for AGIs $50k-75k, 84.0% for AGIs $75k-100k, 39.6% for AGIs over 100k)
Taxable interest for individuals: $1,381 (reported on 29.8% of returns)
This zip code:
$1,381
Georgia:
$1,772
(% of AGI for various income ranges: 3.6% for AGIs below $10k, 1.3% for AGIs $10k-25k, 0.9% for AGIs $25k-50k, 0.4% for AGIs $50k-75k, 0.6% for AGIs $75k-100k, 4.3% for AGIs over 100k)
Taxable dividends: $2,258 (reported on 8.2% of returns)
Here:
$2,258
State:
$4,283
(% of AGI for various income ranges: 2.1% for AGIs below $10k, 0.6% for AGIs $10k-25k, 0.2% for AGIs $25k-50k, 0.5% for AGIs $50k-75k, 0.2% for AGIs $75k-100k, 1.7% for AGIs over 100k)
Net capital gain/loss: +$3,667 (reported on 5.9% of returns)
Here:
+$3,667
State:
+$16,461
(% of AGI for various income ranges: 0.9% for AGIs below $10k, -0.1% for AGIs $10k-25k, 0.1% for AGIs $25k-50k, 0.0% for AGIs $50k-75k, 0.7% for AGIs $75k-100k, 4.3% for AGIs over 100k)
Profit/loss from business: +$6,098 (reported on 15.6% of returns)
Here:
+$6,098
State:
+$8,201
(% of AGI for various income ranges: 16.8% for AGIs below $10k, 6.2% for AGIs $10k-25k, 3.8% for AGIs $25k-50k, 1.2% for AGIs $50k-75k, 1.4% for AGIs over 100k)
IRA payment deduction: $2,353 (reported on 0.9% of returns)
31553:
$2,353
Georgia:
$2,969
Total itemized deductions: $16,076 (24% of AGI, reported on 19.4% of returns)
Here:
$16,076
State:
$19,944
Here:
24.1% of AGI
State:
22.6% of AGI
(% of AGI for various income ranges: 4.8% for AGIs $10k-25k, 9.9% for AGIs $25k-50k, 11.4% for AGIs $50k-75k, 14.6% for AGIs $75k-100k, 10.7% for AGIs over 100k)
Charity contributions deductions: $3,520 (5% of AGI, reported on 16.7% of returns)
Here:
$3,520
State:
$4,354
Here:
5.0% of AGI
State:
4.7% of AGI
(% of AGI for various income ranges: 0.7% for AGIs $10k-25k, 1.4% for AGIs $25k-50k, 1.9% for AGIs $50k-75k, 2.7% for AGIs $75k-100k, 3.9% for AGIs over 100k)
Total tax: $3,806 (reported on 66.8% of returns)
31553:
$3,806
State:
$8,223
(% of AGI for various income ranges: 3.9% for AGIs below $10k, 3.9% for AGIs $10k-25k, 5.8% for AGIs $25k-50k, 7.9% for AGIs $50k-75k, 9.7% for AGIs $75k-100k, 18.6% for AGIs over 100k)
Earned income credit: $1,837 (reported on 28.1% of returns)
Here:
$1,837
State:
$1,986
Percentage of individuals using paid preparers for their 2004 taxes: 75.1%
Here:
75%
State:
62%
(% for various income ranges: 72.6% for AGIs below $10k, 79.4% for AGIs $10k-25k, 74.4% for AGIs $25k-50k, 71.4% for AGIs $50k-75k, 74.0% for AGIs $75k-100k, 76.3% for AGIs over 100k)
Household received Food Stamps/SNAP in the past 12 months: 315 Household did not receive Food Stamps/SNAP in the past 12 months: 1,629
Women who had a birth in the past 12 months: 37 (32 now married, 4 unmarried) Women who did not have a birth in the past 12 months: 948 (460 now married, 487 unmarried)
Housing units in zip code 31553 with a mortgage: 402 Houses without a mortgage: 19
Median monthly owner costs for units with a mortgage: $1,087 Median monthly owner costs for units without a mortgage: $400
Residents with income below the poverty level in 2022:
This zip code:
16.2%
Whole state:
12.7%
Residents with income below 50% of the poverty level in 2022:
This zip code:
8.9%
Whole state:
6.3%
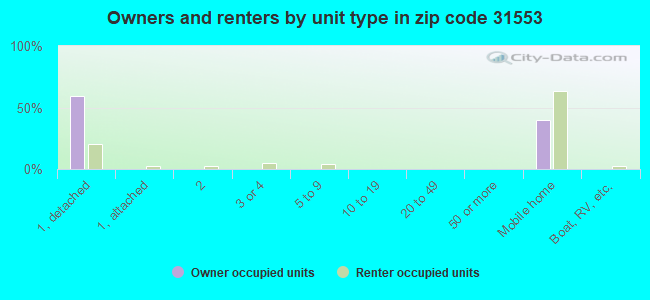
Median number of rooms in houses and condos:
Here:
6.2
State:
6.8
Median number of rooms in apartments:
Here:
5.0
State:
4.6
Notable locations in this zip code not listed on our city pages
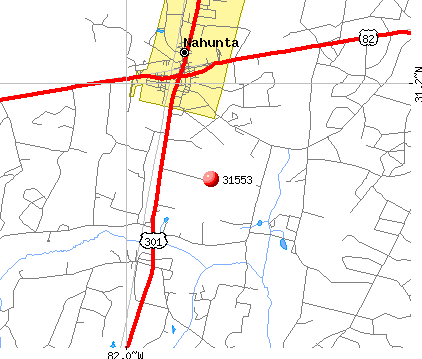
Notable locations in zip code 31553: Mouth of the Swamp Landing (A), Strickland Landing (B), Dubberly Landing (C), Davidson Landing (D), Ammons Ferry (E), Nahunta Volunteer Fire Department (F), Brantley County Jail (G), Brantley County Courthouse (H), Nahunta City Hall (I). Display/hide their locations on the map
Churches in zip code 31553 include: Raybon Church (A), Lulaton Baptist Church (B), Bachlott Church (C), Hickox Baptist Church (D), Grace Church (E), First Baptist Church (F), Community Church (G), Bethlehem Church (H), Nahunta United Methodist Church (I). Display/hide their locations on the map
Lakes, reservoirs, and swamps: Bonnet Lake (A), Spring Lake (B), Kings Lake (C), Buck Lake (D), Long Lake (E), Teston Lake (F), Gator Lake (G), Forked Lake (H). Display/hide their locations on the map
In group quarters: 75 (-1 institutionalized population)
Size of family households: 457 2-persons, 459 3-persons, 265 4-persons, 92 5-persons
Size of nonfamily households: 637 1-person, 9 2-persons, 9 3-persons
597 married couples with children.
400 single-parent households (186 men, 214 women).
99.0% of residents of 31553 zip code speak English at home.
0.7% of residents speak Spanish at home (100% very well).
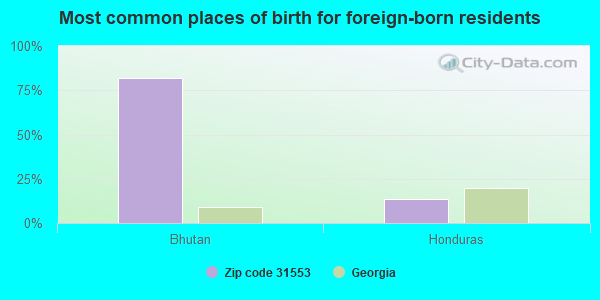
Foreign born population: 63 (1.3%) (0.0% of them are naturalized citizens)
:
1.3%
Whole state:
10.7%
82%Bhutan
14%Honduras
8%American
4%Irish
3%English
3%British
1%Polish
1%European
0%German
Year of entry for the foreign-born population
122010 or later
602000 to 2009
121990 to 1999
10Before 1990
Facilities with environmental interests located in this zip code:
BRANTLEY COUNTY HIGH SCHOOL (RR 1, BOX 4 in NAHUNTA, GA)
(Geographic Names Information System) (National Center for Education Statistics) - STATE ID-1050
BRANTLEY COUNTY MIDDLE SCHOOL (RR 1, BOX 4D in NAHUNTA, GA)
(National Center for Education Statistics) - STATE ID-0194
NAHUNTA ELEMENTARY SCHOOL (RR 2, BOX 24 in NAHUNTA, GA)
(National Center for Education Statistics) - STATE ID-0294 Organizations: BRANTLEY COUNTY (SCHOOL DISTRICT)
NAHUNTA PRIMARY SCHOOL (RR 2, BOX 23 in NAHUNTA, GA)
(National Center for Education Statistics) - STATE ID-3050 Organizations: BRANTLEY COUNTY (SCHOOL DISTRICT)
NAHUNTA LAS (112 EAST PALOMA DR in NAHUNTA, GA)
National Pollutant Discharge Elimination System NON-MAJOR (Tracking pollutant discharge elimination systems) - permit Business SIC classification: SEWERAGE SYSTEMS Organizations: CITY OF NAHUNTA (LAS) (CONTACT/OWNER)
Alternative names: NAHUNTA, CITY OF
BRANTLEY COUNTY SCHOOL DISTRICT (HIGHWAY 82 in NAHUNTA, GA)
COMPLIANCE ACTIVITY (Tracking inspections of insecticide, fungicide, and rodenticide, and toxic substances)
BRANTLEY COUNTY / SMYRNA CHURCH RD LANDFILL (SMYRNA CHURCH ROAD in NAHUNTA, GA)
CRITERIA AND HAZARDOUS AIR POLLUTANT INVENTORY (Inventory of air pollution sources) Business SIC classification: REFUSE SYSTEMS Business NAICS classification: SOLID WASTE LANDFILL.
OGLETHORPE POWER CORP (E. PALOMA RD. in NAHUNTA, GA)
AIR SYNTHETIC MINOR (AIRS/AFS) Business SIC classification: ELECTRIC SERVICES Alternative names: OGLETHORPE POWER CORP-NAHUNTA SUBSTN
Housing units lacking complete plumbing facilities: 5.2% Housing units lacking complete kitchen facilities: 3.5%
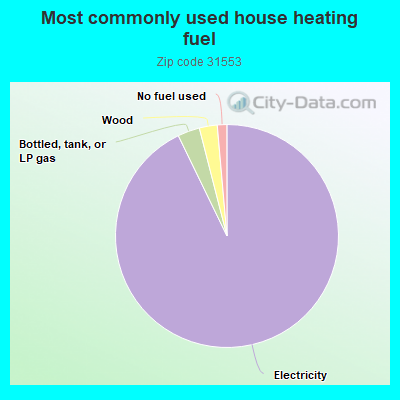
93.0%Electricity
3.2%Bottled, tank, or LP gas
2.6%Wood
1.4%No fuel used
Population in 1990: 3,158. Population change in the 1990s: +771 (+24.4%).
Place of birth for U.S.-born residents:
This state: 3,599
Northeast: 83
Midwest: 225
South: 735
West: 29
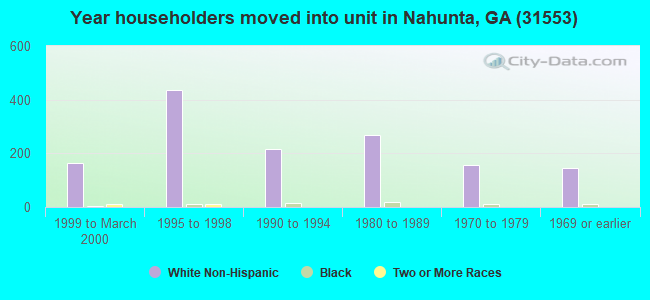
66% of the 31553 zip code residents lived in the same house 5 years ago. Out of people who lived in different houses, 56% lived in this county. Out of people who lived in different counties, 50% lived in Georgia.
97% of the 31553 zip code residents lived in the same house 1 year ago. Out of people who lived in different houses, 14% moved from this county. Out of people who lived in different houses, 86% moved from different county within same state. Out of people who lived in different houses, 11% moved from different state.
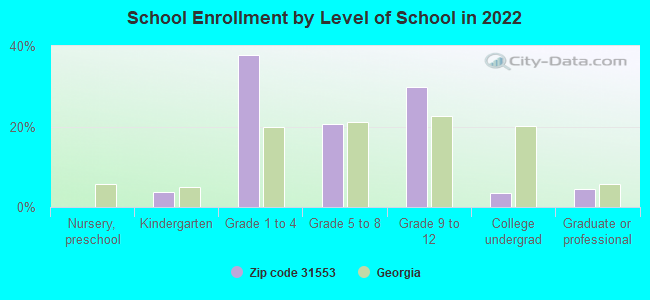
Private vs. public school enrollment:
Students in private schools in grades 1 to 8 (elementary and middle school): 5
Here:
0.9%
Georgia:
12.1%
Students in private schools in grades 9 to 12 (high school):
Here:
0.0%
Georgia:
10.8%
Students in private undergraduate colleges: 13
Here:
37.0%
Georgia:
17.1%
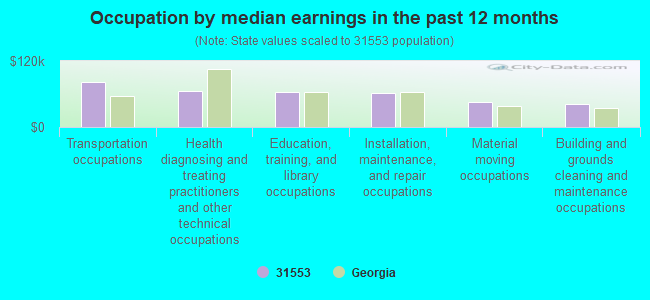
Occupation by median earnings in the past 12 months ($)
82,437Transportation occupations
65,484Health diagnosing and treating practitioners and other technical occupations
63,474Education, training, and library occupations
62,032Installation, maintenance, and repair occupations
45,630Material moving occupations
42,477Building and grounds cleaning and maintenance occupations
Top industries in this zip code by the number of employees in 2005:
Health Care and Social Assistance: Nursing Care Facilities (50-99: 1)
Finance and Insurance: Commercial Banking (10-19: 1, 5-9: 1)
Construction: Highway, Street, and Bridge Construction (10-19: 1, 1-4: 1)
People in group quarters in 2010:
61 people in nursing facilities/skilled-nursing facilities
People in group quarters in 2000:
66 people in nursing homes
15 people in local jails and other confinement facilities (including police lockups)
Fatal accident statistics in 2014:
Fatal accident count: 1
Vehicles involved in fatal accidents: 1
Fatal accidents caused by drunken drivers: 1
Fatalities: 1
Persons involved in fatal accidents: 1
Pedestrians involved in fatal accidents: 0
Fatal accident statistics in 2013:
Fatal accident count: 2
Vehicles involved in fatal accidents: 2
Fatal accidents caused by drunken drivers: 0
Fatalities: 2
Persons involved in fatal accidents: 2
Pedestrians involved in fatal accidents: 0
2003 - 2018 National Fire Incident Reporting System (NFIRS) incidents
According to the data from the years 2003 - 2018 the average number of fires per year is 26. The highest number of reported fires - 76 took place in 2009, and the least - 0 in 2014. The data has a growing trend.
When looking into fire subcategories, the most reports belonged to: Outside Fires (54.9%), and Structure Fires (33.8%).
Fire incident types reported to NFIRS in Zip Code 31553
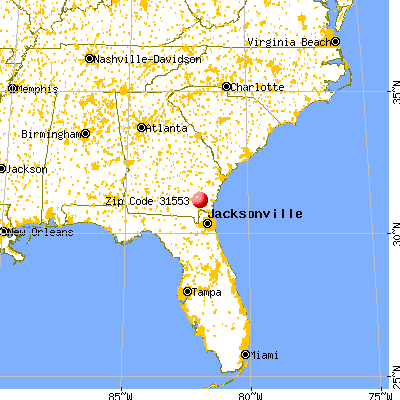


 Nearest zip codes: 31542, 31566, 31543, 31568, 31557, 31556.
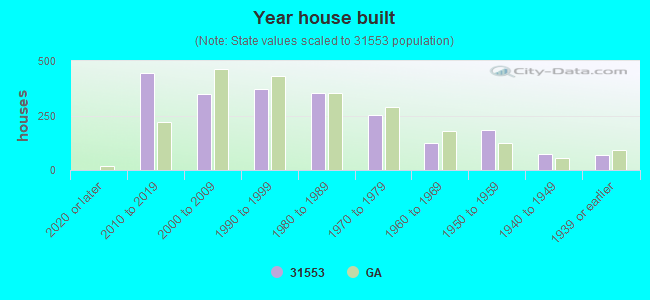


 According to the data from the years 2003 - 2018 the average number of fires per year is 26. The highest number of reported fires - 76 took place in 2009, and the least - 0 in 2014. The data has a growing trend.
 When looking into fire subcategories, the most reports belonged to: Outside Fires (54.9%), and Structure Fires (33.8%).