Estimated zip code population in 2022: 2,930 Zip code population in 2010: 2,921 Zip code population in 2000: 4,445
Houses and condos: 1,264 Renter-occupied apartments: 181
% of renters here:
17%
State:
33%
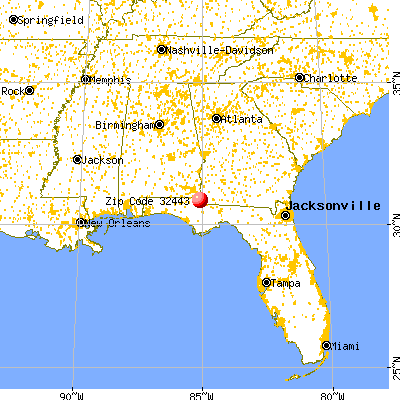
March 2022 cost of living index in zip code 32443: 80.8 (low, U.S. average is 100)
Land area: 59.0 sq. mi. Water area: 0.1 sq. mi.
Population density: 50 people per square mile
(very low).
OSM Map
General Map
Google Map
MSN Map
OSM Map
General Map
Google Map
MSN Map
OSM Map
General Map
Google Map
MSN Map
OSM Map
General Map
Google Map
MSN Map
Please wait while loading the map...
Real estate property taxes paid for housing units in 2022:
This zip code:
0.8% ($1,080)
Florida:
0.7% ($2,529)
Median real estate property taxes paid for housing units with mortgages in 2022: $1,165 (0.7%) Median real estate property taxes paid for housing units with no mortgage in 2022: $844 (0.6%)
Business Search- 14 Million verified businesses
Males: 1,376
(47.0%)
Females: 1,553
(53.0%)
For population 25 years and over in 32443:
High school or higher: 83.5%
Bachelor's degree or higher: 19.5%
Graduate or professional degree: 7.2%
Unemployed: 10.1%
Mean travel time to work (commute): 25.2 minutes
For population 15 years and over in 32443:
Never married: 30.2%
Now married: 45.9%
Separated: 3.0%
Widowed: 5.0%
Divorced: 16.0%
Zip code 32443 compared to state average:
Median house value significantly below state average.
Unemployed percentage above state average.
Black race population percentage above state average.
Hispanic race population percentage significantly below state average.
Foreign-born population percentage significantly below state average.
Renting percentage below state average.
Length of stay since moving in significantly above state average.
Percentage of population with a bachelor's degree or higher below state average.
Averages for the 2020 tax year for zip code 32443, filed in 2021:
Average Adjusted Gross Income (AGI) in 2020: $38,524 (Individual Income Tax Returns)
Here:
$38,524
State:
$82,200
Salary/wage: $32,297 (reported on 80.3% of returns)
Here:
$32,297
State:
$58,347
(% of AGI for various income ranges: 1279.8% for AGIs below $25k, 3403.9% for AGIs $25k-50k, 5766.4% for AGIs $50k-75k, 7430.0% for AGIs $75k-100k, 13112.0% for AGIs $100k-200k)
Taxable interest for individuals: $458 (reported on 16.9% of returns)
This zip code:
$458
Florida:
$4,272
(% of AGI for various income ranges: 2.7% for AGIs below $25k, 3.4% for AGIs $25k-50k, 44.5% for AGIs $50k-75k, 15.0% for AGIs $75k-100k, 50.0% for AGIs $100k-200k)
Ordinary dividends: $1,460 (reported on 3.5% of returns)
Here:
$1,460
State:
$15,863
(% of AGI for various income ranges: 2.5% for AGIs below $25k, 100.0% for AGIs $75k-100k)
Net capital gain/loss in AGI: +$3,050 (reported on 4.2% of returns)
Here:
+$3,050
State:
+$62,983
(% of AGI for various income ranges: 28.9% for AGIs $25k-50k, 121.7% for AGIs $75k-100k)
Profit/loss from business: +$2,217 (reported on 16.2% of returns)
Here:
+$2,217
State:
+$9,719
(% of AGI for various income ranges: 64.5% for AGIs below $25k, 29.2% for AGIs $25k-50k, 116.7% for AGIs $75k-100k)
Taxable individual retirement arrangement distribution: $10,489 (reported on 6.3% of returns)
32443:
$10,489
Florida:
$24,823
(% of AGI for various income ranges: 140.8% for AGIs $25k-50k, 681.7% for AGIs $75k-100k)
Total itemized deductions: $31,140 (reported on 3.5% of returns)
Here:
$31,140
State:
$45,393
(% of AGI for various income ranges: 202.1% for AGIs $25k-50k, 1315.0% for AGIs $75k-100k)
Charity contributions: $15,925 (reported on 2.8% of returns)
Here:
$15,925
State:
$20,178
(% of AGI for various income ranges: 579.1% for AGIs $50k-75k)
Taxes paid: $2,840 (reported on 3.5% of returns)
32443:
$2,840
State:
$6,967
(% of AGI for various income ranges: 129.1% for AGIs $50k-75k)
Earned income credit: $2,974 (reported on 29.6% of returns)
Here:
$2,974
State:
$2,306
(% of AGI for various income ranges: 159.8% for AGIs below $25k, 114.2% for AGIs $25k-50k)
Percentage of individuals using paid preparers for their 2020 taxes: 93.0%
Here:
93%
State:
92%
(% for various income ranges: 93.5% for AGIs below $25k, 93.5% for AGIs $25k-50k, 88.2% for AGIs $50k-75k, 88.9% for AGIs $75k-100k, 100.0% for AGIs $100k-200k)
Averages for the 2012 tax year for zip code 32443, filed in 2013:
Average Adjusted Gross Income (AGI) in 2012: $34,261 (Individual Income Tax Returns)
Here:
$34,261
State:
$60,316
Salary/wage: $28,378 (reported on 80.5% of returns)
Here:
$28,378
State:
$45,277
(% of AGI for various income ranges: 80.8% for AGIs below $25k, 75.5% for AGIs $25k-50k, 66.7% for AGIs $50k-75k, 53.0% for AGIs $75k-100k, 43.0% for AGIs $100k-200k)
Taxable interest for individuals: $653 (reported on 23.4% of returns)
This zip code:
$653
Florida:
$3,587
(% of AGI for various income ranges: 0.4% for AGIs below $25k, 0.7% for AGIs $25k-50k, 0.3% for AGIs $50k-75k, 0.5% for AGIs $75k-100k, 0.2% for AGIs $100k-200k)
Ordinary dividends: $1,050 (reported on 4.7% of returns)
Here:
$1,050
State:
$12,831
Net capital gain/loss in AGI: +$3,600 (reported on 3.1% of returns)
Here:
+$3,600
State:
+$33,493
Profit/loss from business: +$1,984 (reported on 14.8% of returns)
Here:
+$1,984
State:
+$10,012
(% of AGI for various income ranges: 4.1% for AGIs below $25k, 0.2% for AGIs $25k-50k)
Taxable individual retirement arrangement distribution: $11,733 (reported on 7.0% of returns)
32443:
$11,733
Florida:
$21,544
(% of AGI for various income ranges: 3.0% for AGIs $25k-50k, 2.6% for AGIs $50k-75k, 8.4% for AGIs $75k-100k)
Total itemized deductions: $17,428 (30% of AGI, reported on 14.1% of returns)
Here:
$17,428
State:
$25,533
Here:
30.2% of AGI
State:
18.0% of AGI
(% of AGI for various income ranges: 3.7% for AGIs below $25k, 7.8% for AGIs $25k-50k, 7.6% for AGIs $50k-75k, 7.6% for AGIs $75k-100k, 9.6% for AGIs $100k-200k)
Charity contributions: $5,762 (reported on 10.2% of returns)
Here:
$5,762
State:
$5,698
(% of AGI for various income ranges: 1.9% for AGIs $25k-50k, 3.2% for AGIs $50k-75k, 2.9% for AGIs $100k-200k)
Taxes paid: $2,159 (reported on 13.3% of returns)
32443:
$2,159
State:
$6,203
(% of AGI for various income ranges: 0.4% for AGIs below $25k, 0.6% for AGIs $25k-50k, 0.9% for AGIs $50k-75k, 1.1% for AGIs $75k-100k, 1.4% for AGIs $100k-200k)
Earned income credit: $2,663 (reported on 32.0% of returns)
Here:
$2,663
State:
$2,372
(% of AGI for various income ranges: 9.7% for AGIs below $25k, 1.4% for AGIs $25k-50k)
Percentage of individuals using paid preparers for their 2012 taxes: 54.7%
Here:
55%
State:
54%
(% for various income ranges: 53.0% for AGIs below $25k, 51.4% for AGIs $25k-50k, 56.2% for AGIs $50k-75k, 66.7% for AGIs $75k-100k, 80.0% for AGIs $100k-200k)
Averages for the 2004 tax year for zip code 32443, filed in 2005:
Average Adjusted Gross Income (AGI) in 2004: $28,148 (Individual Income Tax Returns)
Here:
$28,148
State:
$50,523
Salary/wage: $26,703 (reported on 85.3% of returns)
Here:
$26,703
State:
$39,563
(% of AGI for various income ranges: 175.2% for AGIs below $10k, 83.3% for AGIs $10k-25k, 86.2% for AGIs $25k-50k, 79.3% for AGIs $50k-75k, 84.6% for AGIs $75k-100k, 42.0% for AGIs over 100k)
Taxable interest for individuals: $824 (reported on 28.0% of returns)
This zip code:
$824
Florida:
$3,211
(% of AGI for various income ranges: 2.8% for AGIs below $10k, 1.0% for AGIs $10k-25k, 0.6% for AGIs $25k-50k, 0.6% for AGIs $50k-75k, 0.6% for AGIs $75k-100k, 1.4% for AGIs over 100k)
Taxable dividends: $884 (reported on 5.4% of returns)
Here:
$884
State:
$6,129
(% of AGI for various income ranges: 0.2% for AGIs $10k-25k, 0.2% for AGIs $25k-50k, 0.1% for AGIs $50k-75k, 0.4% for AGIs over 100k)
Net capital gain/loss: +$5,033 (reported on 4.7% of returns)
Here:
+$5,033
State:
+$27,205
(% of AGI for various income ranges: -0.5% for AGIs below $10k, -0.1% for AGIs $25k-50k, 1.1% for AGIs $50k-75k, 5.9% for AGIs over 100k)
Profit/loss from business: +$4,737 (reported on 11.9% of returns)
Here:
+$4,737
State:
+$10,634
(% of AGI for various income ranges: -9.7% for AGIs below $10k, 3.2% for AGIs $10k-25k, 0.7% for AGIs $25k-50k, 0.2% for AGIs $50k-75k, 12.8% for AGIs $75k-100k)
Total itemized deductions: $14,974 (27% of AGI, reported on 12.0% of returns)
Here:
$14,974
State:
$20,370
Here:
27.5% of AGI
State:
20.7% of AGI
(% of AGI for various income ranges: 3.5% for AGIs $10k-25k, 7.2% for AGIs $25k-50k, 7.5% for AGIs $50k-75k, 9.0% for AGIs $75k-100k, 6.7% for AGIs over 100k)
Charity contributions deductions: $4,516 (8% of AGI, reported on 10.0% of returns)
Here:
$4,516
State:
$4,064
Here:
7.8% of AGI
State:
3.8% of AGI
(% of AGI for various income ranges: 0.5% for AGIs $10k-25k, 2.0% for AGIs $25k-50k, 1.5% for AGIs $50k-75k, 2.9% for AGIs $75k-100k, 2.3% for AGIs over 100k)
Total tax: $3,439 (reported on 63.1% of returns)
32443:
$3,439
State:
$9,431
(% of AGI for various income ranges: 3.1% for AGIs below $10k, 2.9% for AGIs $10k-25k, 6.0% for AGIs $25k-50k, 8.7% for AGIs $50k-75k, 10.8% for AGIs $75k-100k, 19.2% for AGIs over 100k)
Earned income credit: $2,042 (reported on 31.6% of returns)
Here:
$2,042
State:
$1,808
Percentage of individuals using paid preparers for their 2004 taxes: 64.0%
Here:
64%
State:
60%
(% for various income ranges: 55.6% for AGIs below $10k, 66.3% for AGIs $10k-25k, 66.3% for AGIs $25k-50k, 63.8% for AGIs $50k-75k, 60.0% for AGIs $75k-100k, 77.8% for AGIs over 100k)
Likely homosexual households (counted as self-reported same-sex unmarried-partner households)
Lesbian couples: 0.4% of all households
Gay men: 0.0% of all households
Household received Food Stamps/SNAP in the past 12 months: 226 Household did not receive Food Stamps/SNAP in the past 12 months: 827
Women who had a birth in the past 12 months: 101 (0 now married, 92 unmarried) Women who did not have a birth in the past 12 months: 481 (174 now married, 306 unmarried)
Housing units in zip code 32443 with a mortgage: 235 (6 second mortgage, 6 both second mortgage and home equity loan) Median monthly owner costs for units with a mortgage: $1,209 Median monthly owner costs for units without a mortgage: $405
Residents with income below the poverty level in 2022:
This zip code:
28.4%
Whole state:
12.7%
Residents with income below 50% of the poverty level in 2022:
This zip code:
12.8%
Whole state:
6.6%
Median number of rooms in houses and condos:
Here:
6.0
State:
5.9
Median number of rooms in apartments:
Here:
5.3
State:
4.2
Notable locations in this zip code not listed on our city pages
Churches in zip code 32443 include: Allen Chapel (A), Cottage Hill Church (B), New Hope Church (C), Greenwood Chapel (D). Display/hide their locations on the map
Size of family households: 427 2-persons, 71 3-persons, 131 4-persons, 80 5-persons, 2 6-persons, 45 7-or-more-persons
Size of nonfamily households: 224 1-person, 77 2-persons, 3 4-persons
231 married couples with children.
223 single-parent households (68 men, 155 women).
97.1% of residents of 32443 zip code speak English at home.
1.6% of residents speak Spanish at home (57% very well, 16% well, 18% not well, 9% not at all).
0.7% of residents speak Asian or Pacific Island language at home (100% very well).
Foreign born population: 24 (0.8%) (34.2% of them are naturalized citizens)
This zip code:
0.8%
Whole state:
21.7%
62%Honduras
4%Iraq
35%American
7%Irish
2%English
2%African
2%Italian
2%Scotch-Irish
1%British
Year of entry for the foreign-born population
32010 or later
122000 to 2009
31990 to 1999
9Before 1990
Facilities with environmental interests located in this zip code:
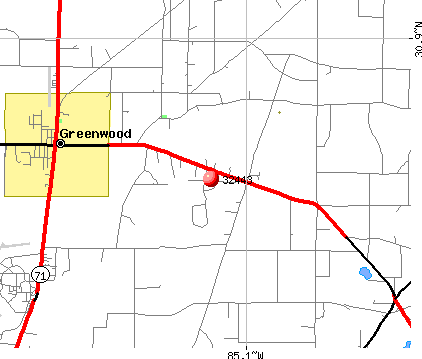
AGRICO CHEM CO AGRICO FARM CENTER (4TH AND BERKLEY in GREENWOOD, FL)
(Resource Conservation and Recovery Act (tracking hazardous waste)) Organizations: HAROLD LONG, JR, MGR ENV CONTR (CONTACT/OWNER)
GEORGE H DAVIS COMPANY INCORPORATED (1444 SOUTH MAIN STREET in GREENWOOD, FL)
(Resource Conservation and Recovery Act (tracking hazardous waste)) Organizations: DAVIS MARION H DLR (CONTACT/OWNER)
Housing units lacking complete plumbing facilities: 4.0% Housing units lacking complete kitchen facilities: 3.7%
90.4%Electricity
6.9%Bottled, tank, or LP gas
1.9%No fuel used
0.7%Wood
Population in 1990: 4,058. Population change in the 1990s: +387 (+9.5%).
Place of birth for U.S.-born residents:
This state: 1,581
Northeast: 168
Midwest: 137
South: 930
West: 52
68% of the 32443 zip code residents lived in the same house 5 years ago. Out of people who lived in different houses, 48% lived in this county. Out of people who lived in different counties, 50% lived in Florida.
98% of the 32443 zip code residents lived in the same house 1 year ago. Out of people who lived in different houses, 93% moved from this county. Out of people who lived in different houses, 14% moved from different county within same state. Out of people who lived in different houses, 2% moved from abroad.
Private vs. public school enrollment:
Students in private schools in grades 1 to 8 (elementary and middle school): 9
Here:
3.5%
Florida:
15.8%
Students in private schools in grades 9 to 12 (high school): 5
Here:
5.8%
Florida:
12.9%
Students in private undergraduate colleges: 21
Here:
22.6%
Florida:
23.6%
Occupation by median earnings in the past 12 months ($)
69,036Health diagnosing and treating practitioners and other technical occupations
60,150Office and administrative support occupations
53,523Education, training, and library occupations
49,932Business and financial operations occupations
48,884Law enforcement workers including supervisors
45,446Installation, maintenance, and repair occupations
Top industries in this zip code by the number of employees in 2005:
Health Care and Social Assistance: Other Individual and Family Services (10-19 employees: 1 establishment)
Other Services (except Public Administration): General Automotive Repair (1-4: 1)
Other Services (except Public Administration): Religious Organizations (1-4: 1)
Professional, Scientific, and Technical Services: Tax Preparation Services (1-4: 1)
Construction: Commercial and Institutional Building Construction (1-4: 1)
Finance and Insurance: Commercial Banking (1-4: 1)
People in group quarters in 2000:
1,462 people in federal prisons and detention centers
12 people in homes or halfway houses for drug/alcohol abuse
Fatal accident statistics in 2013:
Fatal accident count: 1
Vehicles involved in fatal accidents: 1
Fatal accidents caused by drunken drivers: 0
Fatalities: 1
Persons involved in fatal accidents: 1
Pedestrians involved in fatal accidents: 0
Fatal accident statistics in 2010:
Fatal accident count: 1
Vehicles involved in fatal accidents: 1
Fatal accidents caused by drunken drivers: 1
Fatalities: 1
Persons involved in fatal accidents: 1
Pedestrians involved in fatal accidents: 0
2002 - 2018 National Fire Incident Reporting System (NFIRS) incidents
Based on the data from the years 2002 - 2018 the average number of fire incidents per year is 11. The highest number of fires - 21 took place in 2014, and the least - 0 in 2008. The data has an increasing trend.
When looking into fire subcategories, the most incidents belonged to: Outside Fires (43.0%), and Structure Fires (32.8%).
Fire incident types reported to NFIRS in Zip Code 32443


 Nearest zip codes: 32423, 32446, 32445, 32432, 32447, 36343.


 Based on the data from the years 2002 - 2018 the average number of fire incidents per year is 11. The highest number of fires - 21 took place in 2014, and the least - 0 in 2008. The data has an increasing trend.
 When looking into fire subcategories, the most incidents belonged to: Outside Fires (43.0%), and Structure Fires (32.8%).