Estimated zip code population in 2022: 2,756 Zip code population in 2010: 2,630 Zip code population in 2000: 2,973
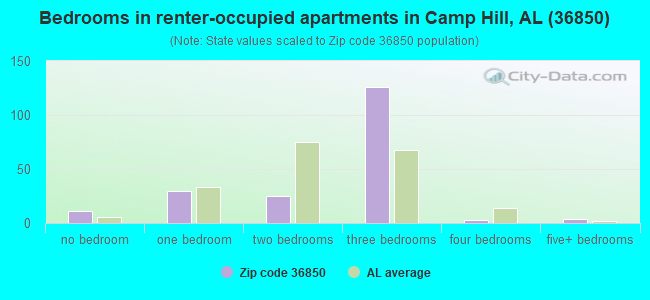
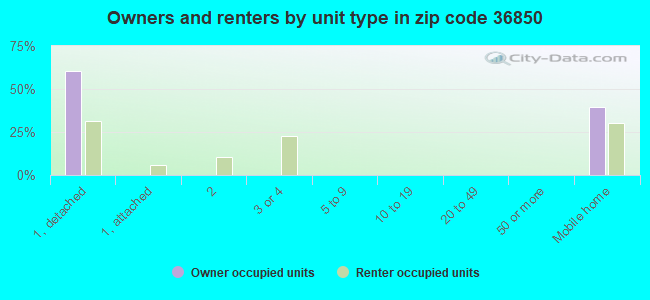
Houses and condos: 1,517 Renter-occupied apartments: 200
% of renters here:
17%
State:
30%
March 2022 cost of living index in zip code 36850: 79.3 (low, U.S. average is 100)
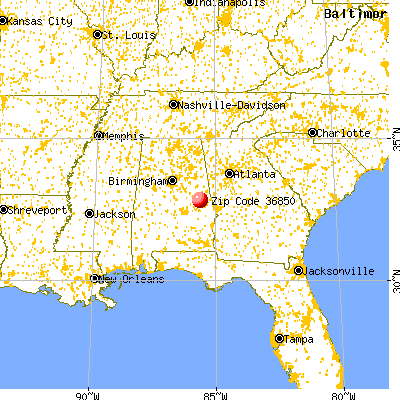
Land area: 147.7 sq. mi. Water area: 0.5 sq. mi.
Population density: 19 people per square mile
(very low).
OSM Map
General Map
Google Map
MSN Map
OSM Map
General Map
Google Map
MSN Map
OSM Map
General Map
Google Map
MSN Map
OSM Map
General Map
Google Map
MSN Map
Please wait while loading the map...
Real estate property taxes paid for housing units in 2022:
This zip code:
0.4% ($262)
Alabama:
0.4% ($718)
Median real estate property taxes paid for housing units with mortgages in 2022: $207 (0.4%) Median real estate property taxes paid for housing units with no mortgage in 2022: $264 (0.3%)
Business Search- 14 Million verified businesses
Males: 1,285
(46.7%)
Females: 1,470
(53.3%)
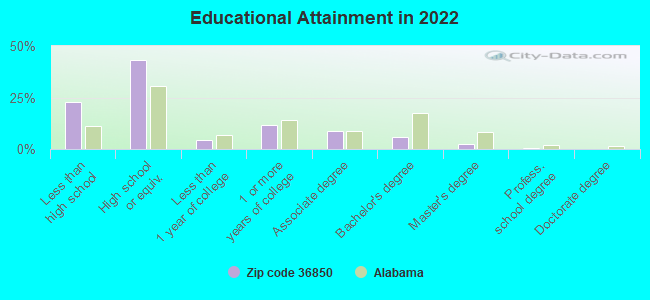
For population 25 years and over in 36850:
High school or higher: 75.7%
Bachelor's degree or higher: 9.1%
Graduate or professional degree: 3.1%
Unemployed: 6.4%
Mean travel time to work (commute): 29.0 minutes
For population 15 years and over in 36850:
Never married: 31.9%
Now married: 40.5%
Separated: 4.0%
Widowed: 5.3%
Divorced: 18.2%
Zip code 36850 compared to state average:
Median house value significantly below state average.
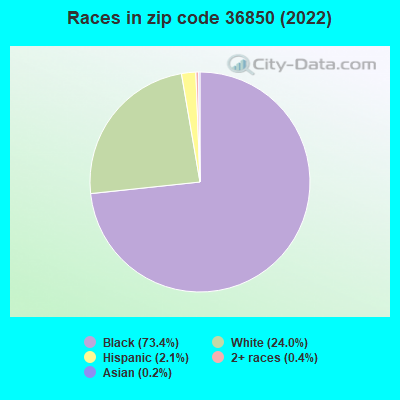
Black race population percentage above state average.
Hispanic race population percentage below state average.
Median age significantly above state average.
Foreign-born population percentage significantly below state average.
Renting percentage below state average.
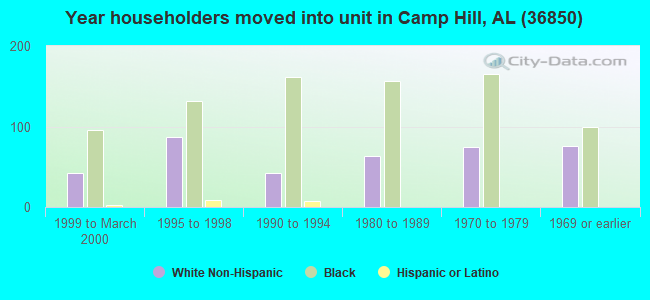
Length of stay since moving in significantly above state average.
Number of college students below state average.
Percentage of population with a bachelor's degree or higher significantly below state average.
Estimated median house/condo value in 2022: $70,998
36850:
$70,998
Alabama:
$200,900
According to our research of Alabama and other state lists, there were 7 registered sex offenders living in 36850 zip code as of June 15, 2024. The ratio of all residents to sex offenders in zip code 36850 is 365 to 1. The ratio of registered sex offenders to all residents in this zip code is near the state average.
Median resident age:
This zip code:
48.2 years
Alabama median age:
39.6 years
Average household size:
This zip code:
2.4 people
Alabama:
2.5 people
Averages for the 2020 tax year for zip code 36850, filed in 2021:
Average Adjusted Gross Income (AGI) in 2020: $39,260 (Individual Income Tax Returns)
Here:
$39,260
State:
$63,984
Salary/wage: $34,145 (reported on 82.7% of returns)
Here:
$34,145
State:
$52,834
(% of AGI for various income ranges: 1287.6% for AGIs below $25k, 3740.7% for AGIs $25k-50k, 6622.5% for AGIs $50k-75k, 10633.3% for AGIs $75k-100k, 19300.0% for AGIs $100k-200k)
Taxable interest for individuals: $688 (reported on 15.5% of returns)
This zip code:
$688
Alabama:
$1,615
(% of AGI for various income ranges: 11.9% for AGIs below $25k, 15.2% for AGIs $25k-50k, 16.2% for AGIs $50k-75k, 47.5% for AGIs $100k-200k)
Ordinary dividends: $1,250 (reported on 5.5% of returns)
Here:
$1,250
State:
$7,660
(% of AGI for various income ranges: 11.5% for AGIs $25k-50k, 146.7% for AGIs $75k-100k)
Net capital gain/loss in AGI: +$3,367 (reported on 5.5% of returns)
Here:
+$3,367
State:
+$23,528
(% of AGI for various income ranges: 17.4% for AGIs $25k-50k, 516.7% for AGIs $75k-100k)
Profit/loss from business: +$1,385 (reported on 11.8% of returns)
Here:
+$1,385
State:
+$9,534
(% of AGI for various income ranges: 58.6% for AGIs below $25k, 9.3% for AGIs $25k-50k)
Taxable individual retirement arrangement distribution: $7,067 (reported on 2.7% of returns)
36850:
$7,067
Alabama:
$19,004
(% of AGI for various income ranges: 57.3% for AGIs below $25k)
Total itemized deductions: $28,225 (reported on 3.6% of returns)
Here:
$28,225
State:
$37,338
(% of AGI for various income ranges: 3763.3% for AGIs $75k-100k)
Charity contributions: $11,800 (reported on 3.6% of returns)
Here:
$11,800
State:
$18,005
(% of AGI for various income ranges: 1573.3% for AGIs $75k-100k)
Taxes paid: $5,550 (reported on 3.6% of returns)
36850:
$5,550
State:
$6,484
(% of AGI for various income ranges: 740.0% for AGIs $75k-100k)
Earned income credit: $2,741 (reported on 33.6% of returns)
Here:
$2,741
State:
$2,628
(% of AGI for various income ranges: 191.1% for AGIs below $25k, 113.7% for AGIs $25k-50k)
Percentage of individuals using paid preparers for their 2020 taxes: 90.0%
Here:
90%
State:
93%
(% for various income ranges: 90.0% for AGIs below $25k, 88.9% for AGIs $25k-50k, 90.9% for AGIs $50k-75k, 100.0% for AGIs $75k-100k, 87.5% for AGIs $100k-200k)
Averages for the 2012 tax year for zip code 36850, filed in 2013:
Average Adjusted Gross Income (AGI) in 2012: $29,054 (Individual Income Tax Returns)
Here:
$29,054
State:
$52,001
Salary/wage: $26,622 (reported on 86.5% of returns)
Here:
$26,622
State:
$43,822
(% of AGI for various income ranges: 83.7% for AGIs below $25k, 81.7% for AGIs $25k-50k, 77.2% for AGIs $50k-75k, 140.5% for AGIs $75k-100k)
Taxable interest for individuals: $1,088 (reported on 14.4% of returns)
This zip code:
$1,088
Alabama:
$1,592
(% of AGI for various income ranges: 0.2% for AGIs below $25k, 0.7% for AGIs $25k-50k, 0.5% for AGIs $50k-75k, 1.3% for AGIs $75k-100k)
Ordinary dividends: $1,220 (reported on 4.5% of returns)
Here:
$1,220
State:
$5,697
Net capital gain/loss in AGI: +$250 (reported on 3.6% of returns)
Here:
+$250
State:
+$13,286
Profit/loss from business: +$877 (reported on 11.7% of returns)
Here:
+$877
State:
+$9,151
Taxable individual retirement arrangement distribution: $7,760 (reported on 4.5% of returns)
36850:
$7,760
Alabama:
$14,992
(% of AGI for various income ranges: 1.0% for AGIs below $25k, 2.8% for AGIs $25k-50k)
Total itemized deductions: $16,426 (34% of AGI, reported on 17.1% of returns)
Here:
$16,426
State:
$21,388
Here:
33.9% of AGI
State:
20.1% of AGI
(% of AGI for various income ranges: 5.0% for AGIs below $25k, 11.1% for AGIs $25k-50k, 12.3% for AGIs $50k-75k, 21.9% for AGIs $75k-100k)
Charity contributions: $4,718 (reported on 15.3% of returns)
Here:
$4,718
State:
$5,925
(% of AGI for various income ranges: 0.9% for AGIs below $25k, 3.1% for AGIs $25k-50k, 3.6% for AGIs $50k-75k, 5.4% for AGIs $75k-100k)
Taxes paid: $2,622 (reported on 16.2% of returns)
36850:
$2,622
State:
$5,272
(% of AGI for various income ranges: 0.5% for AGIs below $25k, 1.3% for AGIs $25k-50k, 2.3% for AGIs $50k-75k, 4.5% for AGIs $75k-100k)
Earned income credit: $2,650 (reported on 41.4% of returns)
Here:
$2,650
State:
$2,646
(% of AGI for various income ranges: 11.6% for AGIs below $25k, 1.8% for AGIs $25k-50k)
Percentage of individuals using paid preparers for their 2012 taxes: 68.5%
Here:
68%
State:
60%
(% for various income ranges: 68.3% for AGIs below $25k, 71.0% for AGIs $25k-50k, 70.0% for AGIs $50k-75k, 100.0% for AGIs $75k-100k)
Averages for the 2004 tax year for zip code 36850, filed in 2005:
Average Adjusted Gross Income (AGI) in 2004: $25,170 (Individual Income Tax Returns)
Here:
$25,170
State:
$42,302
Salary/wage: $24,226 (reported on 89.7% of returns)
Here:
$24,226
State:
$36,626
(% of AGI for various income ranges: 106.0% for AGIs below $10k, 90.2% for AGIs $10k-25k, 89.9% for AGIs $25k-50k, 84.3% for AGIs $50k-75k, 76.5% for AGIs $75k-100k, 59.1% for AGIs over 100k)
Taxable interest for individuals: $1,015 (reported on 17.4% of returns)
This zip code:
$1,015
Alabama:
$1,827
(% of AGI for various income ranges: 1.5% for AGIs below $10k, 0.8% for AGIs $10k-25k, 0.4% for AGIs $25k-50k, 0.6% for AGIs $50k-75k, 0.8% for AGIs $75k-100k, 1.4% for AGIs over 100k)
Taxable dividends: $1,691 (reported on 4.8% of returns)
Here:
$1,691
State:
$4,206
(% of AGI for various income ranges: 1.4% for AGIs below $10k, 0.0% for AGIs $25k-50k, 0.6% for AGIs $50k-75k, 1.8% for AGIs $75k-100k)
Net capital gain/loss: +$6,500 (reported on 2.9% of returns)
Here:
+$6,500
State:
+$13,031
Profit/loss from business: +$812 (reported on 9.7% of returns)
Here:
+$812
State:
+$8,302
(% of AGI for various income ranges: -1.9% for AGIs below $10k, 1.4% for AGIs $10k-25k, -0.5% for AGIs $25k-50k, 1.1% for AGIs $50k-75k)
Total itemized deductions: $14,626 (29% of AGI, reported on 15.1% of returns)
Here:
$14,626
State:
$17,623
Here:
29.3% of AGI
State:
20.8% of AGI
(% of AGI for various income ranges: 4.7% for AGIs $10k-25k, 10.0% for AGIs $25k-50k, 9.2% for AGIs $50k-75k, 12.7% for AGIs $75k-100k, 16.6% for AGIs over 100k)
Charity contributions deductions: $3,766 (7% of AGI, reported on 13.7% of returns)
Here:
$3,766
State:
$4,768
Here:
7.4% of AGI
State:
5.4% of AGI
(% of AGI for various income ranges: 0.7% for AGIs $10k-25k, 2.1% for AGIs $25k-50k, 1.7% for AGIs $50k-75k, 4.7% for AGIs $75k-100k, 5.6% for AGIs over 100k)
Total tax: $2,722 (reported on 55.6% of returns)
36850:
$2,722
State:
$6,905
(% of AGI for various income ranges: 2.6% for AGIs below $10k, 2.3% for AGIs $10k-25k, 5.1% for AGIs $25k-50k, 8.8% for AGIs $50k-75k, 10.6% for AGIs $75k-100k, 14.6% for AGIs over 100k)
Earned income credit: $2,111 (reported on 43.8% of returns)
Here:
$2,111
State:
$2,048
Percentage of individuals using paid preparers for their 2004 taxes: 61.2%
Here:
61%
State:
65%
(% for various income ranges: 58.4% for AGIs below $10k, 61.5% for AGIs $10k-25k, 63.5% for AGIs $25k-50k, 60.2% for AGIs $50k-75k, 55.2% for AGIs $75k-100k, 68.8% for AGIs over 100k)
Likely homosexual households (counted as self-reported same-sex unmarried-partner households)
Lesbian couples: 1.2% of all households
Gay men: 0.0% of all households
Household received Food Stamps/SNAP in the past 12 months: 237 Household did not receive Food Stamps/SNAP in the past 12 months: 923
Women who had a birth in the past 12 months: 35 (0 now married, 28 unmarried) Women who did not have a birth in the past 12 months: 531 (132 now married, 399 unmarried)
Housing units in zip code 36850 with a mortgage: 290 Median monthly owner costs for units with a mortgage: $810 Median monthly owner costs for units without a mortgage: $410
Residents with income below the poverty level in 2022:
This zip code:
24.4%
Whole state:
16.2%
Residents with income below 50% of the poverty level in 2022:
This zip code:
13.9%
Whole state:
8.6%
Median number of rooms in houses and condos:
Here:
5.8
State:
6.5
Median number of rooms in apartments:
Here:
5.0
State:
4.7
Notable locations in this zip code not listed on our city pages
Churches in zip code 36850 include: Mount Zion Church (A), New Harmony Church (B), New Hope Church (C), Ozias Church (D), Pleasant View Church (E), Sougahatchee Church (F), Hills Chapel Church (G), First Universalist Church (H), First Methodist Episcopal Church (I). Display/hide their locations on the map
Cemeteries: Antioch Cemetery (1), Langley Cemetery (2), Roxanna Cemetery (3), Roxana Cemetery (4), Dudleyville Cemetery (5), Tallapoosa County Memorial Gardens (6), Sanders Cemetery (7). Display/hide their locations on the map
Streams, rivers, and creeks: Still Branch (A), North Branch Blue Creek (B), Chatahospee Creek (C), Mitchell Creek (D), Murphy Gin Branch (E), Sycamore Creek (F), Little Sandy Creek (G), Hunter Creek (H), McCowan Creek (I). Display/hide their locations on the map
In group quarters: 45 (-1 institutionalized population)
Size of family households: 450 2-persons, 155 3-persons, 58 4-persons, 71 5-persons, 4 7-or-more-persons
Size of nonfamily households: 382 1-person, 33 2-persons
181 married couples with children.
285 single-parent households (28 men, 257 women).
97.7% of residents of 36850 zip code speak English at home.
2.0% of residents speak Spanish at home (57% very well, 8% well, 36% not well).
0.2% of residents speak Asian or Pacific Island language at home (100% very well).
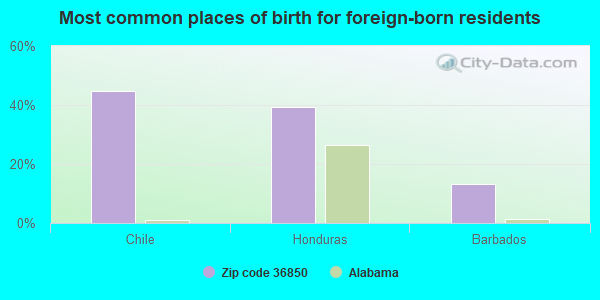
Foreign born population: 40 (1.5%) (86.7% of them are naturalized citizens)
This zip code:
1.5%
Whole state:
3.8%
45%Chile
39%Honduras
13%Barbados
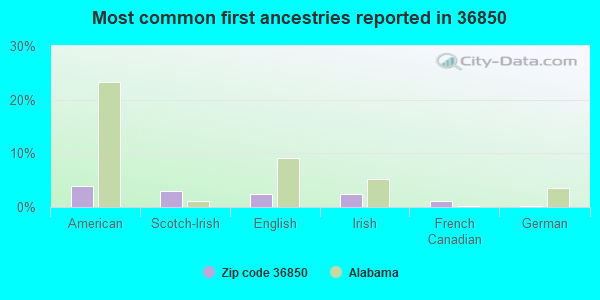
4%American
3%Scotch-Irish
3%English
2%Irish
1%French Canadian
0%German
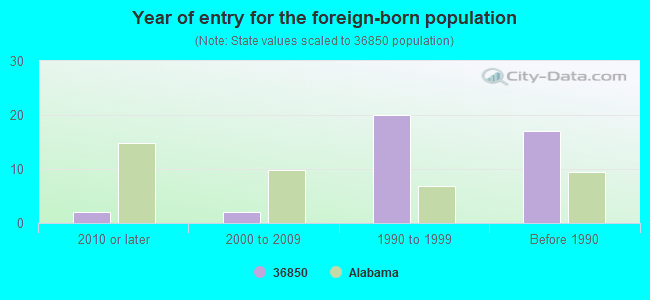
Year of entry for the foreign-born population
22010 or later
22000 to 2009
201990 to 1999
17Before 1990
Facilities with environmental interests located in this zip code:
PIEDMONT EXPERIMENT SUBSTATION CAMPHILL (1399 N MAIN ST in CAMPHILL, AL)
(Resource Conservation and Recovery Act (tracking hazardous waste)) Business NAICS classification: HAZARDOUS WASTE COLLECTION.; HAZARDOUS WASTE COLLECTION. Organizations: ALABAMA DEPT OF NATURAL RESC (CONTACT/OPERATOR)
, AUBURN UNIVERSITY (CONTACT/OWNER)
ALABAMA SHERIFF GIRLS RANCH (BPW UNIT in CAMP HILL, AL)
National Pollutant Discharge Elimination System NON-MAJOR (Tracking pollutant discharge elimination systems) - permit Business SIC classification: SEWERAGE SYSTEMS Organizations: ALABAMA SHERRIFFS GIRLS RANCH (CONTACT/OWNER)
Alternative names: AL SHERIFFS GIRLS RCH BPW UNIT
CAMP HILL WASTEWATER TRMT PLT (CAMP HILL TOWN OF in CAMP HILL, AL)
National Pollutant Discharge Elimination System NON-MAJOR (Tracking pollutant discharge elimination systems) - permit Business SIC classification: SEWERAGE SYSTEMS Organizations: CAMP HILL TOWN OF (CONTACT/OWNER)
Alternative names: CAMP HILL TOWN OF, CAMP HILL TOWN OF WWT LAGOON
ADOT NHF 0038 506 (ALABAMA DEPARTMENT OF TRANSPOR in CAMPHILL, AL)
National Pollutant Discharge Elimination System NON-MAJOR (Tracking pollutant discharge elimination systems) - permit Business SIC classification: HIGHWAY AND STREET CONSTRUCTION, EXCEPT ELEVATED HIGHWAYS Alternative names: ALDOT NHF 0038 506
CAMP HILL WASTE AREA ONE (W S NEWELL AND SONS INCORP in CAMP HILL, AL)
National Pollutant Discharge Elimination System NON-MAJOR (Tracking pollutant discharge elimination systems) - permit Business SIC classification: HEAVY CONSTRUCTION Alternative names: W S NEWELL SONS CAMP HILL WAST
CAMP HILL DRUM SITE (HIGHWAY 280 in CAMP HILL, AL)
SUPERFUND (Superfund database)
Housing units lacking complete plumbing facilities: 8.0% Housing units lacking complete kitchen facilities: 5.8%
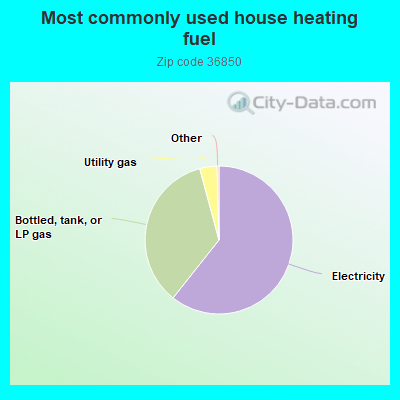
60.8%Electricity
35.2%Bottled, tank, or LP gas
3.8%Utility gas
Population in 1990: 2,422. Population change in the 1990s: +551 (+22.7%).
Place of birth for U.S.-born residents:
This state: 2,425
Northeast: 32
Midwest: 15
South: 168
West: 44
69% of the 36850 zip code residents lived in the same house 5 years ago. Out of people who lived in different houses, 60% lived in this county. Out of people who lived in different counties, 50% lived in Alabama.
98% of the 36850 zip code residents lived in the same house 1 year ago. Out of people who lived in different houses, 69% moved from this county. Out of people who lived in different houses, 20% moved from different county within same state. Out of people who lived in different houses, 2% moved from different state. Out of people who lived in different houses, 13% moved from abroad.
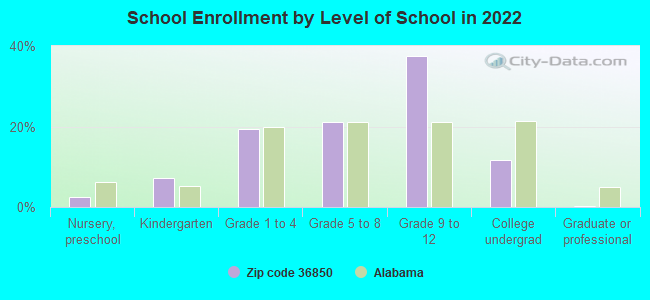
Private vs. public school enrollment:
Students in private schools in grades 1 to 8 (elementary and middle school): 35
Here:
13.7%
Alabama:
14.7%
Students in private schools in grades 9 to 12 (high school): 25
Here:
11.0%
Alabama:
16.3%
Students in private undergraduate colleges: 20
Here:
28.5%
Alabama:
14.6%
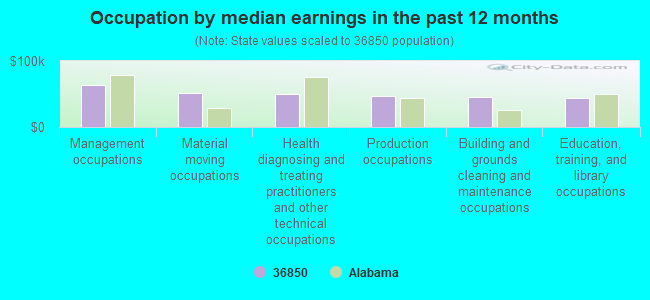
Occupation by median earnings in the past 12 months ($)
64,368Management occupations
51,988Material moving occupations
50,664Health diagnosing and treating practitioners and other technical occupations
46,408Production occupations
45,150Building and grounds cleaning and maintenance occupations
43,702Education, training, and library occupations
Top industries in this zip code by the number of employees in 2005:
Educational Services: Elementary and Secondary Schools (50-99 employees: 1 establishment)
Health Care and Social Assistance: Other Residential Care Facilities (10-19: 1)
Construction: Masonry Contractors (5-9: 1)
Accommodation and Food Services: Limited-Service Restaurants (5-9: 1)
Construction: New Single-Family Housing Construction (except Operative Builders) (1-4: 2)
Other Services (except Public Administration): Religious Organizations (1-4: 2)
People in group quarters in 2010:
9 people in group homes for juveniles (non-correctional)
6 people in workers' group living quarters and job corps centers
People in group quarters in 2000:
15 people in short-term care, detention or diagnostic centers for delinquent children
Fatal accident statistics in 2014:
Fatal accident count: 1
Vehicles involved in fatal accidents: 1
Fatal accidents caused by drunken drivers: 0
Fatalities: 1
Persons involved in fatal accidents: 4
Pedestrians involved in fatal accidents: 0
Fatal accident statistics in 2013:
Fatal accident count: 1
Vehicles involved in fatal accidents: 1
Fatal accidents caused by drunken drivers: 1
Fatalities: 1
Persons involved in fatal accidents: 1
Pedestrians involved in fatal accidents: 0
Home Mortgage Disclosure Act Aggregated Statistics For Year 2009 (Based on 1 partial tract)
A) FHA, FSA/RHS & VA Home Purchase Loans
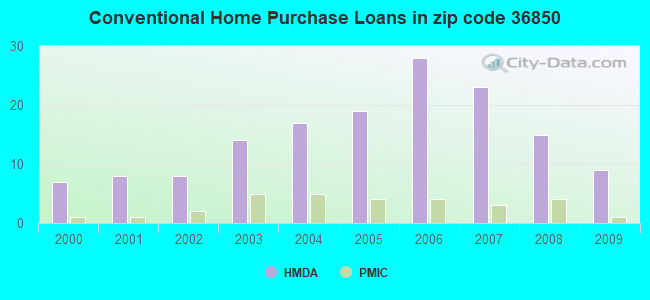
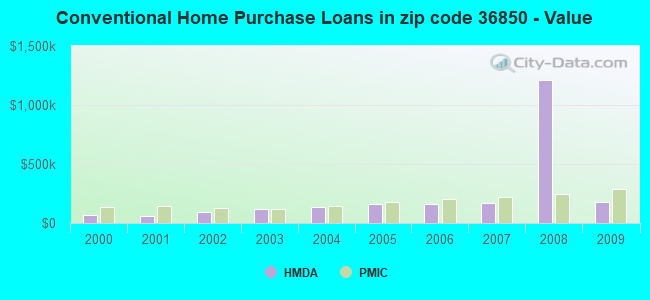
B) Conventional Home Purchase Loans
C) Refinancings
D) Home Improvement Loans
F) Non-occupant Loans on < 5 Family Dwellings (A B C & D)
G) Loans On Manufactured Home Dwelling (A B C & D)
Number
Average Value
Number
Average Value
Number
Average Value
Number
Average Value
Number
Average Value
Number
Average Value
LOANS ORIGINATED
4
$191,998
9
$177,191
22
$224,305
2
$95,780
2
$233,625
3
$37,927
APPLICATIONS APPROVED, NOT ACCEPTED
0
$0
0
$0
0
$0
0
$0
0
$0
0
$0
APPLICATIONS DENIED
1
$87,300
1
$51,090
6
$194,968
1
$26,580
0
$0
1
$44,420
APPLICATIONS WITHDRAWN
0
$0
1
$176,900
4
$238,245
0
$0
0
$0
0
$0
FILES CLOSED FOR INCOMPLETENESS
0
$0
0
$0
1
$315,180
0
$0
0
$0
0
$0
Aggregated Statistics For Year 2008 (Based on 1 partial tract)
A) FHA, FSA/RHS & VA Home Purchase Loans
B) Conventional Home Purchase Loans
C) Refinancings
D) Home Improvement Loans
F) Non-occupant Loans on < 5 Family Dwellings (A B C & D)
G) Loans On Manufactured Home Dwelling (A B C & D)
Number
Average Value
Number
Average Value
Number
Average Value
Number
Average Value
Number
Average Value
Number
Average Value
LOANS ORIGINATED
4
$184,668
15
$1,207,739
13
$2,257,292
2
$56,780
4
$735,250
4
$6,094,865
APPLICATIONS APPROVED, NOT ACCEPTED
0
$0
1
$114,650
1
$202,060
0
$0
0
$0
0
$0
APPLICATIONS DENIED
1
$86,640
1
$119,250
5
$177,644
2
$79,535
1
$102,070
1
$63,120
APPLICATIONS WITHDRAWN
1
$122,090
2
$155,185
3
$162,570
0
$0
0
$0
0
$0
FILES CLOSED FOR INCOMPLETENESS
0
$0
0
$0
1
$207,750
0
$0
0
$0
0
$0
Aggregated Statistics For Year 2007 (Based on 1 partial tract)
A) FHA, FSA/RHS & VA Home Purchase Loans
B) Conventional Home Purchase Loans
C) Refinancings
D) Home Improvement Loans
F) Non-occupant Loans on < 5 Family Dwellings (A B C & D)
G) Loans On Manufactured Home Dwelling (A B C & D)
Number
Average Value
Number
Average Value
Number
Average Value
Number
Average Value
Number
Average Value
Number
Average Value
LOANS ORIGINATED
1
$125,370
23
$167,739
10
$143,730
1
$39,380
5
$113,250
5
$31,682
APPLICATIONS APPROVED, NOT ACCEPTED
0
$0
1
$152,280
1
$120,780
0
$0
0
$0
0
$0
APPLICATIONS DENIED
0
$0
2
$141,620
6
$124,205
1
$67,720
1
$171,760
1
$39,930
APPLICATIONS WITHDRAWN
0
$0
2
$167,820
2
$163,715
0
$0
0
$0
0
$0
FILES CLOSED FOR INCOMPLETENESS
0
$0
0
$0
0
$0
0
$0
0
$0
0
$0
Aggregated Statistics For Year 2006 (Based on 1 partial tract)
A) FHA, FSA/RHS & VA Home Purchase Loans
B) Conventional Home Purchase Loans
C) Refinancings
D) Home Improvement Loans
F) Non-occupant Loans on < 5 Family Dwellings (A B C & D)
G) Loans On Manufactured Home Dwelling (A B C & D)
Number
Average Value
Number
Average Value
Number
Average Value
Number
Average Value
Number
Average Value
Number
Average Value
LOANS ORIGINATED
1
$123,730
28
$158,708
9
$171,320
1
$47,810
8
$114,131
4
$33,668
APPLICATIONS APPROVED, NOT ACCEPTED
0
$0
4
$142,712
1
$113,120
0
$0
2
$153,435
0
$0
APPLICATIONS DENIED
0
$0
2
$153,325
5
$157,624
2
$44,250
0
$0
1
$67,170
APPLICATIONS WITHDRAWN
0
$0
2
$135,655
3
$180,873
0
$0
1
$58,310
1
$67,830
FILES CLOSED FOR INCOMPLETENESS
0
$0
0
$0
1
$146,270
0
$0
0
$0
0
$0
Aggregated Statistics For Year 2005 (Based on 1 partial tract)
B) Conventional Home Purchase Loans
C) Refinancings
D) Home Improvement Loans
F) Non-occupant Loans on < 5 Family Dwellings (A B C & D)
G) Loans On Manufactured Home Dwelling (A B C & D)
Number
Average Value
Number
Average Value
Number
Average Value
Number
Average Value
Number
Average Value
LOANS ORIGINATED
19
$159,476
9
$153,087
2
$100,265
5
$87,804
3
$21,917
APPLICATIONS APPROVED, NOT ACCEPTED
1
$62,030
1
$193,530
0
$0
0
$0
0
$0
APPLICATIONS DENIED
2
$82,325
4
$134,370
2
$30,905
0
$0
1
$53,610
APPLICATIONS WITHDRAWN
2
$170,170
4
$149,988
1
$83,580
0
$0
1
$57,870
FILES CLOSED FOR INCOMPLETENESS
0
$0
1
$143,100
0
$0
0
$0
0
$0
Aggregated Statistics For Year 2004 (Based on 1 partial tract)
B) Conventional Home Purchase Loans
C) Refinancings
D) Home Improvement Loans
F) Non-occupant Loans on < 5 Family Dwellings (A B C & D)
G) Loans On Manufactured Home Dwelling (A B C & D)
Number
Average Value
Number
Average Value
Number
Average Value
Number
Average Value
Number
Average Value
LOANS ORIGINATED
17
$139,524
7
$140,891
1
$38,180
5
$108,152
2
$28,060
APPLICATIONS APPROVED, NOT ACCEPTED
1
$263,760
1
$143,100
1
$14,330
0
$0
0
$0
APPLICATIONS DENIED
2
$166,180
4
$95,232
1
$10,170
0
$0
1
$57,650
APPLICATIONS WITHDRAWN
2
$112,735
2
$132,810
0
$0
0
$0
1
$31,510
FILES CLOSED FOR INCOMPLETENESS
0
$0
1
$154,910
0
$0
0
$0
0
$0
Aggregated Statistics For Year 2003 (Based on 1 partial tract)
B) Conventional Home Purchase Loans
C) Refinancings
D) Home Improvement Loans
F) Non-occupant Loans on < 5 Family Dwellings (A B C & D)
Number
Average Value
Number
Average Value
Number
Average Value
Number
Average Value
LOANS ORIGINATED
14
$115,753
14
$124,388
0
$0
5
$80,716
APPLICATIONS APPROVED, NOT ACCEPTED
1
$112,900
1
$106,770
0
$0
0
$0
APPLICATIONS DENIED
3
$31,727
3
$104,367
1
$5,250
1
$24,400
APPLICATIONS WITHDRAWN
0
$0
3
$74,647
0
$0
0
$0
FILES CLOSED FOR INCOMPLETENESS
0
$0
1
$73,410
0
$0
0
$0
Aggregated Statistics For Year 2002 (Based on 1 partial tract)
B) Conventional Home Purchase Loans
C) Refinancings
D) Home Improvement Loans
F) Non-occupant Loans on < 5 Family Dwellings (A B C & D)
Number
Average Value
Number
Average Value
Number
Average Value
Number
Average Value
LOANS ORIGINATED
8
$93,538
6
$120,632
2
$30,360
2
$67,115
APPLICATIONS APPROVED, NOT ACCEPTED
1
$77,350
0
$0
0
$0
0
$0
APPLICATIONS DENIED
4
$42,282
2
$74,940
0
$0
0
$0
APPLICATIONS WITHDRAWN
0
$0
1
$142,880
0
$0
0
$0
FILES CLOSED FOR INCOMPLETENESS
0
$0
1
$90,150
0
$0
0
$0
Aggregated Statistics For Year 2001 (Based on 1 partial tract)
A) FHA, FSA/RHS & VA Home Purchase Loans
B) Conventional Home Purchase Loans
C) Refinancings
D) Home Improvement Loans
F) Non-occupant Loans on < 5 Family Dwellings (A B C & D)
Number
Average Value
Number
Average Value
Number
Average Value
Number
Average Value
Number
Average Value
LOANS ORIGINATED
1
$53,280
8
$63,398
8
$121,160
1
$7,990
3
$73,190
APPLICATIONS APPROVED, NOT ACCEPTED
0
$0
2
$30,085
1
$25,600
0
$0
0
$0
APPLICATIONS DENIED
0
$0
6
$32,127
3
$97,693
1
$18,380
1
$37,850
APPLICATIONS WITHDRAWN
0
$0
0
$0
1
$127,450
0
$0
0
$0
FILES CLOSED FOR INCOMPLETENESS
0
$0
0
$0
0
$0
0
$0
0
$0
Aggregated Statistics For Year 2000 (Based on 1 partial tract)
B) Conventional Home Purchase Loans
C) Refinancings
D) Home Improvement Loans
F) Non-occupant Loans on < 5 Family Dwellings (A B C & D)
Detailed PMIC statistics for the following Tracts:0410.00
2003 - 2018 National Fire Incident Reporting System (NFIRS) incidents
According to the data from the years 2003 - 2018 the average number of fire incidents per year is 15. The highest number of reported fires - 38 took place in 2007, and the least - 3 in 2018. The data has a dropping trend.
When looking into fire subcategories, the most incidents belonged to: Outside Fires (51.2%), and Structure Fires (39.6%).
Fire incident types reported to NFIRS in Zip Code 36850


 Nearest zip codes: 36853, 36879, 36865, 36832, 36861, 36866.


 According to the data from the years 2003 - 2018 the average number of fire incidents per year is 15. The highest number of reported fires - 38 took place in 2007, and the least - 3 in 2018. The data has a dropping trend.
 When looking into fire subcategories, the most incidents belonged to: Outside Fires (51.2%), and Structure Fires (39.6%).