Estimated zip code population in 2022: 1,677 Zip code population in 2010: 1,174 Zip code population in 2000: 1,262
Houses and condos: 661 Renter-occupied apartments: 134
% of renters here:
23%
State:
33%
March 2022 cost of living index in zip code 38391: 78.8 (low, U.S. average is 100)
Land area: 61.6 sq. mi. Water area: 0.0 sq. mi.
Population density: 27 people per square mile
(very low).
OSM Map
General Map
Google Map
MSN Map
OSM Map
General Map
Google Map
MSN Map
OSM Map
General Map
Google Map
MSN Map
OSM Map
General Map
Google Map
MSN Map
Please wait while loading the map...
Real estate property taxes paid for housing units in 2022:
This zip code:
0.4% ($546)
Tennessee:
0.5% ($1,376)
Median real estate property taxes paid for housing units with mortgages in 2022: $619 (0.6%) Median real estate property taxes paid for housing units with no mortgage in 2022: $532 (0.4%)
Business Search- 14 Million verified businesses
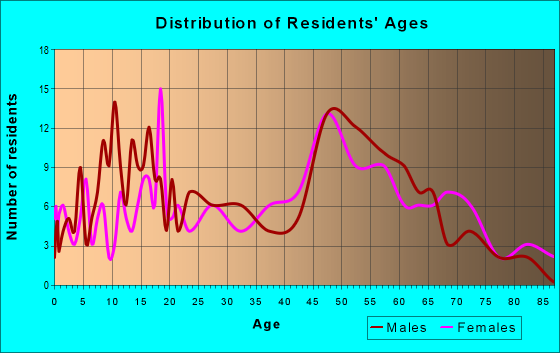
Males: 780
(46.6%)
Females: 896
(53.4%)
For population 25 years and over in 38391:
High school or higher: 88.9%
Bachelor's degree or higher: 8.5%
Graduate or professional degree: 4.3%
Unemployed: 5.3%
Mean travel time to work (commute): 23.0 minutes
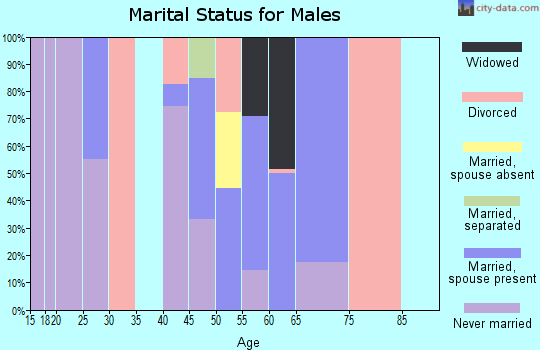
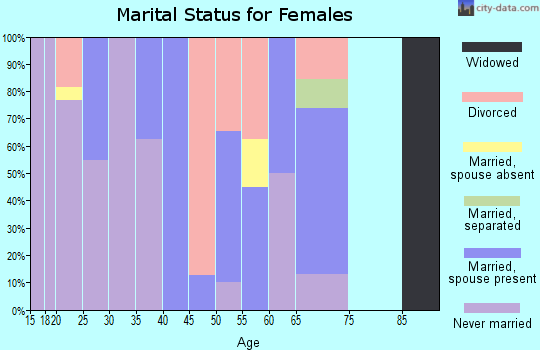
For population 15 years and over in 38391:
Never married: 37.6%
Now married: 38.1%
Separated: 2.2%
Widowed: 8.6%
Divorced: 13.5%
Zip code 38391 compared to state average:
Median house value significantly below state average.
Black race population percentage significantly above state average.
Hispanic race population percentage significantly below state average.
Median age significantly above state average.
Foreign-born population percentage significantly below state average.
Length of stay since moving in significantly above state average.
Percentage of population with a bachelor's degree or higher significantly below state average.
Averages for the 2020 tax year for zip code 38391, filed in 2021:
Average Adjusted Gross Income (AGI) in 2020: $40,892 (Individual Income Tax Returns)
Here:
$40,892
State:
$69,014
Salary/wage: $35,630 (reported on 88.5% of returns)
Here:
$35,630
State:
$55,872
(% of AGI for various income ranges: 1272.7% for AGIs below $25k, 3821.2% for AGIs $25k-50k, 6795.0% for AGIs $50k-75k, 8520.0% for AGIs $75k-100k, 22725.0% for AGIs $100k-200k)
Taxable interest for individuals: $580 (reported on 16.4% of returns)
This zip code:
$580
Tennessee:
$1,945
(% of AGI for various income ranges: 7.7% for AGIs below $25k, 55.0% for AGIs $50k-75k, 40.0% for AGIs $100k-200k)
Ordinary dividends: $1,667 (reported on 4.9% of returns)
Here:
$1,667
State:
$8,105
(% of AGI for various income ranges: 83.3% for AGIs $50k-75k)
Net capital gain/loss in AGI: +$1,633 (reported on 4.9% of returns)
Here:
+$1,633
State:
+$33,664
(% of AGI for various income ranges: 30.6% for AGIs $25k-50k)
Profit/loss from business: +$6,157 (reported on 11.5% of returns)
Here:
+$6,157
State:
+$18,991
(% of AGI for various income ranges: 49.5% for AGIs below $25k, 588.3% for AGIs $50k-75k)
Taxable individual retirement arrangement distribution: $9,967 (reported on 4.9% of returns)
38391:
$9,967
Tennessee:
$20,036
(% of AGI for various income ranges: 186.9% for AGIs $25k-50k)
Total itemized deductions: $30,750 (reported on 3.3% of returns)
Here:
$30,750
State:
$40,136
(% of AGI for various income ranges: 384.4% for AGIs $25k-50k)
Earned income credit: $2,365 (reported on 27.9% of returns)
Here:
$2,365
State:
$2,391
(% of AGI for various income ranges: 121.8% for AGIs below $25k, 83.8% for AGIs $25k-50k)
Percentage of individuals using paid preparers for their 2020 taxes: 93.4%
Here:
93%
State:
93%
(% for various income ranges: 96.2% for AGIs below $25k, 94.7% for AGIs $25k-50k, 87.5% for AGIs $50k-75k, 100.0% for AGIs $75k-100k, 80.0% for AGIs $100k-200k)
Averages for the 2012 tax year for zip code 38391, filed in 2013:
Average Adjusted Gross Income (AGI) in 2012: $35,123 (Individual Income Tax Returns)
Here:
$35,123
State:
$53,767
Salary/wage: $30,186 (reported on 89.3% of returns)
Here:
$30,186
State:
$45,421
(% of AGI for various income ranges: 79.7% for AGIs below $25k, 91.5% for AGIs $25k-50k, 82.5% for AGIs $50k-75k, 78.7% for AGIs $75k-100k, 49.9% for AGIs $100k-200k)
Taxable interest for individuals: $400 (reported on 12.5% of returns)
This zip code:
$400
Tennessee:
$1,732
Ordinary dividends: $700 (reported on 3.6% of returns)
Here:
$700
State:
$6,739
Profit/loss from business: +$4,057 (reported on 12.5% of returns)
Here:
+$4,057
State:
+$15,240
Taxable individual retirement arrangement distribution: $15,800 (reported on 3.6% of returns)
38391:
$15,800
Tennessee:
$15,505
Total itemized deductions: $17,056 (23% of AGI, reported on 16.1% of returns)
Here:
$17,056
State:
$21,976
Here:
23.2% of AGI
State:
17.8% of AGI
(% of AGI for various income ranges: 8.5% for AGIs $25k-50k, 15.8% for AGIs $50k-75k, 11.5% for AGIs $100k-200k)
Charity contributions: $6,175 (reported on 14.3% of returns)
Here:
$6,175
State:
$6,709
Taxes paid: $2,562 (reported on 14.3% of returns)
38391:
$2,562
State:
$4,829
Earned income credit: $2,276 (reported on 37.5% of returns)
Here:
$2,276
State:
$2,404
(% of AGI for various income ranges: 10.2% for AGIs below $25k, 1.4% for AGIs $25k-50k)
Percentage of individuals using paid preparers for their 2012 taxes: 55.4%
Here:
55%
State:
52%
(% for various income ranges: 51.7% for AGIs below $25k, 52.9% for AGIs $25k-50k, 100.0% for AGIs $50k-75k, 66.7% for AGIs $100k-200k)
Averages for the 2004 tax year for zip code 38391, filed in 2005:
Average Adjusted Gross Income (AGI) in 2004: $27,208 (Individual Income Tax Returns)
Here:
$27,208
State:
$44,088
Salary/wage: $25,228 (reported on 93.6% of returns)
Here:
$25,228
State:
$38,825
(% of AGI for various income ranges: 94.1% for AGIs below $10k, 90.2% for AGIs $10k-25k, 91.8% for AGIs $25k-50k, 88.3% for AGIs $50k-75k, 77.8% for AGIs $75k-100k, 59.4% for AGIs over 100k)
Taxable interest for individuals: $402 (reported on 16.0% of returns)
This zip code:
$402
Tennessee:
$1,802
(% of AGI for various income ranges: 0.4% for AGIs $10k-25k, 0.1% for AGIs $25k-50k, 0.4% for AGIs $50k-75k, 0.2% for AGIs $75k-100k)
Taxable dividends: $718 (reported on 6.4% of returns)
Here:
$718
State:
$3,727
Net capital gain/loss: +$524 (reported on 3.5% of returns)
Here:
+$524
State:
+$15,776
Profit/loss from business: +$1,646 (reported on 7.9% of returns)
Here:
+$1,646
State:
+$12,882
Profit/loss from farming: +$500 (reported on 3.3% of returns)
Here:
+$500
State:
-$6,038
Total itemized deductions: $14,432 (26% of AGI, reported on 15.7% of returns)
Here:
$14,432
State:
$18,035
Here:
26.4% of AGI
State:
19.9% of AGI
Charity contributions deductions: $4,905 (9% of AGI, reported on 13.9% of returns)
Here:
$4,905
State:
$5,167
Here:
9.1% of AGI
State:
5.3% of AGI
Total tax: $2,983 (reported on 59.8% of returns)
38391:
$2,983
State:
$7,482
(% of AGI for various income ranges: 2.0% for AGIs below $10k, 2.6% for AGIs $10k-25k, 5.8% for AGIs $25k-50k, 8.0% for AGIs $50k-75k, 10.7% for AGIs $75k-100k, 14.1% for AGIs over 100k)
Earned income credit: $1,929 (reported on 34.7% of returns)
Here:
$1,929
State:
$1,826
Percentage of individuals using paid preparers for their 2004 taxes: 63.0%
Here:
63%
State:
60%
(% for various income ranges: 56.9% for AGIs below $10k, 64.9% for AGIs $10k-25k, 63.3% for AGIs $25k-50k, 75.0% for AGIs $50k-75k, 89.5% for AGIs $75k-100k)
Household received Food Stamps/SNAP in the past 12 months: 190 Household did not receive Food Stamps/SNAP in the past 12 months: 382
Women who had a birth in the past 12 months: 16 (0 now married, 16 unmarried) Women who did not have a birth in the past 12 months: 327 (123 now married, 204 unmarried)
Housing units in zip code 38391 with a mortgage: 209 Median monthly owner costs for units with a mortgage: $1,089 Median monthly owner costs for units without a mortgage: $515
Residents with income below the poverty level in 2022:
This zip code:
3.1%
Whole state:
13.3%
Residents with income below 50% of the poverty level in 2022:
This zip code:
2.4%
Whole state:
7.1%
Median number of rooms in houses and condos:
Here:
5.9
State:
6.5
Median number of rooms in apartments:
Here:
6.1
State:
4.4
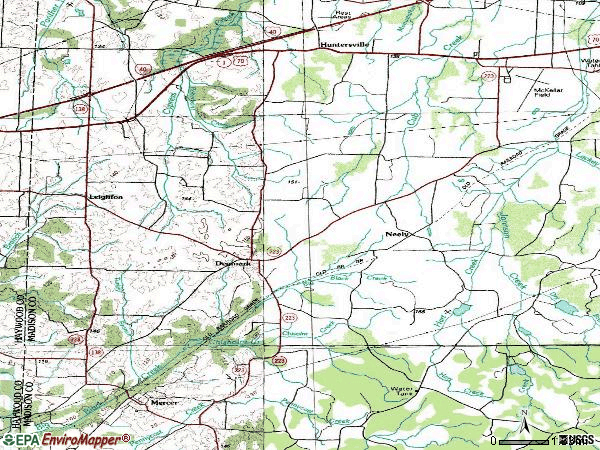
Notable locations in this zip code not listed on our city pages
Notable locations in zip code 38391: Camp Bonson (A), Madison County Fire Department Station 3 (B), Madison County Fire Department Station 16 (C). Display/hide their locations on the map
Churches in zip code 38391 include: Saint Johns Church (A), Denmark Presbyterian Church (B), Mount Olive Church (C). Display/hide their locations on the map
Cemeteries: Shady Grove Cemetery (1), Lane Chapel Cemetery (2), Bond Cemetery (3), Hawkins Cemetery (4), Springfield Cemetery (5). Display/hide their locations on the map
WEST MIDDLE SCHOOL (Location: 317 DENMARK RD, Grades: 6-8)
Facilities with environmental interests located in this zip code:
DENMARK ELEMENTARY SCHOOL (1945 DENMARK RD in DENMARK, TN)
(Geographic Names Information System) (National Center for Education Statistics) - STATE ID-0021 Organizations: JACKSON-MADISON CONSOLIDATED (SCHOOL DISTRICT)
Housing units lacking complete plumbing facilities: 7.3% Housing units lacking complete kitchen facilities: 2.3%
52.3%Bottled, tank, or LP gas
24.5%Utility gas
23.4%Electricity
Population in 1990: 1,760.
Place of birth for U.S.-born residents:
This state: 1,185
Northeast: 37
Midwest: 157
South: 271
West: 7
68% of the 38391 zip code residents lived in the same house 5 years ago. Out of people who lived in different houses, 59% lived in this county. Out of people who lived in different counties, 50% lived in Tennessee.
87% of the 38391 zip code residents lived in the same house 1 year ago. Out of people who lived in different houses, 47% moved from this county. Out of people who lived in different houses, 51% moved from different state.
Private vs. public school enrollment:
Students in private schools in grades 1 to 8 (elementary and middle school): 20
Here:
11.8%
Tennessee:
15.0%
Students in private schools in grades 9 to 12 (high school):
Here:
0.0%
Tennessee:
16.2%
Students in private undergraduate colleges:
Here:
0.0%
Tennessee:
23.5%
Occupation by median earnings in the past 12 months ($)
163,568Management occupations
27,974Production occupations
27,366Building and grounds cleaning and maintenance occupations
25,816Healthcare support occupations
16,094Education, training, and library occupations
Top industries in this zip code by the number of employees in 2005:
Other Services (except Public Administration): Religious Organizations (5-9 employees: 2 establishments, 1-4 employees: 1 establishment)
Health Care and Social Assistance: Child Day Care Services (5-9: 1)
Construction: Site Preparation Contractors (1-4: 2)
Accommodation and Food Services: Hotels (except Casino Hotels) and Motels (1-4: 1)
Health Care and Social Assistance: Services for the Elderly and Persons with Disabilities (1-4: 1)
Finance and Insurance: Mortgage and Nonmortgage Loan Brokers (1-4: 1)
Fatal accident statistics in 2012:
Fatal accident count: 2
Vehicles involved in fatal accidents: 2
Fatal accidents caused by drunken drivers: 2
Fatalities: 2
Persons involved in fatal accidents: 2
Pedestrians involved in fatal accidents: 0
Fatal accident statistics in 2011:
Fatal accident count: 1
Vehicles involved in fatal accidents: 1
Fatal accidents caused by drunken drivers: 1
Fatalities: 1
Persons involved in fatal accidents: 1
Pedestrians involved in fatal accidents: 1
Home Mortgage Disclosure Act Aggregated Statistics For Year 2009 (Based on 4 partial tracts)
A) FHA, FSA/RHS & VA Home Purchase Loans
B) Conventional Home Purchase Loans
C) Refinancings
D) Home Improvement Loans
F) Non-occupant Loans on < 5 Family Dwellings (A B C & D)
G) Loans On Manufactured Home Dwelling (A B C & D)
Number
Average Value
Number
Average Value
Number
Average Value
Number
Average Value
Number
Average Value
Number
Average Value
LOANS ORIGINATED
5
$113,728
6
$95,963
25
$136,601
4
$79,882
6
$104,148
3
$43,270
APPLICATIONS APPROVED, NOT ACCEPTED
0
$0
1
$91,650
2
$74,180
0
$0
0
$0
0
$0
APPLICATIONS DENIED
3
$112,663
2
$66,655
15
$106,171
2
$34,570
1
$75,120
2
$15,385
APPLICATIONS WITHDRAWN
1
$83,210
1
$67,610
10
$100,021
0
$0
0
$0
2
$73,245
FILES CLOSED FOR INCOMPLETENESS
0
$0
0
$0
1
$239,210
0
$0
0
$0
0
$0
Aggregated Statistics For Year 2008 (Based on 4 partial tracts)
A) FHA, FSA/RHS & VA Home Purchase Loans
B) Conventional Home Purchase Loans
C) Refinancings
D) Home Improvement Loans
F) Non-occupant Loans on < 5 Family Dwellings (A B C & D)
G) Loans On Manufactured Home Dwelling (A B C & D)
Number
Average Value
Number
Average Value
Number
Average Value
Number
Average Value
Number
Average Value
Number
Average Value
LOANS ORIGINATED
5
$83,274
9
$82,997
19
$92,015
6
$57,497
6
$86,622
2
$45,535
APPLICATIONS APPROVED, NOT ACCEPTED
0
$0
0
$0
5
$76,786
0
$0
0
$0
1
$40,190
APPLICATIONS DENIED
1
$75,580
3
$75,997
26
$89,078
6
$16,455
2
$50,720
2
$50,895
APPLICATIONS WITHDRAWN
1
$90,520
2
$109,185
10
$100,246
0
$0
0
$0
0
$0
FILES CLOSED FOR INCOMPLETENESS
0
$0
0
$0
3
$82,807
0
$0
0
$0
0
$0
Aggregated Statistics For Year 2007 (Based on 4 partial tracts)
A) FHA, FSA/RHS & VA Home Purchase Loans
B) Conventional Home Purchase Loans
C) Refinancings
D) Home Improvement Loans
F) Non-occupant Loans on < 5 Family Dwellings (A B C & D)
G) Loans On Manufactured Home Dwelling (A B C & D)
Number
Average Value
Number
Average Value
Number
Average Value
Number
Average Value
Number
Average Value
Number
Average Value
LOANS ORIGINATED
2
$123,010
20
$114,658
29
$86,499
7
$44,334
12
$101,742
6
$61,728
APPLICATIONS APPROVED, NOT ACCEPTED
0
$0
3
$101,127
10
$48,323
1
$22,160
0
$0
3
$68,573
APPLICATIONS DENIED
0
$0
9
$54,797
43
$85,363
7
$48,101
2
$71,105
5
$49,690
APPLICATIONS WITHDRAWN
1
$83,560
1
$71,360
8
$71,879
2
$44,205
0
$0
2
$73,245
FILES CLOSED FOR INCOMPLETENESS
0
$0
1
$60,680
3
$101,663
0
$0
0
$0
0
$0
Aggregated Statistics For Year 2006 (Based on 4 partial tracts)
A) FHA, FSA/RHS & VA Home Purchase Loans
B) Conventional Home Purchase Loans
C) Refinancings
D) Home Improvement Loans
F) Non-occupant Loans on < 5 Family Dwellings (A B C & D)
G) Loans On Manufactured Home Dwelling (A B C & D)
Number
Average Value
Number
Average Value
Number
Average Value
Number
Average Value
Number
Average Value
Number
Average Value
LOANS ORIGINATED
3
$122,900
33
$79,832
37
$90,160
9
$32,116
9
$71,259
5
$51,476
APPLICATIONS APPROVED, NOT ACCEPTED
0
$0
8
$59,134
9
$59,089
2
$45,955
2
$71,770
5
$54,798
APPLICATIONS DENIED
2
$82,230
14
$67,634
43
$90,068
8
$16,278
5
$75,880
9
$58,887
APPLICATIONS WITHDRAWN
1
$171,630
9
$55,439
18
$96,886
2
$94,050
0
$0
1
$69,810
FILES CLOSED FOR INCOMPLETENESS
0
$0
0
$0
3
$93,400
0
$0
0
$0
0
$0
Aggregated Statistics For Year 2005 (Based on 4 partial tracts)
B) Conventional Home Purchase Loans
C) Refinancings
D) Home Improvement Loans
F) Non-occupant Loans on < 5 Family Dwellings (A B C & D)
G) Loans On Manufactured Home Dwelling (A B C & D)
Number
Average Value
Number
Average Value
Number
Average Value
Number
Average Value
Number
Average Value
LOANS ORIGINATED
25
$89,183
50
$82,230
5
$25,536
4
$65,340
6
$61,108
APPLICATIONS APPROVED, NOT ACCEPTED
7
$88,003
13
$55,052
3
$25,540
1
$145,620
3
$73,417
APPLICATIONS DENIED
16
$72,349
54
$83,806
7
$33,061
3
$84,943
15
$57,697
APPLICATIONS WITHDRAWN
7
$112,934
27
$88,892
2
$194,655
2
$96,415
0
$0
FILES CLOSED FOR INCOMPLETENESS
0
$0
5
$95,706
0
$0
0
$0
0
$0
Aggregated Statistics For Year 2004 (Based on 4 partial tracts)
A) FHA, FSA/RHS & VA Home Purchase Loans
B) Conventional Home Purchase Loans
C) Refinancings
D) Home Improvement Loans
F) Non-occupant Loans on < 5 Family Dwellings (A B C & D)
G) Loans On Manufactured Home Dwelling (A B C & D)
Number
Average Value
Number
Average Value
Number
Average Value
Number
Average Value
Number
Average Value
Number
Average Value
LOANS ORIGINATED
2
$63,290
28
$89,150
54
$77,145
3
$55,870
2
$33,055
9
$65,291
APPLICATIONS APPROVED, NOT ACCEPTED
0
$0
8
$69,516
7
$78,101
2
$28,200
0
$0
5
$48,164
APPLICATIONS DENIED
0
$0
13
$72,224
60
$74,824
11
$29,365
2
$44,420
12
$56,895
APPLICATIONS WITHDRAWN
1
$93,610
3
$133,207
23
$88,556
0
$0
1
$91,010
2
$53,565
FILES CLOSED FOR INCOMPLETENESS
0
$0
0
$0
3
$109,263
0
$0
0
$0
0
$0
Aggregated Statistics For Year 2003 (Based on 4 partial tracts)
A) FHA, FSA/RHS & VA Home Purchase Loans
B) Conventional Home Purchase Loans
C) Refinancings
D) Home Improvement Loans
F) Non-occupant Loans on < 5 Family Dwellings (A B C & D)
Number
Average Value
Number
Average Value
Number
Average Value
Number
Average Value
Number
Average Value
LOANS ORIGINATED
4
$75,842
18
$67,537
69
$95,149
5
$45,084
5
$51,654
APPLICATIONS APPROVED, NOT ACCEPTED
0
$0
8
$48,656
19
$64,752
0
$0
2
$45,550
APPLICATIONS DENIED
1
$79,770
14
$62,677
46
$73,606
3
$20,657
1
$28,170
APPLICATIONS WITHDRAWN
0
$0
4
$63,385
14
$94,372
2
$15,660
0
$0
FILES CLOSED FOR INCOMPLETENESS
0
$0
2
$106,395
2
$88,830
0
$0
0
$0
Aggregated Statistics For Year 2002 (Based on 4 partial tracts)
A) FHA, FSA/RHS & VA Home Purchase Loans
B) Conventional Home Purchase Loans
C) Refinancings
D) Home Improvement Loans
F) Non-occupant Loans on < 5 Family Dwellings (A B C & D)
Number
Average Value
Number
Average Value
Number
Average Value
Number
Average Value
Number
Average Value
LOANS ORIGINATED
2
$42,630
19
$100,575
58
$94,749
5
$23,848
2
$43,225
APPLICATIONS APPROVED, NOT ACCEPTED
1
$55,210
5
$51,216
10
$91,712
0
$0
0
$0
APPLICATIONS DENIED
2
$57,640
14
$91,227
33
$71,267
6
$11,812
2
$83,945
APPLICATIONS WITHDRAWN
1
$47,330
3
$83,383
12
$85,087
0
$0
0
$0
FILES CLOSED FOR INCOMPLETENESS
0
$0
0
$0
2
$89,205
1
$58,940
0
$0
Aggregated Statistics For Year 2001 (Based on 4 partial tracts)
A) FHA, FSA/RHS & VA Home Purchase Loans
B) Conventional Home Purchase Loans
C) Refinancings
D) Home Improvement Loans
F) Non-occupant Loans on < 5 Family Dwellings (A B C & D)
Number
Average Value
Number
Average Value
Number
Average Value
Number
Average Value
Number
Average Value
LOANS ORIGINATED
4
$69,415
16
$74,792
56
$83,606
7
$21,063
6
$37,527
APPLICATIONS APPROVED, NOT ACCEPTED
0
$0
8
$41,562
9
$73,356
0
$0
0
$0
APPLICATIONS DENIED
1
$59,870
24
$49,024
38
$62,537
6
$23,307
3
$59,280
APPLICATIONS WITHDRAWN
0
$0
0
$0
15
$75,149
1
$11,640
0
$0
FILES CLOSED FOR INCOMPLETENESS
0
$0
0
$0
4
$65,412
0
$0
0
$0
Aggregated Statistics For Year 2000 (Based on 4 partial tracts)
A) FHA, FSA/RHS & VA Home Purchase Loans
B) Conventional Home Purchase Loans
C) Refinancings
D) Home Improvement Loans
F) Non-occupant Loans on < 5 Family Dwellings (A B C & D)
Number
Average Value
Number
Average Value
Number
Average Value
Number
Average Value
Number
Average Value
LOANS ORIGINATED
2
$53,815
26
$71,250
29
$66,831
3
$6,030
5
$28,870
APPLICATIONS APPROVED, NOT ACCEPTED
0
$0
17
$47,626
14
$67,360
1
$4,330
0
$0
APPLICATIONS DENIED
0
$0
32
$48,649
43
$53,219
11
$10,719
5
$57,104
APPLICATIONS WITHDRAWN
0
$0
0
$0
13
$52,347
2
$56,025
0
$0
FILES CLOSED FOR INCOMPLETENESS
0
$0
1
$60,100
4
$65,542
0
$0
0
$0
Aggregated Statistics For Year 1999 (Based on 2 partial tracts)
A) FHA, FSA/RHS & VA Home Purchase Loans
B) Conventional Home Purchase Loans
C) Refinancings
D) Home Improvement Loans
F) Non-occupant Loans on < 5 Family Dwellings (A B C & D)
Detailed PMIC statistics for the following Tracts:0017.00
, 0018.00
2004 - 2018 National Fire Incident Reporting System (NFIRS) incidents
According to the data from the years 2004 - 2018 the average number of fire incidents per year is 8. The highest number of fire incidents - 26 took place in 2010, and the least - 0 in 2005. The data has an increasing trend.
When looking into fire subcategories, the most incidents belonged to: Outside Fires (47.2%), and Mobile Property/Vehicle Fires (26.0%).
Fire incident types reported to NFIRS in Zip Code 38391


+$500
-$6,038
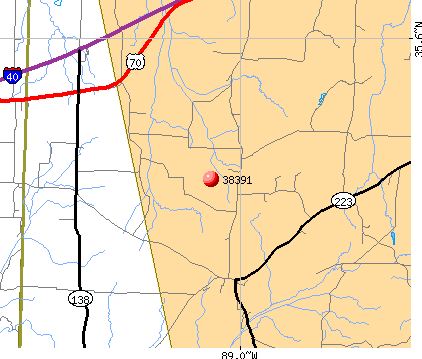 Nearest zip codes: 38392, 38301, 38356, 38006, 38381, 38075.


 (Students: 296, Location: 1945 DENMARK RD, Grades: PK-5)


 According to the data from the years 2004 - 2018 the average number of fire incidents per year is 8. The highest number of fire incidents - 26 took place in 2010, and the least - 0 in 2005. The data has an increasing trend.
 When looking into fire subcategories, the most incidents belonged to: Outside Fires (47.2%), and Mobile Property/Vehicle Fires (26.0%).