Estimated zip code population in 2022: 2,244 Zip code population in 2010: 3,131 Zip code population in 2000: 3,052
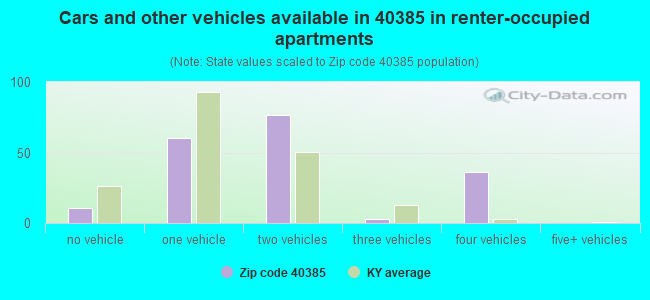
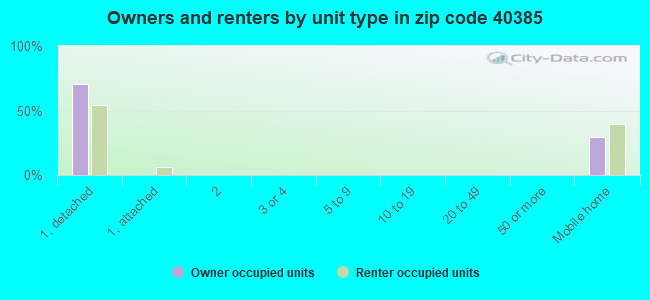
Houses and condos: 1,253 Renter-occupied apartments: 191
% of renters here:
21%
State:
31%
March 2022 cost of living index in zip code 40385: 80.9 (low, U.S. average is 100)
Land area: 47.3 sq. mi. Water area: 1.0 sq. mi.
Population density: 47 people per square mile
(very low).
OSM Map
General Map
Google Map
MSN Map
OSM Map
General Map
Google Map
MSN Map
OSM Map
General Map
Google Map
MSN Map
OSM Map
General Map
Google Map
MSN Map
Please wait while loading the map...
Real estate property taxes paid for housing units in 2022:
This zip code:
0.5% ($937)
Kentucky:
0.7% ($1,456)
Median real estate property taxes paid for housing units with mortgages in 2022: $1,167 (0.6%) Median real estate property taxes paid for housing units with no mortgage in 2022: $576 (0.5%)
Business Search- 14 Million verified businesses
Males: 1,098
(48.9%)
Females: 1,146
(51.1%)
For population 25 years and over in 40385:
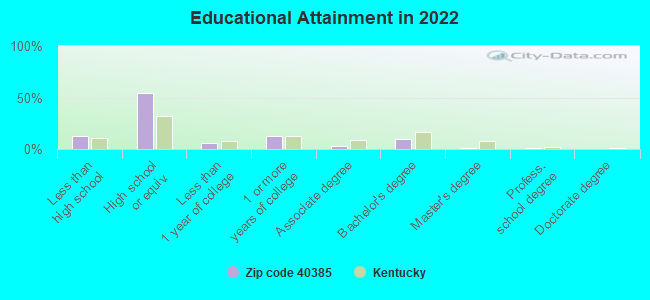
High school or higher: 86.4%
Bachelor's degree or higher: 12.3%
Graduate or professional degree: 2.6%
Unemployed: 1.7%
Mean travel time to work (commute): 25.7 minutes
For population 15 years and over in 40385:
Never married: 12.3%
Now married: 61.7%
Separated: 3.1%
Widowed: 9.3%
Divorced: 13.6%
Zip code 40385 compared to state average:
Unemployed percentage below state average.
Black race population percentage significantly below state average.
Hispanic race population percentage significantly below state average.
Median age above state average.
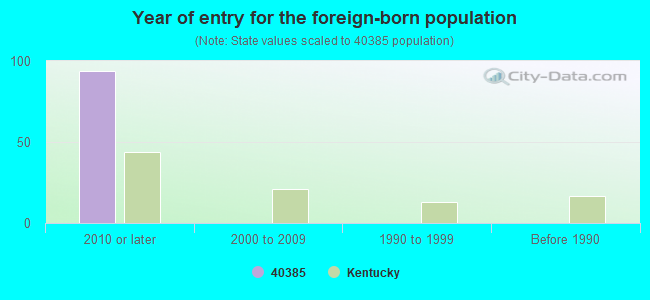
Foreign-born population percentage significantly below state average.
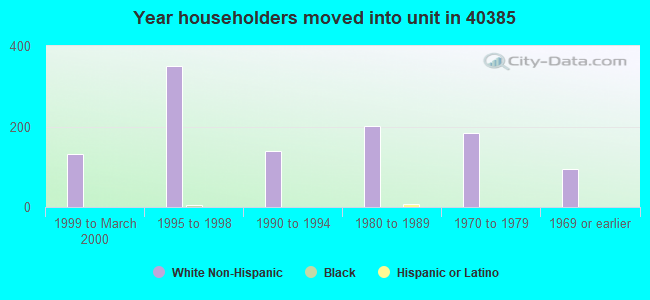
Length of stay since moving in significantly above state average.
House age below state average.
Number of college students significantly below state average.
Percentage of population with a bachelor's degree or higher below state average.
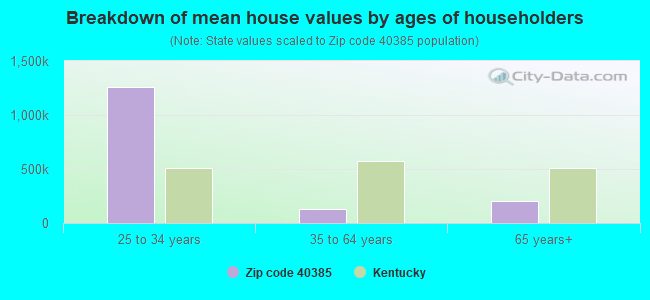
Estimated median house/condo value in 2022: $175,450
40385:
$175,450
Kentucky:
$196,300
According to our research of Kentucky and other state lists, there were 5 registered sex offenders living in 40385 zip code as of April 26, 2024. The ratio of all residents to sex offenders in zip code 40385 is 521 to 1. The ratio of registered sex offenders to all residents in this zip code is near the state average.
Median resident age:
This zip code:
46.4 years
Kentucky median age:
39.4 years
Average household size:
This zip code:
2.4 people
Kentucky:
2.4 people
Averages for the 2020 tax year for zip code 40385, filed in 2021:
Average Adjusted Gross Income (AGI) in 2020: $51,032 (Individual Income Tax Returns)
Here:
$51,032
State:
$61,342
Salary/wage: $45,914 (reported on 81.0% of returns)
Here:
$45,914
State:
$50,827
(% of AGI for various income ranges: 1043.6% for AGIs below $25k, 3400.3% for AGIs $25k-50k, 6371.4% for AGIs $50k-75k, 9829.1% for AGIs $75k-100k, 17247.0% for AGIs $100k-200k)
Taxable interest for individuals: $563 (reported on 19.7% of returns)
This zip code:
$563
Kentucky:
$1,441
(% of AGI for various income ranges: 9.1% for AGIs below $25k, 9.0% for AGIs $25k-50k, 25.0% for AGIs $50k-75k, 8.2% for AGIs $75k-100k, 50.0% for AGIs $100k-200k)
Ordinary dividends: $1,527 (reported on 8.0% of returns)
Here:
$1,527
State:
$7,388
(% of AGI for various income ranges: 9.7% for AGIs below $25k, 35.7% for AGIs $50k-75k, 86.0% for AGIs $100k-200k)
Net capital gain/loss in AGI: +$10,350 (reported on 8.8% of returns)
Here:
+$10,350
State:
+$19,475
(% of AGI for various income ranges: 19.1% for AGIs below $25k, 85.0% for AGIs $50k-75k, 88.2% for AGIs $75k-100k, 963.0% for AGIs $100k-200k)
Profit/loss from business: +$7,813 (reported on 16.8% of returns)
Here:
+$7,813
State:
+$11,386
(% of AGI for various income ranges: 175.8% for AGIs below $25k, 231.6% for AGIs $25k-50k, 116.4% for AGIs $50k-75k, 188.2% for AGIs $75k-100k, 129.0% for AGIs $100k-200k)
Taxable individual retirement arrangement distribution: $19,433 (reported on 6.6% of returns)
40385:
$19,433
Kentucky:
$18,941
(% of AGI for various income ranges: 110.3% for AGIs below $25k, 309.3% for AGIs $50k-75k, 952.0% for AGIs $100k-200k)
Total itemized deductions: $21,450 (reported on 4.4% of returns)
Here:
$21,450
State:
$32,473
(% of AGI for various income ranges: 175.2% for AGIs $25k-50k, 676.4% for AGIs $75k-100k)
Charity contributions: $6,275 (reported on 2.9% of returns)
Here:
$6,275
State:
$13,472
(% of AGI for various income ranges: 228.2% for AGIs $75k-100k)
Taxes paid: $5,650 (reported on 4.4% of returns)
40385:
$5,650
State:
$7,830
(% of AGI for various income ranges: 40.0% for AGIs $25k-50k, 195.5% for AGIs $75k-100k)
Earned income credit: $2,213 (reported on 22.6% of returns)
Here:
$2,213
State:
$2,336
(% of AGI for various income ranges: 107.6% for AGIs below $25k, 106.8% for AGIs $25k-50k)
Percentage of individuals using paid preparers for their 2020 taxes: 93.4%
Here:
93%
State:
94%
(% for various income ranges: 91.3% for AGIs below $25k, 94.9% for AGIs $25k-50k, 94.7% for AGIs $50k-75k, 93.8% for AGIs $75k-100k, 94.1% for AGIs $100k-200k)
Averages for the 2012 tax year for zip code 40385, filed in 2013:
Average Adjusted Gross Income (AGI) in 2012: $38,370 (Individual Income Tax Returns)
Here:
$38,370
State:
$50,814
Salary/wage: $35,541 (reported on 83.3% of returns)
Here:
$35,541
State:
$42,723
(% of AGI for various income ranges: 76.8% for AGIs below $25k, 83.6% for AGIs $25k-50k, 76.1% for AGIs $50k-75k, 79.8% for AGIs $75k-100k, 67.8% for AGIs $100k-200k)
Taxable interest for individuals: $465 (reported on 23.5% of returns)
This zip code:
$465
Kentucky:
$1,381
(% of AGI for various income ranges: 0.4% for AGIs below $25k, 0.4% for AGIs $25k-50k, 0.3% for AGIs $50k-75k, 0.2% for AGIs $75k-100k, 0.1% for AGIs $100k-200k)
Ordinary dividends: $1,492 (reported on 9.1% of returns)
Here:
$1,492
State:
$6,239
(% of AGI for various income ranges: 0.4% for AGIs below $25k, 0.7% for AGIs $25k-50k, 0.4% for AGIs $50k-75k, 0.2% for AGIs $75k-100k)
Net capital gain/loss in AGI: +$1,108 (reported on 9.1% of returns)
Here:
+$1,108
State:
+$11,336
(% of AGI for various income ranges: 1.0% for AGIs below $25k, 0.3% for AGIs $50k-75k, 0.4% for AGIs $75k-100k)
Profit/loss from business: +$5,904 (reported on 18.2% of returns)
Here:
+$5,904
State:
+$10,862
(% of AGI for various income ranges: 8.9% for AGIs below $25k, 2.9% for AGIs $25k-50k, 2.7% for AGIs $50k-75k)
Taxable individual retirement arrangement distribution: $11,414 (reported on 5.3% of returns)
40385:
$11,414
Kentucky:
$14,296
(% of AGI for various income ranges: 1.3% for AGIs below $25k, 1.1% for AGIs $25k-50k, 4.2% for AGIs $50k-75k)
Total itemized deductions: $16,504 (24% of AGI, reported on 20.5% of returns)
Here:
$16,504
State:
$21,160
Here:
24.2% of AGI
State:
20.0% of AGI
(% of AGI for various income ranges: 5.2% for AGIs below $25k, 6.9% for AGIs $25k-50k, 9.5% for AGIs $50k-75k, 11.0% for AGIs $75k-100k, 11.6% for AGIs $100k-200k)
Charity contributions: $3,128 (reported on 13.6% of returns)
Here:
$3,128
State:
$4,303
(% of AGI for various income ranges: 0.9% for AGIs below $25k, 0.6% for AGIs $25k-50k, 1.2% for AGIs $50k-75k, 1.2% for AGIs $75k-100k, 1.8% for AGIs $100k-200k)
Taxes paid: $5,681 (reported on 20.5% of returns)
40385:
$5,681
State:
$8,496
(% of AGI for various income ranges: 0.9% for AGIs below $25k, 2.0% for AGIs $25k-50k, 2.8% for AGIs $50k-75k, 4.6% for AGIs $75k-100k, 5.3% for AGIs $100k-200k)
Earned income credit: $2,279 (reported on 25.0% of returns)
Here:
$2,279
State:
$2,273
(% of AGI for various income ranges: 7.9% for AGIs below $25k, 1.1% for AGIs $25k-50k)
Percentage of individuals using paid preparers for their 2012 taxes: 68.2%
Here:
68%
State:
60%
(% for various income ranges: 66.1% for AGIs below $25k, 68.6% for AGIs $25k-50k, 72.7% for AGIs $50k-75k, 66.7% for AGIs $75k-100k, 71.4% for AGIs $100k-200k)
Averages for the 2004 tax year for zip code 40385, filed in 2005:
Average Adjusted Gross Income (AGI) in 2004: $32,384 (Individual Income Tax Returns)
Here:
$32,384
State:
$41,540
Salary/wage: $30,926 (reported on 86.0% of returns)
Here:
$30,926
State:
$36,432
(% of AGI for various income ranges: 103.3% for AGIs below $10k, 78.3% for AGIs $10k-25k, 85.7% for AGIs $25k-50k, 84.7% for AGIs $50k-75k, 86.2% for AGIs $75k-100k, 55.6% for AGIs over 100k)
Taxable interest for individuals: $812 (reported on 33.2% of returns)
This zip code:
$812
Kentucky:
$1,571
(% of AGI for various income ranges: 2.5% for AGIs below $10k, 1.1% for AGIs $10k-25k, 0.8% for AGIs $25k-50k, 1.0% for AGIs $50k-75k, 0.2% for AGIs $75k-100k, 0.3% for AGIs over 100k)
Taxable dividends: $828 (reported on 9.3% of returns)
Here:
$828
State:
$3,453
(% of AGI for various income ranges: 0.3% for AGIs below $10k, 0.2% for AGIs $10k-25k, 0.1% for AGIs $25k-50k, 0.4% for AGIs $50k-75k, 0.5% for AGIs $75k-100k)
Net capital gain/loss: +$1,476 (reported on 8.4% of returns)
Here:
+$1,476
State:
+$9,663
(% of AGI for various income ranges: 0.0% for AGIs $10k-25k, 0.0% for AGIs $25k-50k, 0.3% for AGIs $50k-75k, -0.0% for AGIs $75k-100k, 3.2% for AGIs over 100k)
Profit/loss from business: +$6,131 (reported on 20.0% of returns)
Here:
+$6,131
State:
+$9,233
(% of AGI for various income ranges: 20.5% for AGIs below $10k, 7.6% for AGIs $10k-25k, 4.1% for AGIs $25k-50k, 2.8% for AGIs $50k-75k, 0.1% for AGIs $75k-100k)
IRA payment deduction: $2,923 (reported on 1.0% of returns)
40385:
$2,923
Kentucky:
$2,955
Total itemized deductions: $13,928 (24% of AGI, reported on 24.5% of returns)
Here:
$13,928
State:
$17,474
Here:
23.6% of AGI
State:
21.0% of AGI
(% of AGI for various income ranges: 8.5% for AGIs $10k-25k, 8.4% for AGIs $25k-50k, 13.0% for AGIs $50k-75k, 14.9% for AGIs $75k-100k, 11.4% for AGIs over 100k)
Charity contributions deductions: $2,316 (4% of AGI, reported on 17.9% of returns)
Here:
$2,316
State:
$3,494
Here:
3.6% of AGI
State:
4.0% of AGI
(% of AGI for various income ranges: 1.0% for AGIs $10k-25k, 0.8% for AGIs $25k-50k, 1.9% for AGIs $50k-75k, 1.7% for AGIs $75k-100k, 1.8% for AGIs over 100k)
Total tax: $3,484 (reported on 73.7% of returns)
40385:
$3,484
State:
$6,162
(% of AGI for various income ranges: 4.2% for AGIs below $10k, 4.1% for AGIs $10k-25k, 5.9% for AGIs $25k-50k, 8.4% for AGIs $50k-75k, 10.3% for AGIs $75k-100k, 17.1% for AGIs over 100k)
Earned income credit: $1,605 (reported on 20.6% of returns)
Here:
$1,605
State:
$1,723
Percentage of individuals using paid preparers for their 2004 taxes: 74.0%
Here:
74%
State:
66%
(% for various income ranges: 68.8% for AGIs below $10k, 72.3% for AGIs $10k-25k, 80.1% for AGIs $25k-50k, 76.2% for AGIs $50k-75k, 67.2% for AGIs $75k-100k, 65.4% for AGIs over 100k)
Household received Food Stamps/SNAP in the past 12 months: 94 Household did not receive Food Stamps/SNAP in the past 12 months: 821
Women who had a birth in the past 12 months: 16 (0 now married, 17 unmarried) Women who did not have a birth in the past 12 months: 403 (279 now married, 126 unmarried)
Housing units in zip code 40385 with a mortgage: 345 (23 second mortgage, 8 both second mortgage and home equity loan) Houses without a mortgage: 22
Median monthly owner costs for units with a mortgage: $1,070 Median monthly owner costs for units without a mortgage: $347
Residents with income below the poverty level in 2022:
This zip code:
15.3%
Whole state:
16.5%
Residents with income below 50% of the poverty level in 2022:
This zip code:
8.7%
Whole state:
9.0%
Median number of rooms in houses and condos:
Here:
6.2
State:
6.4
Median number of rooms in apartments:
Here:
5.1
State:
4.4
Notable locations in this zip code not listed on our city pages
Churches in zip code 40385 include: Flatwoods Christian Church (A), Old Cain Springs Church (B), Pleasant Green Church (C). Display/hide their locations on the map
Cemeteries: Jones Cemetery (1), Hubbard Cemetery (2), Portwood Cemetery (3), Adams Cemetery (4), Ellington Cemetery (5), Lewis Cemetery (6), College Hill Church Cemetery (7). Display/hide their locations on the map
Streams, rivers, and creeks: Drowning Creek (A), Cow Creek (B), Butler Branch (C), Morgan Branch (D), Sand Spring Branch (E), Flint Creek (F), Falling Branch (G). Display/hide their locations on the map
National Pollutant Discharge Elimination System NON-MAJOR (Tracking pollutant discharge elimination systems) - permit Business SIC classification: GROCERY STORES Alternative names: BYBEE GROCERY
CAINS SPRINGS ROAD WATER LINE (CAIN SPRINGS RD in WACO, KY)
National Pollutant Discharge Elimination System NON-MAJOR (Tracking pollutant discharge elimination systems) - permit Business SIC classification: MANAGEMENT SERVICES
COLLEGE HILL WTP UPGRADE (216 BEND in WACO, KY)
National Pollutant Discharge Elimination System NON-MAJOR (Tracking pollutant discharge elimination systems) - permit Business SIC classification: MANAGEMENT SERVICES Alternative names: COLLEGE HILL WATER TREATMENT PLANT
FLINT ROAD WATER LINE (FLINT RD in WACO, KY)
National Pollutant Discharge Elimination System NON-MAJOR (Tracking pollutant discharge elimination systems) - permit Business SIC classification: MANAGEMENT SERVICES
Housing units lacking complete plumbing facilities: 9.5% Housing units lacking complete kitchen facilities: 9.6%
73.9%Electricity
8.9%Bottled, tank, or LP gas
8.8%Utility gas
7.5%Wood
1.2%No fuel used
Population in 1990: 1,433. Population change in the 1990s: +1,619 (+113.0%).
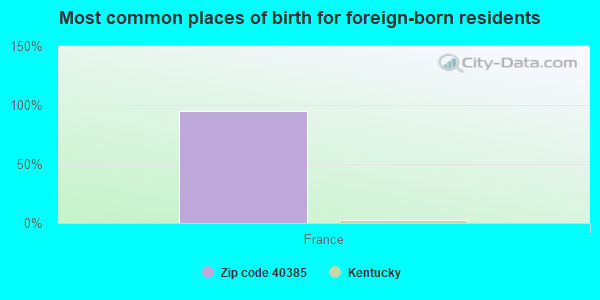
Place of birth for U.S.-born residents:
This state: 1,740
Northeast: 24
Midwest: 309
South: 18
West: 59
65% of the 40385 zip code residents lived in the same house 5 years ago. Out of people who lived in different houses, 69% lived in this county. Out of people who lived in different counties, 50% lived in Kentucky.
100% of the 40385 zip code residents lived in the same house 1 year ago. Out of people who lived in different houses, 200% moved from this county.
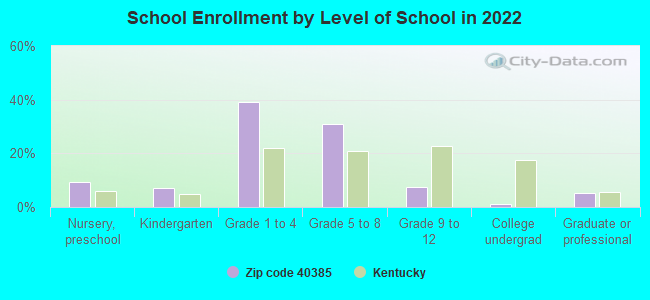
Private vs. public school enrollment:
Students in private schools in grades 1 to 8 (elementary and middle school): 76
Here:
25.8%
Kentucky:
17.2%
Students in private schools in grades 9 to 12 (high school): 4
Here:
14.3%
Kentucky:
15.2%
Students in private undergraduate colleges:
Here:
0.0%
Kentucky:
19.6%
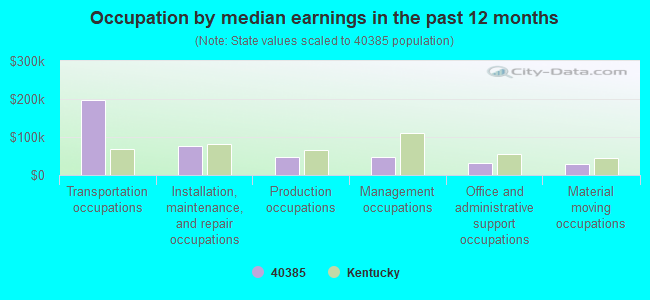
Occupation by median earnings in the past 12 months ($)
196,496Transportation occupations
76,634Installation, maintenance, and repair occupations
46,669Production occupations
46,643Management occupations
31,050Office and administrative support occupations
29,268Material moving occupations
Companies with federal contracts located in this zip code:
RICK CHILDERS (290 GRIGGS ROAD in WACO, KY; small business) : $1,133,945 in 29 contractsfrom 2000 to 2005
Contracts for Other Administrative Support Services, Other Non-Building Structures, Landscaping/Groundskeeping Services, Snow Removal/Salt Service (also spreading aggregate or other snow melting material), and moreby Army Signed by year:2000: $49,510; 2001: $0; 2002: $50,000; 2003: $188,100; 2004: $411,256; 2005: $435,079; 2006: $0.
Biggest contracts:
$350,000 with Army for Other Administrative Support Services. Signed on 2005-04-19. Completion date: 2006-04-30.
$130,000 with Army for Other Non-Building Structures. Signed on 2003-09-28. Completion date: 2004-09-30.
$100,472, same as above.Signed on 2004-07-09. Completion date: 2004-09-30.
$100,000 with Army for Landscaping/Groundskeeping Services. Signed on 2004-05-27. Completion date: 2004-10-31.
Top industries in this zip code by the number of employees in 2005:
Construction: Site Preparation Contractors (1-4 employees: 4 establishments)
Construction: Drywall and Insulation Contractors (5-9: 1)
Professional, Scientific, and Technical Services: Veterinary Services (5-9: 1)
Construction: Plumbing, Heating, and Air-Conditioning Contractors (5-9: 1)
Construction: New Single-Family Housing Construction (except Operative Builders) (1-4: 1)
Construction: Residential Remodelers (1-4: 1)
Construction: Siding Contractors (1-4: 1)
Fatal accident statistics in 2012:
Fatal accident count: 1
Vehicles involved in fatal accidents: 2
Fatal accidents caused by drunken drivers: 0
Fatalities: 2
Persons involved in fatal accidents: 6
Pedestrians involved in fatal accidents: 0
Fatal accident statistics in 2010:
Fatal accident count: 3
Vehicles involved in fatal accidents: 7
Fatal accidents caused by drunken drivers: 1
Fatalities: 3
Persons involved in fatal accidents: 8
Pedestrians involved in fatal accidents: 0
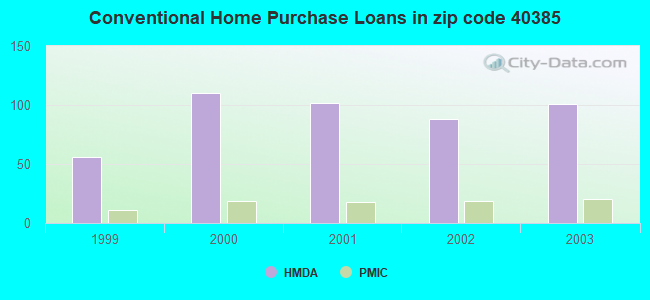
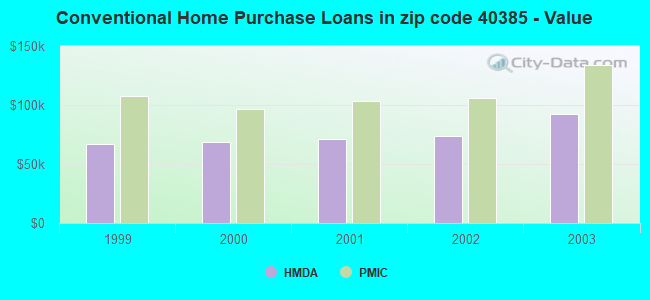
Home Mortgage Disclosure Act Aggregated Statistics For Year 2003 (Based on 4 partial tracts)
A) FHA, FSA/RHS & VA Home Purchase Loans
B) Conventional Home Purchase Loans
C) Refinancings
D) Home Improvement Loans
E) Loans on Dwellings For 5+ Families
F) Non-occupant Loans on < 5 Family Dwellings (A B C & D)
Number
Average Value
Number
Average Value
Number
Average Value
Number
Average Value
Number
Average Value
Number
Average Value
LOANS ORIGINATED
26
$114,407
101
$92,604
298
$85,361
38
$10,962
2
$69,595
40
$78,597
APPLICATIONS APPROVED, NOT ACCEPTED
1
$92,500
7
$82,350
37
$89,101
4
$43,425
0
$0
1
$33,250
APPLICATIONS DENIED
2
$96,800
22
$70,315
118
$80,490
18
$16,728
1
$325,400
3
$26,580
APPLICATIONS WITHDRAWN
3
$98,417
12
$97,752
63
$95,656
1
$5,440
0
$0
2
$82,230
FILES CLOSED FOR INCOMPLETENESS
0
$0
5
$95,628
17
$85,985
2
$13,450
0
$0
1
$50,790
Aggregated Statistics For Year 2002 (Based on 4 partial tracts)
A) FHA, FSA/RHS & VA Home Purchase Loans
B) Conventional Home Purchase Loans
C) Refinancings
D) Home Improvement Loans
E) Loans on Dwellings For 5+ Families
F) Non-occupant Loans on < 5 Family Dwellings (A B C & D)
Number
Average Value
Number
Average Value
Number
Average Value
Number
Average Value
Number
Average Value
Number
Average Value
LOANS ORIGINATED
30
$96,382
88
$73,688
253
$79,710
26
$13,249
1
$191,050
22
$47,575
APPLICATIONS APPROVED, NOT ACCEPTED
1
$129,380
12
$68,421
40
$86,828
2
$39,205
0
$0
2
$42,725
APPLICATIONS DENIED
1
$141,780
32
$50,611
107
$80,276
13
$21,120
0
$0
0
$0
APPLICATIONS WITHDRAWN
2
$61,695
8
$100,681
60
$81,021
4
$24,815
0
$0
2
$65,190
FILES CLOSED FOR INCOMPLETENESS
0
$0
4
$77,848
14
$89,496
0
$0
0
$0
0
$0
Aggregated Statistics For Year 2001 (Based on 4 partial tracts)
A) FHA, FSA/RHS & VA Home Purchase Loans
B) Conventional Home Purchase Loans
C) Refinancings
D) Home Improvement Loans
F) Non-occupant Loans on < 5 Family Dwellings (A B C & D)
Number
Average Value
Number
Average Value
Number
Average Value
Number
Average Value
Number
Average Value
LOANS ORIGINATED
18
$85,857
102
$71,303
239
$76,481
42
$19,579
31
$56,208
APPLICATIONS APPROVED, NOT ACCEPTED
1
$91,270
18
$52,649
49
$69,425
8
$17,859
0
$0
APPLICATIONS DENIED
3
$100,233
63
$50,881
109
$67,412
22
$14,250
4
$86,742
APPLICATIONS WITHDRAWN
3
$81,587
13
$84,416
61
$88,075
9
$12,843
2
$50,150
FILES CLOSED FOR INCOMPLETENESS
0
$0
1
$46,800
12
$81,450
0
$0
1
$33,430
Aggregated Statistics For Year 2000 (Based on 4 partial tracts)
A) FHA, FSA/RHS & VA Home Purchase Loans
B) Conventional Home Purchase Loans
C) Refinancings
D) Home Improvement Loans
E) Loans on Dwellings For 5+ Families
F) Non-occupant Loans on < 5 Family Dwellings (A B C & D)
Number
Average Value
Number
Average Value
Number
Average Value
Number
Average Value
Number
Average Value
Number
Average Value
LOANS ORIGINATED
29
$84,369
110
$68,716
129
$53,978
47
$17,187
1
$74,110
24
$48,792
APPLICATIONS APPROVED, NOT ACCEPTED
7
$54,647
26
$51,506
27
$64,267
6
$24,760
0
$0
0
$0
APPLICATIONS DENIED
11
$63,494
72
$44,022
80
$65,188
21
$13,371
0
$0
6
$26,070
APPLICATIONS WITHDRAWN
1
$58,650
16
$71,068
40
$60,733
3
$109,680
0
$0
4
$60,105
FILES CLOSED FOR INCOMPLETENESS
1
$40,120
1
$17,830
6
$54,533
0
$0
0
$0
0
$0
Aggregated Statistics For Year 1999 (Based on 2 partial tracts)
A) FHA, FSA/RHS & VA Home Purchase Loans
B) Conventional Home Purchase Loans
C) Refinancings
D) Home Improvement Loans
F) Non-occupant Loans on < 5 Family Dwellings (A B C & D)
Detailed PMIC statistics for the following Tracts:0110.00
, 0111.00
2002 - 2018 National Fire Incident Reporting System (NFIRS) incidents
According to the data from the years 2002 - 2018 the average number of fire incidents per year is 38. The highest number of reported fires - 96 took place in 2004, and the least - 13 in 2007. The data has a growing trend.
When looking into fire subcategories, the most incidents belonged to: Outside Fires (40.8%), and Structure Fires (35.5%).
Fire incident types reported to NFIRS in Zip Code 40385


 Nearest zip codes: 40336, 40475, 40403, 40312, 40404, 40391.


 (Students: 469, Location: 359 WACO LOOP, Grades: PK-5)


 According to the data from the years 2002 - 2018 the average number of fire incidents per year is 38. The highest number of reported fires - 96 took place in 2004, and the least - 13 in 2007. The data has a growing trend.
 When looking into fire subcategories, the most incidents belonged to: Outside Fires (40.8%), and Structure Fires (35.5%).