Estimated zip code population in 2022: 3,961 Zip code population in 2010: 3,404 Zip code population in 2000: 3,139
Houses and condos: 2,368 Renter-occupied apartments: 151
% of renters here:
10%
State:
31%
March 2022 cost of living index in zip code 42044: 82.9 (low, U.S. average is 100)
Land area: 23.8 sq. mi. Water area: 12.8 sq. mi.
Population density: 166 people per square mile
(very low).
OSM Map
General Map
Google Map
MSN Map
OSM Map
General Map
Google Map
MSN Map
OSM Map
General Map
Google Map
MSN Map
OSM Map
General Map
Google Map
MSN Map
Please wait while loading the map...
Real estate property taxes paid for housing units in 2022:
This zip code:
0.6% ($1,516)
Kentucky:
0.7% ($1,456)
Median real estate property taxes paid for housing units with mortgages in 2022: $1,498 (0.6%) Median real estate property taxes paid for housing units with no mortgage in 2022: $1,525 (0.6%)
Business Search- 14 Million verified businesses
Males: 2,114
(53.4%)
Females: 1,846
(46.6%)
For population 25 years and over in 42044:
High school or higher: 91.6%
Bachelor's degree or higher: 21.3%
Graduate or professional degree: 11.3%
Unemployed: 0.4%
Mean travel time to work (commute): 29.8 minutes
For population 15 years and over in 42044:
Never married: 18.6%
Now married: 60.0%
Separated: 0.0%
Widowed: 10.6%
Divorced: 10.9%
Zip code 42044 compared to state average:
Unemployed percentage significantly below state average.
Black race population percentage significantly below state average.
Hispanic race population percentage significantly below state average.
Foreign-born population percentage significantly below state average.
Renting percentage significantly below state average.
Length of stay since moving in significantly below state average.
Averages for the 2020 tax year for zip code 42044, filed in 2021:
Average Adjusted Gross Income (AGI) in 2020: $69,726 (Individual Income Tax Returns)
Here:
$69,726
State:
$61,342
Salary/wage: $53,455 (reported on 70.4% of returns)
Here:
$53,455
State:
$50,827
(% of AGI for various income ranges: 1042.7% for AGIs below $25k, 2896.2% for AGIs $25k-50k, 5340.6% for AGIs $50k-75k, 7730.0% for AGIs $75k-100k, 13767.3% for AGIs $100k-200k)
Taxable interest for individuals: $1,322 (reported on 42.1% of returns)
This zip code:
$1,322
Kentucky:
$1,441
(% of AGI for various income ranges: 20.8% for AGIs below $25k, 51.5% for AGIs $25k-50k, 52.5% for AGIs $50k-75k, 147.3% for AGIs $75k-100k, 70.0% for AGIs $100k-200k)
Ordinary dividends: $6,497 (reported on 22.0% of returns)
Here:
$6,497
State:
$7,388
(% of AGI for various income ranges: 30.0% for AGIs below $25k, 62.3% for AGIs $25k-50k, 61.9% for AGIs $50k-75k, 249.1% for AGIs $75k-100k, 374.7% for AGIs $100k-200k)
Net capital gain/loss in AGI: +$13,361 (reported on 20.8% of returns)
Here:
+$13,361
State:
+$19,475
(% of AGI for various income ranges: 6.5% for AGIs below $25k, 51.5% for AGIs $25k-50k, 96.2% for AGIs $50k-75k, 130.0% for AGIs $75k-100k, 540.0% for AGIs $100k-200k)
Profit/loss from business: +$9,075 (reported on 15.1% of returns)
Here:
+$9,075
State:
+$11,386
(% of AGI for various income ranges: 85.1% for AGIs below $25k, 149.2% for AGIs $25k-50k, 95.6% for AGIs $50k-75k, 455.5% for AGIs $75k-100k, 547.3% for AGIs $100k-200k)
Taxable individual retirement arrangement distribution: $23,262 (reported on 16.4% of returns)
42044:
$23,262
Kentucky:
$18,941
(% of AGI for various income ranges: 106.2% for AGIs below $25k, 276.9% for AGIs $25k-50k, 410.0% for AGIs $50k-75k, 637.3% for AGIs $75k-100k, 2385.3% for AGIs $100k-200k)
Total itemized deductions: $37,256 (reported on 5.7% of returns)
Here:
$37,256
State:
$32,473
(% of AGI for various income ranges: 730.0% for AGIs $50k-75k, 516.7% for AGIs $100k-200k)
Charity contributions: $13,257 (reported on 4.4% of returns)
Here:
$13,257
State:
$13,472
(% of AGI for various income ranges: 120.0% for AGIs $50k-75k, 490.7% for AGIs $100k-200k)
Taxes paid: $7,900 (reported on 5.7% of returns)
42044:
$7,900
State:
$7,830
(% of AGI for various income ranges: 135.0% for AGIs $50k-75k, 167.3% for AGIs $100k-200k)
Earned income credit: $1,939 (reported on 14.5% of returns)
Here:
$1,939
State:
$2,336
(% of AGI for various income ranges: 71.1% for AGIs below $25k, 70.4% for AGIs $25k-50k)
Percentage of individuals using paid preparers for their 2020 taxes: 95.0%
Here:
95%
State:
94%
(% for various income ranges: 94.3% for AGIs below $25k, 94.3% for AGIs $25k-50k, 95.7% for AGIs $50k-75k, 94.4% for AGIs $75k-100k, 95.8% for AGIs $100k-200k, 100.0% for AGIs over 200k)
Averages for the 2012 tax year for zip code 42044, filed in 2013:
Average Adjusted Gross Income (AGI) in 2012: $56,905 (Individual Income Tax Returns)
Here:
$56,905
State:
$50,814
Salary/wage: $43,801 (reported on 76.1% of returns)
Here:
$43,801
State:
$42,723
(% of AGI for various income ranges: 65.1% for AGIs below $25k, 58.9% for AGIs $25k-50k, 63.9% for AGIs $50k-75k, 67.9% for AGIs $75k-100k, 70.6% for AGIs $100k-200k, 27.1% for AGIs over 200k)
Taxable interest for individuals: $1,035 (reported on 41.9% of returns)
This zip code:
$1,035
Kentucky:
$1,381
(% of AGI for various income ranges: 1.1% for AGIs below $25k, 1.4% for AGIs $25k-50k, 0.8% for AGIs $50k-75k, 0.7% for AGIs $75k-100k, 0.5% for AGIs $100k-200k, 0.4% for AGIs over 200k)
Ordinary dividends: $3,118 (reported on 24.5% of returns)
Here:
$3,118
State:
$6,239
(% of AGI for various income ranges: 1.8% for AGIs below $25k, 1.7% for AGIs $25k-50k, 1.4% for AGIs $50k-75k, 1.4% for AGIs $75k-100k, 1.9% for AGIs $100k-200k)
Net capital gain/loss in AGI: +$9,486 (reported on 18.7% of returns)
Here:
+$9,486
State:
+$11,336
(% of AGI for various income ranges: 0.4% for AGIs $50k-75k, 13.3% for AGIs $100k-200k)
Profit/loss from business: +$10,719 (reported on 16.8% of returns)
Here:
+$10,719
State:
+$10,862
(% of AGI for various income ranges: 6.5% for AGIs below $25k, 3.5% for AGIs $25k-50k, 2.7% for AGIs $50k-75k, 1.8% for AGIs $75k-100k, 5.7% for AGIs $100k-200k)
Taxable individual retirement arrangement distribution: $16,662 (reported on 13.5% of returns)
42044:
$16,662
Kentucky:
$14,296
(% of AGI for various income ranges: 4.7% for AGIs below $25k, 4.0% for AGIs $25k-50k, 4.2% for AGIs $50k-75k, 4.4% for AGIs $75k-100k, 6.4% for AGIs $100k-200k)
Total itemized deductions: $21,247 (21% of AGI, reported on 35.5% of returns)
Here:
$21,247
State:
$21,160
Here:
21.0% of AGI
State:
20.0% of AGI
(% of AGI for various income ranges: 11.0% for AGIs below $25k, 10.9% for AGIs $25k-50k, 11.0% for AGIs $50k-75k, 14.7% for AGIs $75k-100k, 15.8% for AGIs $100k-200k, 13.7% for AGIs over 200k)
Charity contributions: $3,993 (reported on 28.4% of returns)
Here:
$3,993
State:
$4,303
(% of AGI for various income ranges: 1.4% for AGIs below $25k, 1.5% for AGIs $25k-50k, 1.5% for AGIs $50k-75k, 2.6% for AGIs $75k-100k, 2.8% for AGIs $100k-200k, 1.6% for AGIs over 200k)
Taxes paid: $7,825 (reported on 35.5% of returns)
42044:
$7,825
State:
$8,496
(% of AGI for various income ranges: 1.9% for AGIs below $25k, 2.3% for AGIs $25k-50k, 3.9% for AGIs $50k-75k, 5.2% for AGIs $75k-100k, 7.6% for AGIs $100k-200k, 5.4% for AGIs over 200k)
Earned income credit: $1,873 (reported on 16.8% of returns)
Here:
$1,873
State:
$2,273
(% of AGI for various income ranges: 5.6% for AGIs below $25k, 0.9% for AGIs $25k-50k)
Percentage of individuals using paid preparers for their 2012 taxes: 61.9%
Here:
62%
State:
60%
(% for various income ranges: 58.2% for AGIs below $25k, 62.2% for AGIs $25k-50k, 61.5% for AGIs $50k-75k, 66.7% for AGIs $75k-100k, 62.5% for AGIs $100k-200k, 100.0% for AGIs over 200k)
Averages for the 2004 tax year for zip code 42044, filed in 2005:
Average Adjusted Gross Income (AGI) in 2004: $44,791 (Individual Income Tax Returns)
Here:
$44,791
State:
$41,540
Salary/wage: $36,283 (reported on 78.0% of returns)
Here:
$36,283
State:
$36,432
(% of AGI for various income ranges: 174.1% for AGIs below $10k, 61.0% for AGIs $10k-25k, 64.5% for AGIs $25k-50k, 70.1% for AGIs $50k-75k, 75.1% for AGIs $75k-100k, 48.6% for AGIs over 100k)
Taxable interest for individuals: $1,656 (reported on 47.4% of returns)
This zip code:
$1,656
Kentucky:
$1,571
(% of AGI for various income ranges: 8.2% for AGIs below $10k, 3.1% for AGIs $10k-25k, 2.1% for AGIs $25k-50k, 1.7% for AGIs $50k-75k, 2.0% for AGIs $75k-100k, 0.8% for AGIs over 100k)
Taxable dividends: $2,517 (reported on 26.5% of returns)
Here:
$2,517
State:
$3,453
(% of AGI for various income ranges: 7.4% for AGIs below $10k, 1.5% for AGIs $10k-25k, 1.8% for AGIs $25k-50k, 1.6% for AGIs $50k-75k, 0.9% for AGIs $75k-100k, 1.4% for AGIs over 100k)
Net capital gain/loss: +$5,159 (reported on 21.6% of returns)
Here:
+$5,159
State:
+$9,663
(% of AGI for various income ranges: -3.0% for AGIs below $10k, -0.2% for AGIs $10k-25k, 0.4% for AGIs $25k-50k, 1.7% for AGIs $50k-75k, 2.0% for AGIs $75k-100k, 5.5% for AGIs over 100k)
Profit/loss from business: +$9,871 (reported on 16.4% of returns)
Here:
+$9,871
State:
+$9,233
(% of AGI for various income ranges: -11.3% for AGIs below $10k, 4.5% for AGIs $10k-25k, 3.8% for AGIs $25k-50k, 3.4% for AGIs $50k-75k, 2.7% for AGIs $75k-100k, 4.3% for AGIs over 100k)
IRA payment deduction: $2,905 (reported on 2.8% of returns)
42044:
$2,905
Kentucky:
$2,955
(% of AGI for various income ranges: 0.3% for AGIs $10k-25k, 0.3% for AGIs $50k-75k, 0.3% for AGIs over 100k)
Total itemized deductions: $18,341 (24% of AGI, reported on 35.9% of returns)
Here:
$18,341
State:
$17,474
Here:
23.6% of AGI
State:
21.0% of AGI
(% of AGI for various income ranges: 43.9% for AGIs below $10k, 12.5% for AGIs $10k-25k, 13.2% for AGIs $25k-50k, 13.7% for AGIs $50k-75k, 15.3% for AGIs $75k-100k, 15.9% for AGIs over 100k)
Charity contributions deductions: $3,334 (4% of AGI, reported on 30.8% of returns)
Here:
$3,334
State:
$3,494
Here:
4.2% of AGI
State:
4.0% of AGI
(% of AGI for various income ranges: 3.1% for AGIs below $10k, 1.8% for AGIs $10k-25k, 1.9% for AGIs $25k-50k, 2.2% for AGIs $50k-75k, 3.1% for AGIs $75k-100k, 2.3% for AGIs over 100k)
Total tax: $6,236 (reported on 77.7% of returns)
42044:
$6,236
State:
$6,162
(% of AGI for various income ranges: 4.4% for AGIs below $10k, 3.8% for AGIs $10k-25k, 6.7% for AGIs $25k-50k, 9.0% for AGIs $50k-75k, 10.7% for AGIs $75k-100k, 17.0% for AGIs over 100k)
Earned income credit: $1,629 (reported on 12.8% of returns)
Here:
$1,629
State:
$1,723
Percentage of individuals using paid preparers for their 2004 taxes: 66.4%
Here:
66%
State:
66%
(% for various income ranges: 57.5% for AGIs below $10k, 67.9% for AGIs $10k-25k, 69.4% for AGIs $25k-50k, 70.2% for AGIs $50k-75k, 62.8% for AGIs $75k-100k, 71.2% for AGIs over 100k)
Household received Food Stamps/SNAP in the past 12 months: 50 Household did not receive Food Stamps/SNAP in the past 12 months: 1,509
Women who had a birth in the past 12 months: 264 (219 now married, 41 unmarried) Women who did not have a birth in the past 12 months: 494 (239 now married, 255 unmarried)
Housing units in zip code 42044 with a mortgage: 662 (58 second mortgage, 58 both second mortgage and home equity loan) Median monthly owner costs for units with a mortgage: $1,222 Median monthly owner costs for units without a mortgage: $505
Residents with income below the poverty level in 2022:
This zip code:
7.0%
Whole state:
16.5%
Residents with income below 50% of the poverty level in 2022:
This zip code:
2.7%
Whole state:
9.0%
Median number of rooms in houses and condos:
Here:
6.3
State:
6.4
Median number of rooms in apartments:
Here:
5.0
State:
4.4
Notable locations in this zip code not listed on our city pages
Notable locations in zip code 42044: Marshall Cabin Area (A), West Gilbertsville Station (B), Sledd Creek Cabin Area (C), Kentucky Dam Tree Nursery (D), East Marshal Volunteer Fire (E), East Marshal Fire Department Station 1 (F), Gilbertsville Fire Department Station 2 (G), Gilbertsville Fire Department Station 1 (H). Display/hide their locations on the map
Churches in zip code 42044 include: Bethel Missionary Baptist Church (A), Saint Peters of the Lakes Episcopal Church (B). Display/hide their locations on the map
Streams, rivers, and creeks: Taylor Creek (A), Stice Creek (B), Sledd Creek (C), Buckhorn Creek (D), Little John Creek (E), Little Bear Creek (F), Indian Camp Branch (G). Display/hide their locations on the map
Size of family households: 529 2-persons, 163 3-persons, 184 4-persons, 198 5-persons, 54 6-persons
Size of nonfamily households: 295 1-person, 132 2-persons
711 married couples with children.
203 single-parent households (177 men, 26 women).
99.0% of residents of 42044 zip code speak English at home.
1.1% of residents speak Spanish at home (95% very well, 5% not at all).
Foreign born population: 10 (0.3%) (0.0% of them are naturalized citizens)
:
0.3%
Whole state:
4.0%
109%Bolivia
25%American
24%English
16%German
11%Irish
9%Polish
4%Scottish
1%European
Year of entry for the foreign-born population
152010 or later
252000 to 2009
01990 to 1999
0Before 1990
Facilities with environmental interests located in this zip code:
KY DAM VILLAGE STATE PARK MARINA (HWY 641 in GILBERTSVILLE, KY)
(Resource Conservation and Recovery Act (tracking hazardous waste)) Organizations: KY. STATE PARKS (CONTACT/OWNER)
KY DOP KY DAM VILLAGE ST PK SW (HWY 62 & 641 in GILBERTSVILLE, KY)
National Pollutant Discharge Elimination System NON-MAJOR (Tracking pollutant discharge elimination systems) - permit Business SIC classification: AMUSEMENT AND RECREATION SERVICES
KY LAKE FAMILY RESORT (7511 US 641 in GILBERTSVILLE, KY)
National Pollutant Discharge Elimination System NON-MAJOR (Tracking pollutant discharge elimination systems) - permit Business SIC classification: HOTELS AND MOTELS
MEYLAN INDUSTRIAL SERVICES (97 GREENUP ROAD in GILBERTSVILLE, KY)
TRANSPORTER (Resource Conservation and Recovery Act (tracking hazardous waste)) Organizations: MEYLAN ENTERPRISES INC. (CONTACT/OWNER)
Housing units lacking complete plumbing facilities: 2.0% Housing units lacking complete kitchen facilities: 2.0%
50.5%Utility gas
45.0%Electricity
4.2%Bottled, tank, or LP gas
Population in 1990: 3,285.
Place of birth for U.S.-born residents:
This state: 2,201
Northeast: 67
Midwest: 1,084
South: 445
West: 138
64% of the 42044 zip code residents lived in the same house 5 years ago. Out of people who lived in different houses, 33% lived in this county. Out of people who lived in different counties, 50% lived in Kentucky.
86% of the 42044 zip code residents lived in the same house 1 year ago. Out of people who lived in different houses, 27% moved from this county. Out of people who lived in different houses, 51% moved from different county within same state. Out of people who lived in different houses, 23% moved from different state.
Private vs. public school enrollment:
Students in private schools in grades 1 to 8 (elementary and middle school): 125
Here:
30.8%
Kentucky:
17.2%
Students in private schools in grades 9 to 12 (high school):
Here:
0.0%
Kentucky:
15.2%
Students in private undergraduate colleges:
Here:
0.0%
Kentucky:
19.6%
Occupation by median earnings in the past 12 months ($)
119,207Health diagnosing and treating practitioners and other technical occupations
71,883Business and financial operations occupations
70,396Construction and extraction occupations
55,074Fire fighting and prevention, and other protective service workers including supervisors
52,340Management occupations
39,656Health technologists and technicians
Top industries in this zip code by the number of employees in 2005:
Construction: Site Preparation Contractors (10-19: 1, 1-4: 1)
Construction: Water and Sewer Line and Related Structures Construction (10-19: 1)
Construction: New Single-Family Housing Construction (except Operative Builders) (5-9: 1, 1-4: 1)
Accommodation and Food Services: Recreational and Vacation Camps (except Campgrounds) (5-9: 1, 1-4: 1)
Real Estate and Rental and Leasing: Offices of Real Estate Agents and Brokers (1-4: 4)
Health Care and Social Assistance: Residential Mental Retardation Facilities (5-9: 1)
Construction: Poured Concrete Foundation and Structure Contractors (5-9: 1)
Fatal accident statistics in 2014:
Fatal accident count: 3
Vehicles involved in fatal accidents: 4
Fatal accidents caused by drunken drivers: 1
Fatalities: 4
Persons involved in fatal accidents: 4
Pedestrians involved in fatal accidents: 0
Fatal accident statistics in 2012:
Fatal accident count: 1
Vehicles involved in fatal accidents: 2
Fatal accidents caused by drunken drivers: 0
Fatalities: 1
Persons involved in fatal accidents: 2
Pedestrians involved in fatal accidents: 0
2002 - 2018 National Fire Incident Reporting System (NFIRS) incidents
According to the data from the years 2002 - 2018 the average number of fire incidents per year is 18. The highest number of reported fire incidents - 40 took place in 2012, and the least - 0 in 2005. The data has a rising trend.
When looking into fire subcategories, the most incidents belonged to: Structure Fires (47.0%), and Outside Fires (37.0%).
Fire incident types reported to NFIRS in Zip Code 42044

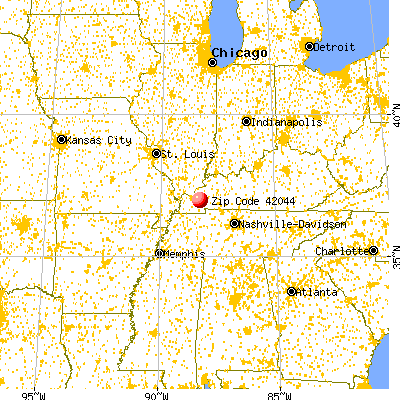


 Nearest zip codes: 42045, 42025, 42029, 42055, 42048, 42083.


 According to the data from the years 2002 - 2018 the average number of fire incidents per year is 18. The highest number of reported fire incidents - 40 took place in 2012, and the least - 0 in 2005. The data has a rising trend.
 When looking into fire subcategories, the most incidents belonged to: Structure Fires (47.0%), and Outside Fires (37.0%).