Estimated zip code population in 2022: 3,396 Zip code population in 2010: 4,117 Zip code population in 2000: 3,629
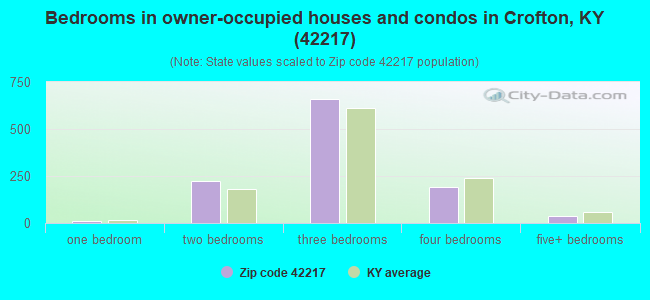
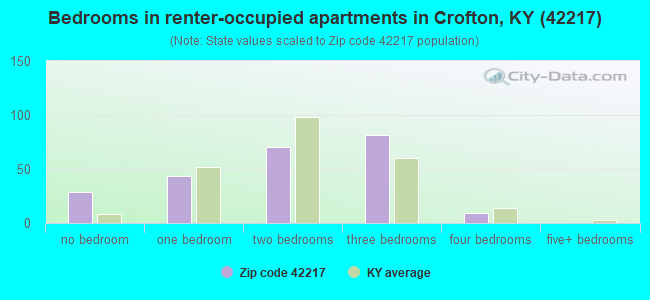
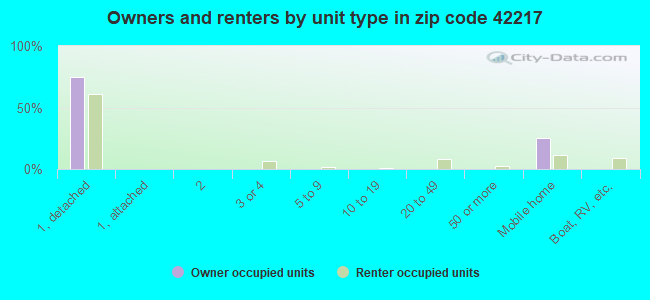
Houses and condos: 1,468 Renter-occupied apartments: 238
% of renters here:
18%
State:
31%
March 2022 cost of living index in zip code 42217: 81.4 (low, U.S. average is 100)
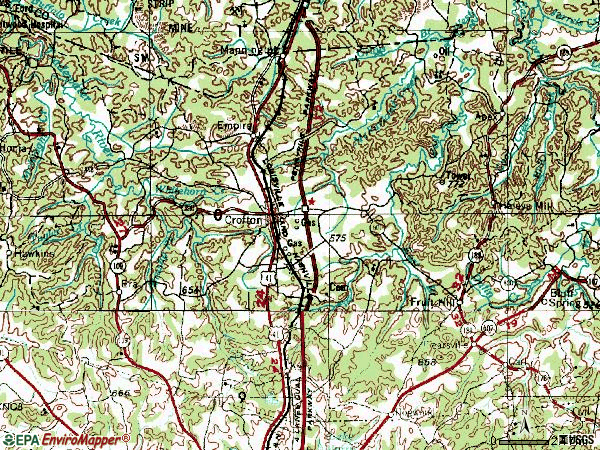
Land area: 159.4 sq. mi. Water area: 1.5 sq. mi.
Population density: 21 people per square mile
(very low).
OSM Map
General Map
Google Map
MSN Map
OSM Map
General Map
Google Map
MSN Map
OSM Map
General Map
Google Map
MSN Map
OSM Map
General Map
Google Map
MSN Map
Please wait while loading the map...
Real estate property taxes paid for housing units in 2022:
This zip code:
0.7% ($998)
Kentucky:
0.7% ($1,456)
Median real estate property taxes paid for housing units with mortgages in 2022: $1,278 (0.8%) Median real estate property taxes paid for housing units with no mortgage in 2022: $797 (0.7%)
Business Search- 14 Million verified businesses
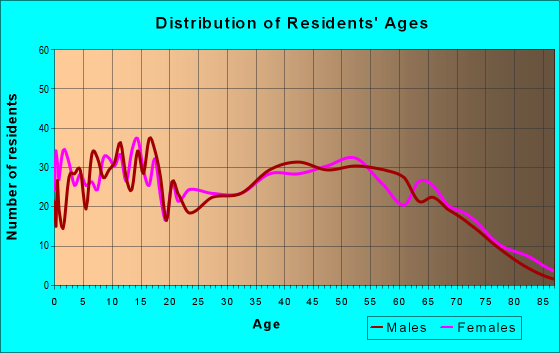
Males: 1,607
(47.3%)
Females: 1,789
(52.7%)
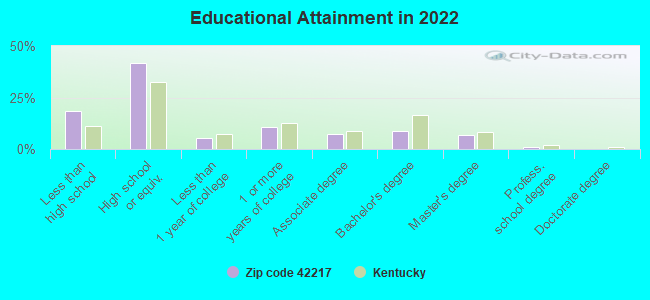
For population 25 years and over in 42217:
High school or higher: 79.9%
Bachelor's degree or higher: 16.5%
Graduate or professional degree: 8.1%
Unemployed: 4.3%
Mean travel time to work (commute): 28.0 minutes
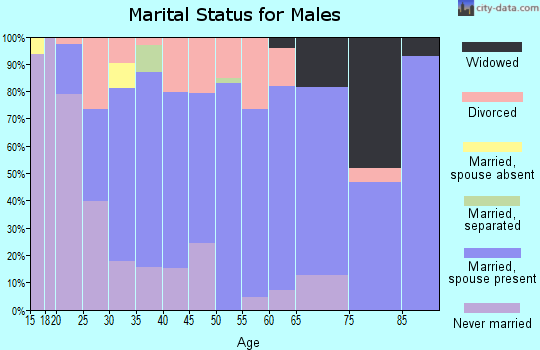
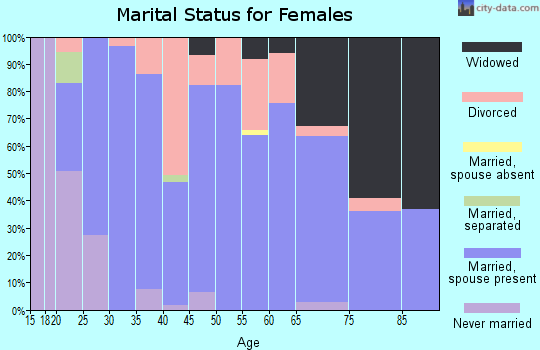
For population 15 years and over in 42217:
Never married: 21.8%
Now married: 57.0%
Separated: 0.7%
Widowed: 7.7%
Divorced: 12.8%
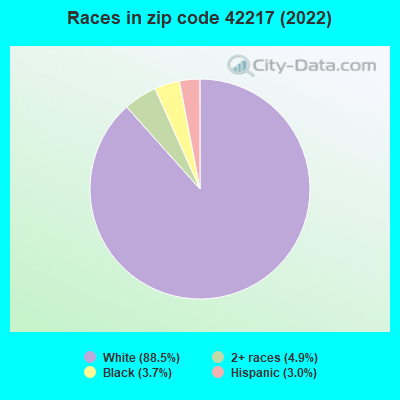
Zip code 42217 compared to state average:
Black race population percentage below state average.
Foreign-born population percentage significantly below state average.
Renting percentage below state average.
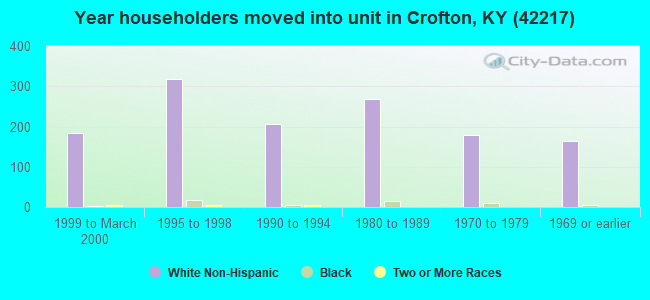
Length of stay since moving in significantly above state average.
Number of college students below state average.
Percentage of population with a bachelor's degree or higher below state average.
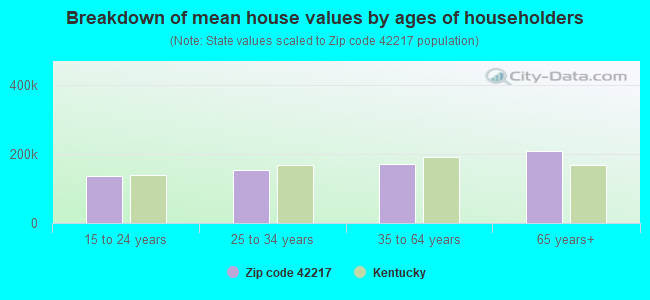
Estimated median house/condo value in 2022: $135,303
42217:
$135,303
Kentucky:
$196,300
According to our research of Kentucky and other state lists, there were 7 registered sex offenders living in 42217 zip code as of April 28, 2024. The ratio of all residents to sex offenders in zip code 42217 is 496 to 1. The ratio of registered sex offenders to all residents in this zip code is near the state average.
Median resident age:
This zip code:
42.2 years
Kentucky median age:
39.4 years
Average household size:
This zip code:
2.5 people
Kentucky:
2.4 people
Averages for the 2020 tax year for zip code 42217, filed in 2021:
Average Adjusted Gross Income (AGI) in 2020: $50,264 (Individual Income Tax Returns)
Here:
$50,264
State:
$61,342
Salary/wage: $42,883 (reported on 78.3% of returns)
Here:
$42,883
State:
$50,827
(% of AGI for various income ranges: 1232.4% for AGIs below $25k, 3731.7% for AGIs $25k-50k, 6577.6% for AGIs $50k-75k, 10100.0% for AGIs $75k-100k, 20898.8% for AGIs $100k-200k)
Taxable interest for individuals: $1,385 (reported on 21.7% of returns)
This zip code:
$1,385
Kentucky:
$1,441
(% of AGI for various income ranges: 29.7% for AGIs below $25k, 18.0% for AGIs $25k-50k, 25.3% for AGIs $50k-75k, 13.3% for AGIs $75k-100k, 315.0% for AGIs $100k-200k)
Ordinary dividends: $2,744 (reported on 10.2% of returns)
Here:
$2,744
State:
$7,388
(% of AGI for various income ranges: 15.7% for AGIs below $25k, 20.0% for AGIs $25k-50k, 67.6% for AGIs $50k-75k, 257.5% for AGIs $100k-200k)
Net capital gain/loss in AGI: +$6,262 (reported on 10.2% of returns)
Here:
+$6,262
State:
+$19,475
(% of AGI for various income ranges: 23.8% for AGIs below $25k, 23.7% for AGIs $25k-50k, 71.8% for AGIs $50k-75k, 901.2% for AGIs $100k-200k)
Profit/loss from business: +$10,724 (reported on 18.5% of returns)
Here:
+$10,724
State:
+$11,386
(% of AGI for various income ranges: 193.0% for AGIs below $25k, 222.0% for AGIs $25k-50k, 324.1% for AGIs $50k-75k, 632.2% for AGIs $75k-100k, 762.5% for AGIs $100k-200k)
Taxable individual retirement arrangement distribution: $12,720 (reported on 6.4% of returns)
42217:
$12,720
Kentucky:
$18,941
(% of AGI for various income ranges: 51.4% for AGIs below $25k, 70.0% for AGIs $25k-50k, 111.2% for AGIs $50k-75k, 853.8% for AGIs $100k-200k)
Total itemized deductions: $35,467 (reported on 1.9% of returns)
Here:
$35,467
State:
$32,473
(% of AGI for various income ranges: 1330.0% for AGIs $100k-200k)
Charity contributions: $19,100 (reported on 1.9% of returns)
Here:
$19,100
State:
$13,472
(% of AGI for various income ranges: 716.2% for AGIs $100k-200k)
Taxes paid: $6,075 (reported on 2.5% of returns)
42217:
$6,075
State:
$7,830
(% of AGI for various income ranges: 303.8% for AGIs $100k-200k)
Earned income credit: $2,330 (reported on 19.1% of returns)
Here:
$2,330
State:
$2,336
(% of AGI for various income ranges: 121.4% for AGIs below $25k, 83.3% for AGIs $25k-50k)
Percentage of individuals using paid preparers for their 2020 taxes: 93.6%
Here:
94%
State:
94%
(% for various income ranges: 93.0% for AGIs below $25k, 95.1% for AGIs $25k-50k, 96.0% for AGIs $50k-75k, 93.3% for AGIs $75k-100k, 93.8% for AGIs $100k-200k, 66.7% for AGIs over 200k)
Averages for the 2012 tax year for zip code 42217, filed in 2013:
Average Adjusted Gross Income (AGI) in 2012: $43,164 (Individual Income Tax Returns)
Here:
$43,164
State:
$50,814
Salary/wage: $37,963 (reported on 82.3% of returns)
Here:
$37,963
State:
$42,723
(% of AGI for various income ranges: 68.9% for AGIs below $25k, 77.0% for AGIs $25k-50k, 79.9% for AGIs $50k-75k, 80.4% for AGIs $75k-100k, 58.3% for AGIs $100k-200k)
Taxable interest for individuals: $1,397 (reported on 25.2% of returns)
This zip code:
$1,397
Kentucky:
$1,381
(% of AGI for various income ranges: 1.4% for AGIs below $25k, 0.9% for AGIs $25k-50k, 0.4% for AGIs $50k-75k, 0.4% for AGIs $75k-100k, 1.1% for AGIs $100k-200k)
Ordinary dividends: $1,900 (reported on 10.2% of returns)
Here:
$1,900
State:
$6,239
(% of AGI for various income ranges: 0.6% for AGIs below $25k, 0.3% for AGIs $25k-50k, 0.5% for AGIs $50k-75k, 0.4% for AGIs $75k-100k, 0.5% for AGIs $100k-200k)
Net capital gain/loss in AGI: +$8,853 (reported on 11.6% of returns)
Here:
+$8,853
State:
+$11,336
(% of AGI for various income ranges: 1.0% for AGIs below $25k, 1.7% for AGIs $25k-50k, 1.2% for AGIs $50k-75k, 0.6% for AGIs $75k-100k, 5.8% for AGIs $100k-200k)
Profit/loss from business: +$11,742 (reported on 17.7% of returns)
Here:
+$11,742
State:
+$10,862
(% of AGI for various income ranges: 10.6% for AGIs below $25k, 4.4% for AGIs $25k-50k, 3.1% for AGIs $50k-75k, 3.9% for AGIs $75k-100k, 4.6% for AGIs $100k-200k)
Taxable individual retirement arrangement distribution: $13,600 (reported on 6.1% of returns)
42217:
$13,600
Kentucky:
$14,296
(% of AGI for various income ranges: 2.2% for AGIs $25k-50k, 1.4% for AGIs $50k-75k, 6.7% for AGIs $75k-100k)
Total itemized deductions: $19,645 (24% of AGI, reported on 21.1% of returns)
Here:
$19,645
State:
$21,160
Here:
23.8% of AGI
State:
20.0% of AGI
(% of AGI for various income ranges: 4.0% for AGIs below $25k, 5.8% for AGIs $25k-50k, 9.4% for AGIs $50k-75k, 10.4% for AGIs $75k-100k, 15.0% for AGIs $100k-200k)
Charity contributions: $4,684 (reported on 17.0% of returns)
Here:
$4,684
State:
$4,303
(% of AGI for various income ranges: 0.6% for AGIs below $25k, 1.0% for AGIs $25k-50k, 2.0% for AGIs $50k-75k, 2.5% for AGIs $75k-100k, 2.5% for AGIs $100k-200k)
Taxes paid: $5,861 (reported on 21.1% of returns)
42217:
$5,861
State:
$8,496
(% of AGI for various income ranges: 0.5% for AGIs below $25k, 1.2% for AGIs $25k-50k, 2.5% for AGIs $50k-75k, 3.6% for AGIs $75k-100k, 5.2% for AGIs $100k-200k)
Earned income credit: $2,150 (reported on 21.8% of returns)
Here:
$2,150
State:
$2,273
(% of AGI for various income ranges: 6.4% for AGIs below $25k, 1.4% for AGIs $25k-50k)
Percentage of individuals using paid preparers for their 2012 taxes: 61.9%
Here:
62%
State:
60%
(% for various income ranges: 55.7% for AGIs below $25k, 63.2% for AGIs $25k-50k, 66.7% for AGIs $50k-75k, 69.2% for AGIs $75k-100k, 72.7% for AGIs $100k-200k)
Averages for the 2004 tax year for zip code 42217, filed in 2005:
Average Adjusted Gross Income (AGI) in 2004: $32,911 (Individual Income Tax Returns)
Here:
$32,911
State:
$41,540
Salary/wage: $31,121 (reported on 84.4% of returns)
Here:
$31,121
State:
$36,432
(% of AGI for various income ranges: 154.4% for AGIs below $10k, 73.7% for AGIs $10k-25k, 82.4% for AGIs $25k-50k, 81.9% for AGIs $50k-75k, 82.8% for AGIs $75k-100k, 60.4% for AGIs over 100k)
Taxable interest for individuals: $1,432 (reported on 33.4% of returns)
This zip code:
$1,432
Kentucky:
$1,571
(% of AGI for various income ranges: 12.9% for AGIs below $10k, 2.4% for AGIs $10k-25k, 1.1% for AGIs $25k-50k, 1.1% for AGIs $50k-75k, 0.2% for AGIs $75k-100k, 2.2% for AGIs over 100k)
Taxable dividends: $902 (reported on 14.0% of returns)
Here:
$902
State:
$3,453
(% of AGI for various income ranges: 3.7% for AGIs below $10k, 0.3% for AGIs $10k-25k, 0.2% for AGIs $25k-50k, 0.4% for AGIs $50k-75k, 0.2% for AGIs $75k-100k, 0.8% for AGIs over 100k)
Net capital gain/loss: +$5,819 (reported on 12.2% of returns)
Here:
+$5,819
State:
+$9,663
(% of AGI for various income ranges: 1.2% for AGIs below $10k, 0.8% for AGIs $10k-25k, 1.6% for AGIs $25k-50k, 2.4% for AGIs $50k-75k, 2.0% for AGIs $75k-100k, 5.4% for AGIs over 100k)
Profit/loss from business: +$7,678 (reported on 19.2% of returns)
Here:
+$7,678
State:
+$9,233
(% of AGI for various income ranges: 29.9% for AGIs below $10k, 7.9% for AGIs $10k-25k, 3.3% for AGIs $25k-50k, 3.5% for AGIs $50k-75k, 2.1% for AGIs $75k-100k, 4.9% for AGIs over 100k)
IRA payment deduction: $3,688 (reported on 2.1% of returns)
42217:
$3,688
Kentucky:
$2,955
Total itemized deductions: $14,090 (22% of AGI, reported on 20.1% of returns)
Here:
$14,090
State:
$17,474
Here:
22.5% of AGI
State:
21.0% of AGI
(% of AGI for various income ranges: 6.5% for AGIs $10k-25k, 5.1% for AGIs $25k-50k, 9.7% for AGIs $50k-75k, 13.3% for AGIs $75k-100k, 14.0% for AGIs over 100k)
Charity contributions deductions: $3,437 (5% of AGI, reported on 17.4% of returns)
Here:
$3,437
State:
$3,494
Here:
5.3% of AGI
State:
4.0% of AGI
(% of AGI for various income ranges: 1.1% for AGIs $10k-25k, 0.8% for AGIs $25k-50k, 2.5% for AGIs $50k-75k, 3.3% for AGIs $75k-100k, 2.4% for AGIs over 100k)
Total tax: $3,460 (reported on 73.5% of returns)
42217:
$3,460
State:
$6,162
(% of AGI for various income ranges: 7.4% for AGIs below $10k, 3.9% for AGIs $10k-25k, 6.1% for AGIs $25k-50k, 7.8% for AGIs $50k-75k, 10.2% for AGIs $75k-100k, 14.0% for AGIs over 100k)
Earned income credit: $1,701 (reported on 20.7% of returns)
Here:
$1,701
State:
$1,723
Percentage of individuals using paid preparers for their 2004 taxes: 71.6%
Here:
72%
State:
66%
(% for various income ranges: 66.6% for AGIs below $10k, 73.9% for AGIs $10k-25k, 71.1% for AGIs $25k-50k, 76.0% for AGIs $50k-75k, 70.2% for AGIs $75k-100k, 73.8% for AGIs over 100k)
Household received Food Stamps/SNAP in the past 12 months: 165 Household did not receive Food Stamps/SNAP in the past 12 months: 1,184
Women who had a birth in the past 12 months: 43 (38 now married, 4 unmarried) Women who did not have a birth in the past 12 months: 675 (333 now married, 343 unmarried)
Housing units in zip code 42217 with a mortgage: 437 (37 second mortgage, 38 both second mortgage and home equity loan) Houses without a mortgage: 12
Median monthly owner costs for units with a mortgage: $1,081 Median monthly owner costs for units without a mortgage: $438
Residents with income below the poverty level in 2022:
This zip code:
13.0%
Whole state:
16.5%
Residents with income below 50% of the poverty level in 2022:
This zip code:
5.8%
Whole state:
9.0%
Median number of rooms in houses and condos:
Here:
6.1
State:
6.4
Median number of rooms in apartments:
Here:
4.8
State:
4.4
Notable locations in this zip code not listed on our city pages
Notable locations in zip code 42217: Crofton Volunteer Fire Department Station 2 Substation (A), Northwest Volunteer Fire Department (B), Mannington Volunteer Fire Department (C). Display/hide their locations on the map
Churches in zip code 42217 include: Judge Chapel (A), Macedonia Church (B), Old Petersburg Church (C), New Palestine Baptist Church (D), Castleberry General Baptist Church (E), Coles Chapel (F). Display/hide their locations on the map
Cemeteries: Hamby Cemetery (1), Long Cemetery (2), Harmony Grove Cemetery (3), Cansler Cemetery (4), Ridge Top Cemetery (5), Adams Cemetery (6), Reynolds Cemetery (7). Display/hide their locations on the map
Streams, rivers, and creeks: Dripping Spring Branch (A), Tugler Creek (B), Coal Creek (C), Thompson Creek (D), Castleberry Creek (E), Camp Creek (F), Bull Creek (G), Middle Branch Pond River (H), Brushy Fork (I). Display/hide their locations on the map
Size of family households: 458 2-persons, 208 3-persons, 104 4-persons, 101 5-persons, 27 6-persons, 3 7-or-more-persons
Size of nonfamily households: 433 1-person, 14 2-persons, 1 3-persons
613 married couples with children.
86 single-parent households (35 men, 51 women).
90.4% of residents of 42217 zip code speak English at home.
2.8% of residents speak Spanish at home (75% very well, 25% not well).
6.7% of residents speak other Indo-European language at home (71% very well, 27% well, 2% not well).
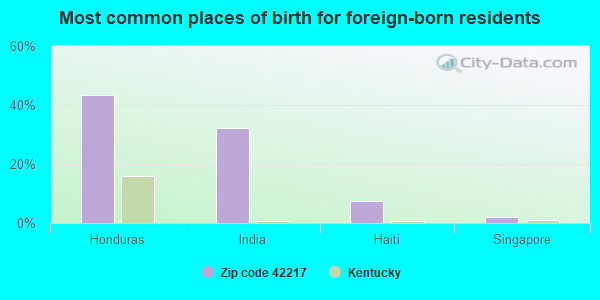
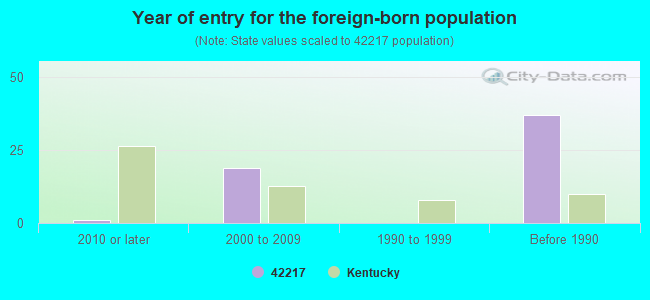
Foreign born population: 51 (1.5%) (46.4% of them are naturalized citizens)
This zip code:
1.5%
Whole state:
4.0%
43%Honduras
32%India
8%Haiti
2%Singapore
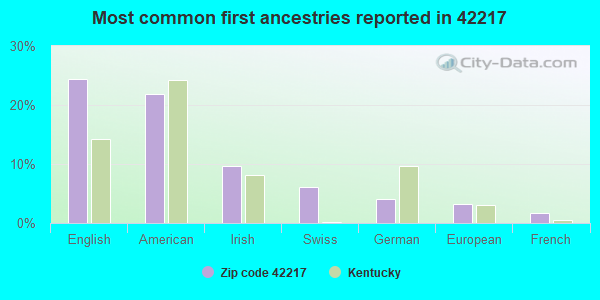
24%English
22%American
10%Irish
6%Swiss
4%German
3%European
2%French
Year of entry for the foreign-born population
12010 or later
192000 to 2009
01990 to 1999
37Before 1990
Facilities with environmental interests located in this zip code:
MARVIN YOUNG ENTERPRISES (PETE MORGAN LEASE, UIC WELL FIELD) (N/A in CROFTON, KY)
Housing units lacking complete plumbing facilities: 3.6% Housing units lacking complete kitchen facilities: 3.3%
56.6%Electricity
22.6%Utility gas
14.6%Bottled, tank, or LP gas
5.1%Wood
0.8%Other fuel
Population in 1990: 3,531. Population change in the 1990s: +98 (+2.8%).
Place of birth for U.S.-born residents:
This state: 2,433
Northeast: 49
Midwest: 393
South: 318
West: 136
67% of the 42217 zip code residents lived in the same house 5 years ago. Out of people who lived in different houses, 62% lived in this county. Out of people who lived in different counties, 50% lived in Kentucky.
91% of the 42217 zip code residents lived in the same house 1 year ago. Out of people who lived in different houses, 60% moved from this county. Out of people who lived in different houses, 4% moved from different county within same state. Out of people who lived in different houses, 36% moved from different state.
Private vs. public school enrollment:
Students in private schools in grades 1 to 8 (elementary and middle school): 41
Here:
13.3%
Kentucky:
17.2%
Students in private schools in grades 9 to 12 (high school): 19
Here:
12.7%
Kentucky:
15.2%
Students in private undergraduate colleges:
Here:
0.0%
Kentucky:
19.6%
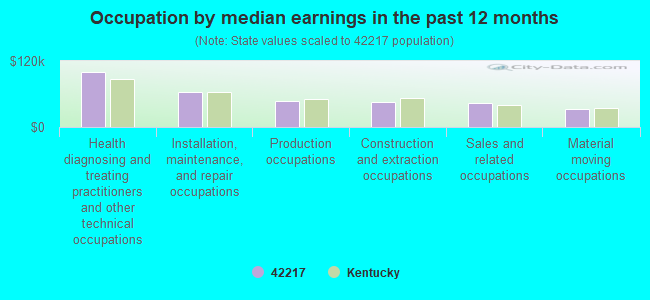
Occupation by median earnings in the past 12 months ($)
99,581Health diagnosing and treating practitioners and other technical occupations
63,127Installation, maintenance, and repair occupations
47,181Production occupations
45,306Construction and extraction occupations
43,265Sales and related occupations
32,529Material moving occupations
Top industries in this zip code by the number of employees in 2005:
Other Services (except Public Administration): Barber Shops (20-49 employees: 1 establishment)
Other Services (except Public Administration): Other Similar Organizations (except Business, Professional, Labor, and Political Organizations) (10-19: 1)
Other Services (except Public Administration): Religious Organizations (1-4: 4)
Health Care and Social Assistance: Offices of Dentists (5-9: 1)
Construction: Site Preparation Contractors (5-9: 1)
People in group quarters in 2000:
3 people in agriculture workers' dormitories on farms
2 people in other group homes
Fatal accident statistics in 2012:
Fatal accident count: 1
Vehicles involved in fatal accidents: 1
Fatal accidents caused by drunken drivers: 1
Fatalities: 2
Persons involved in fatal accidents: 2
Pedestrians involved in fatal accidents: 0
Fatal accident statistics in 2011:
Fatal accident count: 2
Vehicles involved in fatal accidents: 2
Fatal accidents caused by drunken drivers: 0
Fatalities: 2
Persons involved in fatal accidents: 3
Pedestrians involved in fatal accidents: 0
Home Mortgage Disclosure Act Aggregated Statistics For Year 2009 (Based on 4 partial tracts)
A) FHA, FSA/RHS & VA Home Purchase Loans
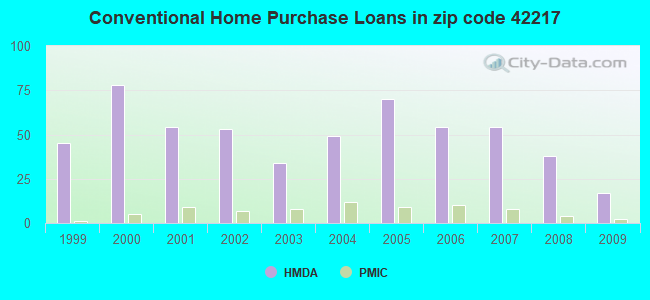
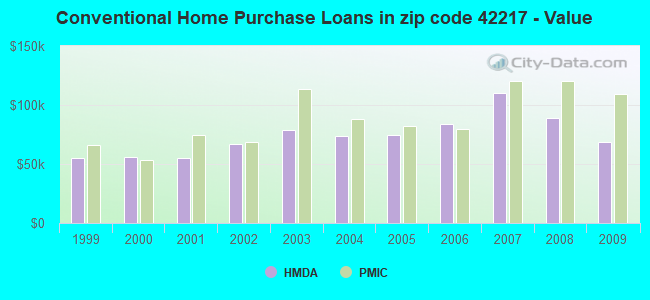
B) Conventional Home Purchase Loans
C) Refinancings
D) Home Improvement Loans
F) Non-occupant Loans on < 5 Family Dwellings (A B C & D)
G) Loans On Manufactured Home Dwelling (A B C & D)
Number
Average Value
Number
Average Value
Number
Average Value
Number
Average Value
Number
Average Value
Number
Average Value
LOANS ORIGINATED
19
$111,094
17
$68,386
74
$98,192
11
$41,853
11
$55,914
16
$39,492
APPLICATIONS APPROVED, NOT ACCEPTED
1
$132,860
1
$12,480
10
$77,226
0
$0
0
$0
3
$70,453
APPLICATIONS DENIED
2
$134,525
8
$37,710
42
$92,255
6
$47,310
6
$50,585
14
$57,829
APPLICATIONS WITHDRAWN
2
$156,670
2
$92,450
9
$108,559
1
$101,860
0
$0
2
$115,150
FILES CLOSED FOR INCOMPLETENESS
1
$91,900
0
$0
6
$96,567
0
$0
0
$0
2
$52,770
Aggregated Statistics For Year 2008 (Based on 4 partial tracts)
A) FHA, FSA/RHS & VA Home Purchase Loans
B) Conventional Home Purchase Loans
C) Refinancings
D) Home Improvement Loans
F) Non-occupant Loans on < 5 Family Dwellings (A B C & D)
G) Loans On Manufactured Home Dwelling (A B C & D)
Number
Average Value
Number
Average Value
Number
Average Value
Number
Average Value
Number
Average Value
Number
Average Value
LOANS ORIGINATED
11
$100,502
38
$89,219
50
$99,280
21
$40,005
19
$53,676
14
$47,084
APPLICATIONS APPROVED, NOT ACCEPTED
0
$0
2
$78,625
12
$66,837
3
$20,800
1
$10,820
3
$37,440
APPLICATIONS DENIED
1
$115,650
8
$73,191
35
$99,606
17
$19,816
3
$62,383
13
$44,857
APPLICATIONS WITHDRAWN
0
$0
3
$158,117
18
$103,882
0
$0
0
$0
2
$80,750
FILES CLOSED FOR INCOMPLETENESS
1
$160,580
0
$0
4
$99,925
0
$0
0
$0
1
$73,080
Aggregated Statistics For Year 2007 (Based on 4 partial tracts)
A) FHA, FSA/RHS & VA Home Purchase Loans
B) Conventional Home Purchase Loans
C) Refinancings
D) Home Improvement Loans
F) Non-occupant Loans on < 5 Family Dwellings (A B C & D)
G) Loans On Manufactured Home Dwelling (A B C & D)
Number
Average Value
Number
Average Value
Number
Average Value
Number
Average Value
Number
Average Value
Number
Average Value
LOANS ORIGINATED
16
$95,271
54
$110,348
63
$84,747
19
$39,326
16
$117,586
28
$55,193
APPLICATIONS APPROVED, NOT ACCEPTED
0
$0
4
$108,918
16
$66,171
2
$5,260
1
$38,270
2
$102,605
APPLICATIONS DENIED
1
$136,190
19
$99,637
42
$75,571
18
$34,772
2
$230,850
14
$49,682
APPLICATIONS WITHDRAWN
3
$86,360
5
$203,230
13
$96,073
1
$134,780
1
$106,500
2
$79,165
FILES CLOSED FOR INCOMPLETENESS
0
$0
4
$83,318
3
$77,873
1
$49,820
1
$33,220
1
$96,330
Aggregated Statistics For Year 2006 (Based on 4 partial tracts)
A) FHA, FSA/RHS & VA Home Purchase Loans
B) Conventional Home Purchase Loans
C) Refinancings
D) Home Improvement Loans
F) Non-occupant Loans on < 5 Family Dwellings (A B C & D)
G) Loans On Manufactured Home Dwelling (A B C & D)
Number
Average Value
Number
Average Value
Number
Average Value
Number
Average Value
Number
Average Value
Number
Average Value
LOANS ORIGINATED
11
$94,033
54
$84,020
60
$69,416
22
$24,476
11
$54,517
16
$35,820
APPLICATIONS APPROVED, NOT ACCEPTED
2
$107,400
6
$57,167
14
$70,486
2
$74,915
2
$67,475
4
$71,090
APPLICATIONS DENIED
1
$83,040
30
$61,818
56
$68,575
12
$40,267
6
$37,515
16
$48,962
APPLICATIONS WITHDRAWN
0
$0
5
$73,388
29
$83,730
3
$30,380
1
$29,890
1
$55,360
FILES CLOSED FOR INCOMPLETENESS
0
$0
2
$79,040
8
$112,428
0
$0
0
$0
0
$0
Aggregated Statistics For Year 2005 (Based on 4 partial tracts)
A) FHA, FSA/RHS & VA Home Purchase Loans
B) Conventional Home Purchase Loans
C) Refinancings
D) Home Improvement Loans
F) Non-occupant Loans on < 5 Family Dwellings (A B C & D)
G) Loans On Manufactured Home Dwelling (A B C & D)
Number
Average Value
Number
Average Value
Number
Average Value
Number
Average Value
Number
Average Value
Number
Average Value
LOANS ORIGINATED
8
$97,196
70
$74,491
76
$80,148
27
$29,654
15
$53,231
23
$54,969
APPLICATIONS APPROVED, NOT ACCEPTED
1
$170,510
4
$137,998
16
$75,868
1
$18,820
1
$38,750
1
$26,620
APPLICATIONS DENIED
2
$86,945
34
$83,473
52
$72,269
14
$33,361
4
$48,768
29
$46,704
APPLICATIONS WITHDRAWN
1
$65,320
6
$118,445
29
$78,193
2
$251,890
4
$76,240
4
$78,058
FILES CLOSED FOR INCOMPLETENESS
0
$0
3
$36,210
11
$84,608
1
$60,900
1
$79,040
1
$70,860
Aggregated Statistics For Year 2004 (Based on 4 partial tracts)
A) FHA, FSA/RHS & VA Home Purchase Loans
B) Conventional Home Purchase Loans
C) Refinancings
D) Home Improvement Loans
F) Non-occupant Loans on < 5 Family Dwellings (A B C & D)
G) Loans On Manufactured Home Dwelling (A B C & D)
Number
Average Value
Number
Average Value
Number
Average Value
Number
Average Value
Number
Average Value
Number
Average Value
LOANS ORIGINATED
11
$92,125
49
$74,108
106
$72,359
18
$18,132
9
$46,377
17
$45,334
APPLICATIONS APPROVED, NOT ACCEPTED
1
$42,070
4
$61,625
16
$59,360
1
$22,140
1
$23,250
6
$48,633
APPLICATIONS DENIED
3
$47,843
29
$40,915
48
$74,127
15
$26,633
3
$48,347
32
$40,545
APPLICATIONS WITHDRAWN
0
$0
6
$71,080
30
$101,359
2
$15,250
1
$121,470
2
$69,115
FILES CLOSED FOR INCOMPLETENESS
0
$0
2
$120,225
3
$116,520
0
$0
0
$0
0
$0
Aggregated Statistics For Year 2003 (Based on 4 partial tracts)
A) FHA, FSA/RHS & VA Home Purchase Loans
B) Conventional Home Purchase Loans
C) Refinancings
D) Home Improvement Loans
F) Non-occupant Loans on < 5 Family Dwellings (A B C & D)
Number
Average Value
Number
Average Value
Number
Average Value
Number
Average Value
Number
Average Value
LOANS ORIGINATED
14
$113,109
34
$78,549
124
$65,567
16
$51,069
17
$60,399
APPLICATIONS APPROVED, NOT ACCEPTED
2
$95,535
8
$47,558
19
$62,355
2
$17,055
0
$0
APPLICATIONS DENIED
6
$88,402
32
$60,636
48
$53,576
15
$26,616
2
$59,560
APPLICATIONS WITHDRAWN
1
$66,560
4
$72,908
24
$88,417
0
$0
0
$0
FILES CLOSED FOR INCOMPLETENESS
1
$122,900
1
$110,720
8
$54,081
0
$0
0
$0
Aggregated Statistics For Year 2002 (Based on 4 partial tracts)
A) FHA, FSA/RHS & VA Home Purchase Loans
B) Conventional Home Purchase Loans
C) Refinancings
D) Home Improvement Loans
F) Non-occupant Loans on < 5 Family Dwellings (A B C & D)
Number
Average Value
Number
Average Value
Number
Average Value
Number
Average Value
Number
Average Value
LOANS ORIGINATED
4
$61,785
53
$67,354
104
$60,544
13
$12,852
8
$29,086
APPLICATIONS APPROVED, NOT ACCEPTED
0
$0
9
$64,031
9
$57,533
4
$5,535
2
$54,255
APPLICATIONS DENIED
3
$129,300
44
$42,017
56
$67,484
12
$10,059
5
$67,596
APPLICATIONS WITHDRAWN
1
$52,420
8
$46,104
34
$61,684
0
$0
4
$54,192
FILES CLOSED FOR INCOMPLETENESS
0
$0
2
$48,220
3
$62,090
0
$0
0
$0
Aggregated Statistics For Year 2001 (Based on 4 partial tracts)
A) FHA, FSA/RHS & VA Home Purchase Loans
B) Conventional Home Purchase Loans
C) Refinancings
D) Home Improvement Loans
F) Non-occupant Loans on < 5 Family Dwellings (A B C & D)
Number
Average Value
Number
Average Value
Number
Average Value
Number
Average Value
Number
Average Value
LOANS ORIGINATED
7
$84,796
54
$55,501
84
$65,612
21
$21,556
7
$89,577
APPLICATIONS APPROVED, NOT ACCEPTED
0
$0
6
$56,707
15
$56,065
2
$5,955
0
$0
APPLICATIONS DENIED
0
$0
38
$57,594
60
$59,370
18
$7,198
2
$64,770
APPLICATIONS WITHDRAWN
1
$73,080
8
$55,445
22
$69,286
3
$10,803
2
$179,365
FILES CLOSED FOR INCOMPLETENESS
0
$0
0
$0
4
$96,602
0
$0
0
$0
Aggregated Statistics For Year 2000 (Based on 4 partial tracts)
A) FHA, FSA/RHS & VA Home Purchase Loans
B) Conventional Home Purchase Loans
C) Refinancings
D) Home Improvement Loans
F) Non-occupant Loans on < 5 Family Dwellings (A B C & D)
Number
Average Value
Number
Average Value
Number
Average Value
Number
Average Value
Number
Average Value
LOANS ORIGINATED
3
$51,417
78
$55,855
49
$50,762
21
$10,403
8
$25,405
APPLICATIONS APPROVED, NOT ACCEPTED
0
$0
14
$43,481
14
$40,369
3
$8,680
1
$5,540
APPLICATIONS DENIED
2
$74,350
54
$47,403
54
$40,607
9
$23,193
1
$34,110
APPLICATIONS WITHDRAWN
1
$21,630
5
$51,238
28
$41,104
2
$36,735
0
$0
FILES CLOSED FOR INCOMPLETENESS
0
$0
0
$0
5
$43,494
0
$0
0
$0
Aggregated Statistics For Year 1999 (Based on 2 partial tracts)
A) FHA, FSA/RHS & VA Home Purchase Loans
B) Conventional Home Purchase Loans
C) Refinancings
D) Home Improvement Loans
F) Non-occupant Loans on < 5 Family Dwellings (A B C & D)
Detailed PMIC statistics for the following Tracts:2010.00
, 2011.00
2002 - 2018 National Fire Incident Reporting System (NFIRS) incidents
Based on the data from the years 2002 - 2018 the average number of fire incidents per year is 25. The highest number of fire incidents - 46 took place in 2016, and the least - 6 in 2002. The data has a growing trend.
When looking into fire subcategories, the most incidents belonged to: Outside Fires (42.7%), and Structure Fires (38.9%).
Fire incident types reported to NFIRS in Zip Code 42217
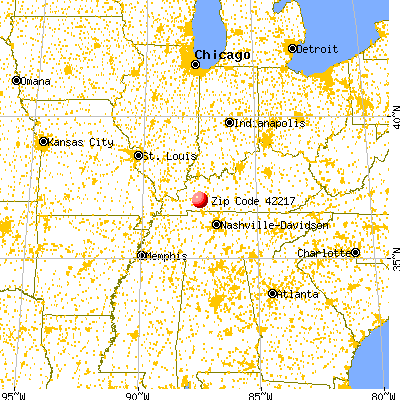


 Nearest zip codes: 42442, 42240, 42464, 42453, 42440, 42215.


 Based on the data from the years 2002 - 2018 the average number of fire incidents per year is 25. The highest number of fire incidents - 46 took place in 2016, and the least - 6 in 2002. The data has a growing trend.
 When looking into fire subcategories, the most incidents belonged to: Outside Fires (42.7%), and Structure Fires (38.9%).