Estimated zip code population in 2022: 6,143 Zip code population in 2010: 6,844 Zip code population in 2000: 6,069
Houses and condos: 2,742 Renter-occupied apartments: 507
% of renters here:
21%
State:
31%
March 2022 cost of living index in zip code 42220: 81.3 (low, U.S. average is 100)
Land area: 177.0 sq. mi. Water area: 1.0 sq. mi.
Population density: 35 people per square mile
(very low).
OSM Map
General Map
Google Map
MSN Map
OSM Map
General Map
Google Map
MSN Map
OSM Map
General Map
Google Map
MSN Map
OSM Map
General Map
Google Map
MSN Map
Please wait while loading the map...
Real estate property taxes paid for housing units in 2022:
This zip code:
0.6% ($852)
Kentucky:
0.7% ($1,456)
Median real estate property taxes paid for housing units with mortgages in 2022: $1,157 (0.7%) Median real estate property taxes paid for housing units with no mortgage in 2022: $501 (0.5%)
Business Search- 14 Million verified businesses
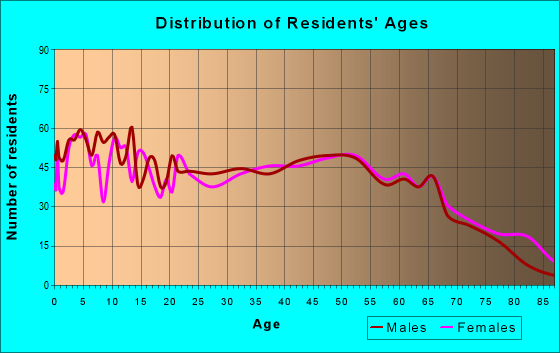
Males: 3,228
(52.6%)
Females: 2,914
(47.4%)
For population 25 years and over in 42220:
High school or higher: 83.8%
Bachelor's degree or higher: 18.7%
Graduate or professional degree: 6.8%
Unemployed: 2.9%
Mean travel time to work (commute): 24.8 minutes
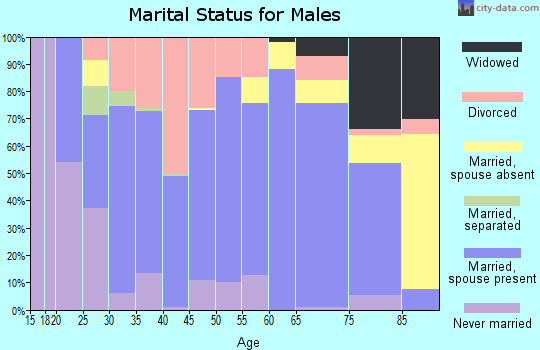
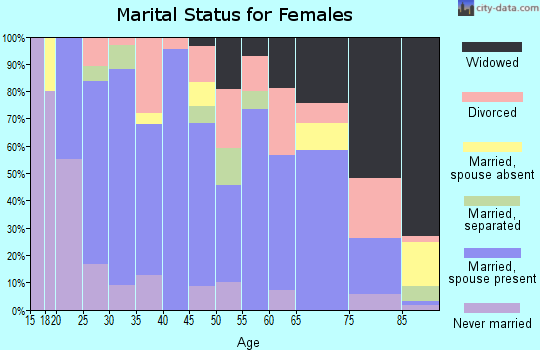
For population 15 years and over in 42220:
Never married: 19.6%
Now married: 62.0%
Separated: 1.6%
Widowed: 6.2%
Divorced: 10.7%
Zip code 42220 compared to state average:
Renting percentage below state average.
Length of stay since moving in significantly above state average.
Averages for the 2020 tax year for zip code 42220, filed in 2021:
Average Adjusted Gross Income (AGI) in 2020: $47,952 (Individual Income Tax Returns)
Here:
$47,952
State:
$61,342
Salary/wage: $40,772 (reported on 77.1% of returns)
Here:
$40,772
State:
$50,827
(% of AGI for various income ranges: 1248.8% for AGIs below $25k, 3816.0% for AGIs $25k-50k, 6461.8% for AGIs $50k-75k, 9558.7% for AGIs $75k-100k, 16470.8% for AGIs $100k-200k)
Taxable interest for individuals: $1,715 (reported on 21.8% of returns)
This zip code:
$1,715
Kentucky:
$1,441
(% of AGI for various income ranges: 20.0% for AGIs below $25k, 27.6% for AGIs $25k-50k, 49.3% for AGIs $50k-75k, 86.7% for AGIs $75k-100k, 106.9% for AGIs $100k-200k)
Ordinary dividends: $3,893 (reported on 9.6% of returns)
Here:
$3,893
State:
$7,388
(% of AGI for various income ranges: 6.4% for AGIs below $25k, 23.5% for AGIs $25k-50k, 27.1% for AGIs $50k-75k, 130.7% for AGIs $75k-100k, 206.9% for AGIs $100k-200k)
Net capital gain/loss in AGI: +$14,943 (reported on 10.0% of returns)
Here:
+$14,943
State:
+$19,475
(% of AGI for various income ranges: 11.3% for AGIs below $25k, 45.6% for AGIs $25k-50k, 129.3% for AGIs $50k-75k, 171.3% for AGIs $75k-100k, 837.7% for AGIs $100k-200k)
Profit/loss from business: +$14,040 (reported on 18.9% of returns)
Here:
+$14,040
State:
+$11,386
(% of AGI for various income ranges: 189.5% for AGIs below $25k, 167.3% for AGIs $25k-50k, 363.6% for AGIs $50k-75k, 258.0% for AGIs $75k-100k, 953.1% for AGIs $100k-200k)
Taxable individual retirement arrangement distribution: $13,035 (reported on 6.1% of returns)
42220:
$13,035
Kentucky:
$18,941
(% of AGI for various income ranges: 27.0% for AGIs below $25k, 27.1% for AGIs $25k-50k, 110.4% for AGIs $50k-75k, 346.7% for AGIs $75k-100k, 792.3% for AGIs $100k-200k)
Total itemized deductions: $32,950 (reported on 3.6% of returns)
Here:
$32,950
State:
$32,473
(% of AGI for various income ranges: 81.7% for AGIs below $25k, 213.2% for AGIs $50k-75k, 951.5% for AGIs $100k-200k)
Charity contributions: $15,100 (reported on 3.2% of returns)
Here:
$15,100
State:
$13,472
(% of AGI for various income ranges: 94.3% for AGIs $50k-75k, 842.3% for AGIs $100k-200k)
Taxes paid: $7,180 (reported on 3.6% of returns)
42220:
$7,180
State:
$7,830
(% of AGI for various income ranges: 8.3% for AGIs below $25k, 50.7% for AGIs $50k-75k, 250.8% for AGIs $100k-200k)
Earned income credit: $2,396 (reported on 24.3% of returns)
Here:
$2,396
State:
$2,336
(% of AGI for various income ranges: 142.9% for AGIs below $25k, 96.2% for AGIs $25k-50k)
Percentage of individuals using paid preparers for their 2020 taxes: 90.7%
Here:
91%
State:
94%
(% for various income ranges: 88.4% for AGIs below $25k, 91.8% for AGIs $25k-50k, 92.7% for AGIs $50k-75k, 95.7% for AGIs $75k-100k, 92.0% for AGIs $100k-200k, 83.3% for AGIs over 200k)
Averages for the 2012 tax year for zip code 42220, filed in 2013:
Average Adjusted Gross Income (AGI) in 2012: $42,870 (Individual Income Tax Returns)
Here:
$42,870
State:
$50,814
Salary/wage: $34,081 (reported on 81.3% of returns)
Here:
$34,081
State:
$42,723
(% of AGI for various income ranges: 72.5% for AGIs below $25k, 79.5% for AGIs $25k-50k, 76.8% for AGIs $50k-75k, 74.0% for AGIs $75k-100k, 62.8% for AGIs $100k-200k, 16.8% for AGIs over 200k)
Taxable interest for individuals: $1,431 (reported on 26.5% of returns)
This zip code:
$1,431
Kentucky:
$1,381
(% of AGI for various income ranges: 1.4% for AGIs below $25k, 0.9% for AGIs $25k-50k, 0.7% for AGIs $50k-75k, 0.7% for AGIs $75k-100k, 1.0% for AGIs $100k-200k, 0.6% for AGIs over 200k)
Ordinary dividends: $2,374 (reported on 10.5% of returns)
Here:
$2,374
State:
$6,239
(% of AGI for various income ranges: 0.4% for AGIs below $25k, 0.3% for AGIs $25k-50k, 0.5% for AGIs $50k-75k, 0.2% for AGIs $75k-100k, 1.3% for AGIs $100k-200k, 1.0% for AGIs over 200k)
Net capital gain/loss in AGI: +$6,250 (reported on 12.5% of returns)
Here:
+$6,250
State:
+$11,336
(% of AGI for various income ranges: 0.9% for AGIs below $25k, 0.8% for AGIs $25k-50k, 1.8% for AGIs $50k-75k, 2.8% for AGIs $75k-100k, 2.5% for AGIs $100k-200k, 2.6% for AGIs over 200k)
Profit/loss from business: +$12,472 (reported on 18.3% of returns)
Here:
+$12,472
State:
+$10,862
(% of AGI for various income ranges: 9.7% for AGIs below $25k, 3.7% for AGIs $25k-50k, 2.6% for AGIs $50k-75k, 4.2% for AGIs $75k-100k, 14.2% for AGIs $100k-200k)
Taxable individual retirement arrangement distribution: $11,747 (reported on 5.8% of returns)
42220:
$11,747
Kentucky:
$14,296
(% of AGI for various income ranges: 1.3% for AGIs below $25k, 1.1% for AGIs $25k-50k, 3.2% for AGIs $50k-75k, 3.9% for AGIs $100k-200k)
Total itemized deductions: $18,300 (18% of AGI, reported on 19.1% of returns)
Here:
$18,300
State:
$21,160
Here:
18.4% of AGI
State:
20.0% of AGI
(% of AGI for various income ranges: 3.8% for AGIs below $25k, 6.4% for AGIs $25k-50k, 8.9% for AGIs $50k-75k, 10.2% for AGIs $75k-100k, 12.4% for AGIs $100k-200k, 7.9% for AGIs over 200k)
Charity contributions: $5,518 (reported on 15.6% of returns)
Here:
$5,518
State:
$4,303
(% of AGI for various income ranges: 0.5% for AGIs below $25k, 1.4% for AGIs $25k-50k, 1.9% for AGIs $50k-75k, 2.5% for AGIs $75k-100k, 4.0% for AGIs $100k-200k, 2.1% for AGIs over 200k)
Taxes paid: $6,106 (reported on 19.1% of returns)
42220:
$6,106
State:
$8,496
(% of AGI for various income ranges: 0.5% for AGIs below $25k, 1.3% for AGIs $25k-50k, 2.2% for AGIs $50k-75k, 3.7% for AGIs $75k-100k, 4.8% for AGIs $100k-200k, 4.5% for AGIs over 200k)
Earned income credit: $2,274 (reported on 25.3% of returns)
Here:
$2,274
State:
$2,273
(% of AGI for various income ranges: 7.2% for AGIs below $25k, 1.5% for AGIs $25k-50k)
Percentage of individuals using paid preparers for their 2012 taxes: 67.3%
Here:
67%
State:
60%
(% for various income ranges: 63.3% for AGIs below $25k, 67.6% for AGIs $25k-50k, 65.7% for AGIs $50k-75k, 77.8% for AGIs $75k-100k, 84.6% for AGIs $100k-200k, 100.0% for AGIs over 200k)
Averages for the 2004 tax year for zip code 42220, filed in 2005:
Average Adjusted Gross Income (AGI) in 2004: $33,006 (Individual Income Tax Returns)
Here:
$33,006
State:
$41,540
Salary/wage: $29,974 (reported on 82.6% of returns)
Here:
$29,974
State:
$36,432
(% of AGI for various income ranges: 83.3% for AGIs below $10k, 76.0% for AGIs $10k-25k, 80.9% for AGIs $25k-50k, 82.5% for AGIs $50k-75k, 71.6% for AGIs $75k-100k, 46.6% for AGIs over 100k)
Taxable interest for individuals: $1,567 (reported on 34.7% of returns)
This zip code:
$1,567
Kentucky:
$1,571
(% of AGI for various income ranges: 5.0% for AGIs below $10k, 2.1% for AGIs $10k-25k, 1.4% for AGIs $25k-50k, 1.2% for AGIs $50k-75k, 1.5% for AGIs $75k-100k, 2.2% for AGIs over 100k)
Taxable dividends: $1,997 (reported on 14.3% of returns)
Here:
$1,997
State:
$3,453
(% of AGI for various income ranges: 0.4% for AGIs below $10k, 0.5% for AGIs $10k-25k, 0.4% for AGIs $25k-50k, 0.4% for AGIs $50k-75k, 1.8% for AGIs $75k-100k, 2.5% for AGIs over 100k)
Net capital gain/loss: +$7,639 (reported on 11.3% of returns)
Here:
+$7,639
State:
+$9,663
(% of AGI for various income ranges: 1.3% for AGIs below $10k, 0.5% for AGIs $10k-25k, 0.9% for AGIs $25k-50k, 1.5% for AGIs $50k-75k, 3.7% for AGIs $75k-100k, 10.6% for AGIs over 100k)
Profit/loss from business: +$8,792 (reported on 18.3% of returns)
Here:
+$8,792
State:
+$9,233
(% of AGI for various income ranges: 19.7% for AGIs below $10k, 6.6% for AGIs $10k-25k, 3.9% for AGIs $25k-50k, 2.4% for AGIs $50k-75k, 1.9% for AGIs $75k-100k, 9.4% for AGIs over 100k)
IRA payment deduction: $3,321 (reported on 2.1% of returns)
42220:
$3,321
Kentucky:
$2,955
Self-employed pension: $15,400 (reported on 0.6% of returns)
Here:
$15,400
Kentucky:
$14,996
Total itemized deductions: $14,075 (22% of AGI, reported on 19.8% of returns)
Here:
$14,075
State:
$17,474
Here:
22.0% of AGI
State:
21.0% of AGI
(% of AGI for various income ranges: 6.0% for AGIs $10k-25k, 7.1% for AGIs $25k-50k, 10.0% for AGIs $50k-75k, 11.4% for AGIs $75k-100k, 10.6% for AGIs over 100k)
Charity contributions deductions: $4,146 (6% of AGI, reported on 16.3% of returns)
Here:
$4,146
State:
$3,494
Here:
6.2% of AGI
State:
4.0% of AGI
(% of AGI for various income ranges: 0.9% for AGIs $10k-25k, 1.5% for AGIs $25k-50k, 2.4% for AGIs $50k-75k, 2.8% for AGIs $75k-100k, 3.6% for AGIs over 100k)
Total tax: $3,743 (reported on 75.3% of returns)
42220:
$3,743
State:
$6,162
(% of AGI for various income ranges: 3.7% for AGIs below $10k, 4.4% for AGIs $10k-25k, 6.3% for AGIs $25k-50k, 8.2% for AGIs $50k-75k, 10.2% for AGIs $75k-100k, 18.8% for AGIs over 100k)
Earned income credit: $1,743 (reported on 22.0% of returns)
Here:
$1,743
State:
$1,723
Percentage of individuals using paid preparers for their 2004 taxes: 74.6%
Here:
75%
State:
66%
(% for various income ranges: 72.5% for AGIs below $10k, 70.9% for AGIs $10k-25k, 75.1% for AGIs $25k-50k, 78.0% for AGIs $50k-75k, 85.0% for AGIs $75k-100k, 91.0% for AGIs over 100k)
Household received Food Stamps/SNAP in the past 12 months: 306 Household did not receive Food Stamps/SNAP in the past 12 months: 2,146
Women who had a birth in the past 12 months: 97 (95 now married, 0 unmarried) Women who did not have a birth in the past 12 months: 1,197 (780 now married, 422 unmarried)
Housing units in zip code 42220 with a mortgage: 1,126 (81 second mortgage, 92 home equity loan, 4 both second mortgage and home equity loan) Median monthly owner costs for units with a mortgage: $978 Median monthly owner costs for units without a mortgage: $360
Residents with income below the poverty level in 2022:
This zip code:
13.4%
Whole state:
16.5%
Residents with income below 50% of the poverty level in 2022:
This zip code:
9.0%
Whole state:
9.0%
Median number of rooms in houses and condos:
Here:
6.1
State:
6.4
Median number of rooms in apartments:
Here:
5.3
State:
4.4
Notable locations in this zip code not listed on our city pages
Notable locations in zip code 42220: Pea Ridge (A), Elkton Fire Department (B), Clifty Volunteer Fire Department (C), Allegre Volunteer Fire Department (D), Todd County Ambulance Service (E). Display/hide their locations on the map
Churches in zip code 42220 include: Johnson Chapel (A), Pleasant Hill Church (B), Providence Methodist Church (C), Stokes Chapel (D), Tabernacle Church (E), Taylors Chapel (F), Bethel Church (G), Collier Spring General Baptist Church (H), Emberry Church (I). Display/hide their locations on the map
Cemeteries: Hale Cemetery (1), Tutt Cemetery (2), Porter Cemetery (3), Pepper Cemetery (4), Johnson Cemetery (5), Glenwood Cemetery (6), Goshen Cemetery (7). Display/hide their locations on the map
Streams, rivers, and creeks: North Fork Whippoorwill Creek (A), Cow Creek (B), Wolf Branch (C), Caney Creek (D), Steward Branch (E), Slim Jimmy Branch (F), Kate Branch (G), Horse Creek (H), Shelton Branch (I). Display/hide their locations on the map
In group quarters: 172 (-1 institutionalized population)
Size of family households: 721 2-persons, 416 3-persons, 307 4-persons, 94 5-persons, 54 6-persons, 63 7-or-more-persons
Size of nonfamily households: 652 1-person, 126 2-persons, 12 3-persons
1,046 married couples with children.
177 single-parent households (77 men, 100 women).
89.8% of residents of 42220 zip code speak English at home.
4.9% of residents speak Spanish at home (40% very well, 25% well, 28% not well, 7% not at all).
5.2% of residents speak other Indo-European language at home (54% very well, 37% well, 10% not well).
Foreign born population: 168 (2.7%) (8.0% of them are naturalized citizens)
This zip code:
2.7%
Whole state:
4.0%
90%Honduras
22%American
9%English
9%Irish
4%German
3%Scotch-Irish
3%Swiss
2%African
Year of entry for the foreign-born population
1212010 or later
392000 to 2009
211990 to 1999
0Before 1990
Facilities with environmental interests located in this zip code:
NORTH TODD ELEMENTARY SCHOOL (7300 GREENVILLE RD in ELKTON, KY)
(National Center for Education Statistics) - STATE ID-110551005 National Pollutant Discharge Elimination System NON-MAJOR (Tracking pollutant discharge elimination systems) - permit Business SIC classification: ELEMENTARY AND SECONDARY SCHOOLS Organizations: NORTH TODD ELEM SCHOOL (CONTACT/OWNER)
, TODD COUNTY (SCHOOL DISTRICT)
Alternative names: NORTH TODD ELEM SCHOOL
ARDCO INC (701 W MAIN ST in ELKTON, KY)
CRITERIA AND HAZARDOUS AIR POLLUTANT INVENTORY (Inventory of air pollution sources) National Pollutant Discharge Elimination System NON-MAJOR (Tracking pollutant discharge elimination systems) - permit Business SIC classification: METAL DOORS, SASH, FRAMES, MOLDING, AND TRIM; MANAGEMENT SERVICES
MCKINNEY LOG & LUMBER INC (3036 HADDEN MILL RD in ELKTON, KY)
National Pollutant Discharge Elimination System NON-MAJOR (Tracking pollutant discharge elimination systems) - permit Business SIC classification: SAWMILLS AND PLANING MILLS, GENERAL
MILLIKEN MEMORIAL COMMUNITY HOUSE (208 WEST MAIN STREET in ELKTON, KY)
(Resource Conservation and Recovery Act (tracking hazardous waste)) Organizations: MILLIKEN MEMORIAL COMMUNITY HOUSE ASSC. (CONTACT/OWNER)
PIGGLY WIGGLY #78 (202 W MAIN ST in ELKTON, KY)
(Resource Conservation and Recovery Act (tracking hazardous waste)) Organizations: SUREWAY GROUP (CONTACT/OWNER)
POWER REAL ESTATE (201 S MAIN ST in ELKTON, KY)
(Resource Conservation and Recovery Act (tracking hazardous waste)) Organizations: BUDDY POWER (JUDY POWER ) (CONTACT/OWNER)
KTC TODD CO MAINT GARAGE (520 E JEFFERSON DAVIS HWY in ELKTON, KY)
National Pollutant Discharge Elimination System NON-MAJOR (Tracking pollutant discharge elimination systems) - permit Business SIC classification: TERMINAL AND SERVICE FACILITIES FOR MOTOR VEHICLE PASSENGER TRANSPORTATION
LIBRALTER PLASTICS (ELK FORK RD @ INDUSTRIAL DR in ELKTON, KY)
National Pollutant Discharge Elimination System NON-MAJOR (Tracking pollutant discharge elimination systems) - permit Business SIC classification: MANAGEMENT SERVICES
BP PIPELINE XYLENE SPILL (HWY 189 & FLATROCK ROAD in ALLEGRE, KY)
SUPERFUND (Superfund database)
COMMERCIAL FURNISHINGS, INC. (508 STREETS AVE in ELKTON, KY)
CRITERIA AND HAZARDOUS AIR POLLUTANT INVENTORY (Inventory of air pollution sources) Business SIC classification: WOOD HOUSEHOLD FURNITURE, EXCEPT UPHOLSTERED Alternative names: DBA AMERICAN HERITAGE OAK CO
PENNYRILE RECC, ELKTON DISTRICT (P.O. BOX 536 in ELKTON, KY)
COMPLIANCE ACTIVITY (Tracking inspections of insecticide, fungicide, and rodenticide, and toxic substances)
Housing units lacking complete plumbing facilities: 4.2% Housing units lacking complete kitchen facilities: 3.6%
53.0%Electricity
21.9%Utility gas
21.1%Bottled, tank, or LP gas
3.5%Wood
0.6%Other fuel
Population in 1990: 7,207.
Place of birth for U.S.-born residents:
This state: 3,720
Northeast: 386
Midwest: 459
South: 1,374
West: 52
60% of the 42220 zip code residents lived in the same house 5 years ago. Out of people who lived in different houses, 48% lived in this county. Out of people who lived in different counties, 50% lived in Kentucky.
93% of the 42220 zip code residents lived in the same house 1 year ago. Out of people who lived in different houses, 62% moved from this county. Out of people who lived in different houses, 26% moved from different county within same state. Out of people who lived in different houses, 11% moved from different state.
Private vs. public school enrollment:
Students in private schools in grades 1 to 8 (elementary and middle school): 220
Here:
43.8%
Kentucky:
17.2%
Students in private schools in grades 9 to 12 (high school):
Here:
0.0%
Kentucky:
15.2%
Students in private undergraduate colleges: 29
Here:
23.7%
Kentucky:
19.6%
Occupation by median earnings in the past 12 months ($)
78,066Health diagnosing and treating practitioners and other technical occupations
60,199Transportation occupations
58,420Sales and related occupations
55,631Management occupations
46,524Production occupations
46,317Community and social service occupations
Top industries in this zip code by the number of employees in 2005:
Other Services (except Public Administration): Religious Organizations (10-19: 1, 5-9: 1, 1-4: 9)
Other Services (except Public Administration): Commercial and Industrial Machinery and Equipment (except Automotive and Electronic) Repair and Maintenance (20-49: 1)
People in group quarters in 2010:
123 people in local jails and other municipal confinement facilities
72 people in nursing facilities/skilled-nursing facilities
People in group quarters in 2000:
93 people in nursing homes
33 people in local jails and other confinement facilities (including police lockups)
Fatal accident statistics in 2014:
Fatal accident count: 1
Vehicles involved in fatal accidents: 2
Fatal accidents caused by drunken drivers: 0
Fatalities: 1
Persons involved in fatal accidents: 3
Pedestrians involved in fatal accidents: 0
Fatal accident statistics in 2012:
Fatal accident count: 1
Vehicles involved in fatal accidents: 2
Fatal accidents caused by drunken drivers: 0
Fatalities: 1
Persons involved in fatal accidents: 4
Pedestrians involved in fatal accidents: 0
2002 - 2018 National Fire Incident Reporting System (NFIRS) incidents
Based on the data from the years 2002 - 2018 the average number of fire incidents per year is 22. The highest number of fire incidents - 38 took place in 2016, and the least - 14 in 2006. The data has a growing trend.
When looking into fire subcategories, the most incidents belonged to: Structure Fires (49.1%), and Outside Fires (36.6%).
Fire incident types reported to NFIRS in Zip Code 42220


 Nearest zip codes: 42280, 42234, 42286, 42204, 42266, 42265.


 Based on the data from the years 2002 - 2018 the average number of fire incidents per year is 22. The highest number of fire incidents - 38 took place in 2016, and the least - 14 in 2006. The data has a growing trend.
 When looking into fire subcategories, the most incidents belonged to: Structure Fires (49.1%), and Outside Fires (36.6%).