Estimated zip code population in 2022: 949 Zip code population in 2010: 1,407 Zip code population in 2000: 1,583
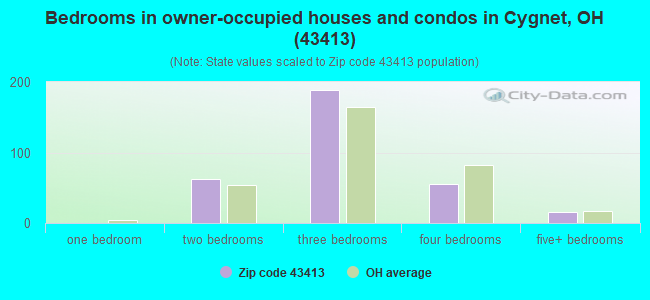
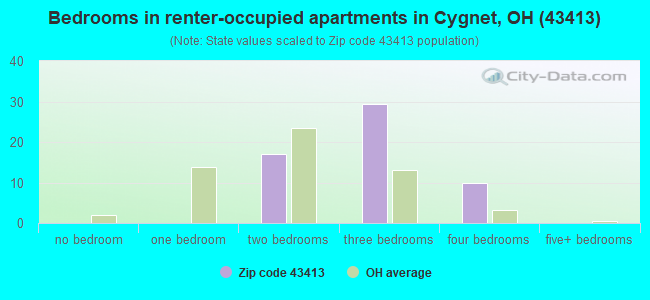
Houses and condos: 395 Renter-occupied apartments: 57
% of renters here:
15%
State:
33%
March 2022 cost of living index in zip code 43413: 83.3 (low, U.S. average is 100)
Land area: 32.2 sq. mi. Water area: 0.0 sq. mi.
Population density: 29 people per square mile
(very low).
OSM Map
General Map
Google Map
MSN Map
OSM Map
General Map
Google Map
MSN Map
OSM Map
General Map
Google Map
MSN Map
OSM Map
General Map
Google Map
MSN Map
Please wait while loading the map...
Real estate property taxes paid for housing units in 2022:
This zip code:
1.1% ($1,484)
Ohio:
1.3% ($2,639)
Median real estate property taxes paid for housing units with mortgages in 2022: $1,432 (1.0%) Median real estate property taxes paid for housing units with no mortgage in 2022: $1,591 (1.2%)
Business Search- 14 Million verified businesses
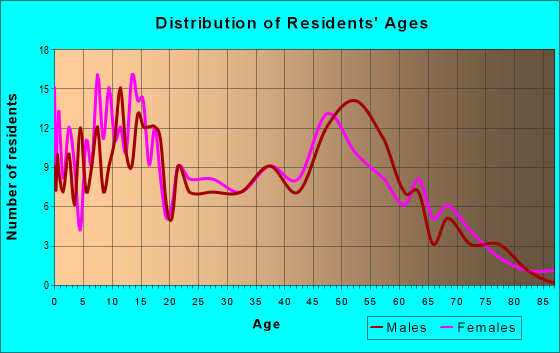
Males: 461
(48.6%)
Females: 487
(51.4%)
For population 25 years and over in 43413:
High school or higher: 87.4%
Bachelor's degree or higher: 13.0%
Graduate or professional degree: 5.0%
Unemployed: 1.4%
Mean travel time to work (commute): 23.0 minutes
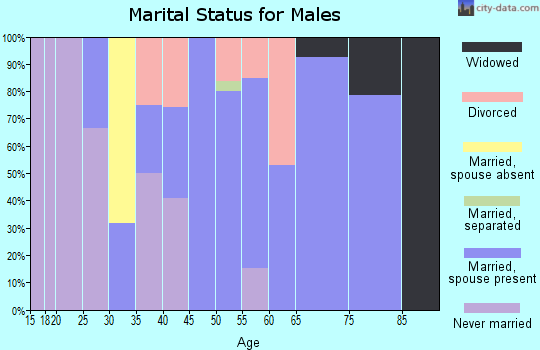
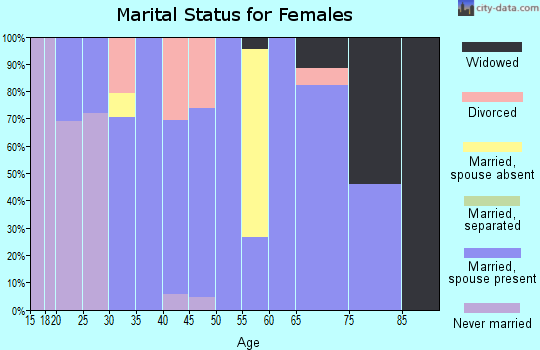
For population 15 years and over in 43413:
Never married: 27.9%
Now married: 57.7%
Separated: 0.1%
Widowed: 5.6%
Divorced: 8.6%
Zip code 43413 compared to state average:
Unemployed percentage below state average.
Black race population percentage significantly below state average.
Foreign-born population percentage significantly below state average.
Renting percentage below state average.
Length of stay since moving in above state average.
Percentage of population with a bachelor's degree or higher significantly below state average.
Averages for the 2020 tax year for zip code 43413, filed in 2021:
Average Adjusted Gross Income (AGI) in 2020: $57,028 (Individual Income Tax Returns)
Here:
$57,028
State:
$67,288
Salary/wage: $48,380 (reported on 83.1% of returns)
Here:
$48,380
State:
$55,628
(% of AGI for various income ranges: 1191.3% for AGIs below $25k, 3455.3% for AGIs $25k-50k, 6191.1% for AGIs $50k-75k, 9684.0% for AGIs $75k-100k, 17448.3% for AGIs $100k-200k)
Taxable interest for individuals: $614 (reported on 19.7% of returns)
This zip code:
$614
Ohio:
$1,518
(% of AGI for various income ranges: 8.0% for AGIs below $25k, 7.1% for AGIs $25k-50k, 34.4% for AGIs $50k-75k, 51.7% for AGIs $100k-200k)
Ordinary dividends: $2,340 (reported on 14.1% of returns)
Here:
$2,340
State:
$7,167
(% of AGI for various income ranges: 26.0% for AGIs below $25k, 77.8% for AGIs $50k-75k, 208.3% for AGIs $100k-200k)
Net capital gain/loss in AGI: +$2,067 (reported on 12.7% of returns)
Here:
+$2,067
State:
+$18,919
(% of AGI for various income ranges: 2.0% for AGIs below $25k, 43.3% for AGIs $50k-75k, 240.0% for AGIs $100k-200k)
Profit/loss from business: +$9,678 (reported on 12.7% of returns)
Here:
+$9,678
State:
+$13,744
(% of AGI for various income ranges: 270.0% for AGIs $25k-50k, 824.0% for AGIs $75k-100k)
Taxable individual retirement arrangement distribution: $11,550 (reported on 8.5% of returns)
43413:
$11,550
Ohio:
$18,876
(% of AGI for various income ranges: 180.6% for AGIs $25k-50k, 772.0% for AGIs $75k-100k)
Earned income credit: $2,200 (reported on 9.9% of returns)
Here:
$2,200
State:
$2,304
(% of AGI for various income ranges: 36.7% for AGIs below $25k, 58.2% for AGIs $25k-50k)
Percentage of individuals using paid preparers for their 2020 taxes: 94.4%
Here:
94%
State:
94%
(% for various income ranges: 90.0% for AGIs below $25k, 100.0% for AGIs $25k-50k, 92.3% for AGIs $50k-75k, 100.0% for AGIs $75k-100k, 90.0% for AGIs $100k-200k)
Averages for the 2012 tax year for zip code 43413, filed in 2013:
Average Adjusted Gross Income (AGI) in 2012: $45,748 (Individual Income Tax Returns)
Here:
$45,748
State:
$54,926
Salary/wage: $38,050 (reported on 84.1% of returns)
Here:
$38,050
State:
$45,869
(% of AGI for various income ranges: 76.0% for AGIs below $25k, 76.9% for AGIs $25k-50k, 77.1% for AGIs $50k-75k, 76.0% for AGIs $75k-100k, 50.2% for AGIs $100k-200k)
Taxable interest for individuals: $407 (reported on 21.7% of returns)
This zip code:
$407
Ohio:
$1,297
(% of AGI for various income ranges: 0.6% for AGIs below $25k, 0.2% for AGIs $25k-50k, 0.3% for AGIs $50k-75k)
Ordinary dividends: $720 (reported on 14.5% of returns)
Here:
$720
State:
$5,821
(% of AGI for various income ranges: 0.5% for AGIs $25k-50k, 0.2% for AGIs $50k-75k, 0.4% for AGIs $75k-100k)
Net capital gain/loss in AGI: +$1,643 (reported on 10.1% of returns)
Here:
+$1,643
State:
+$11,232
(% of AGI for various income ranges: 0.4% for AGIs $25k-50k, 1.6% for AGIs $75k-100k)
Profit/loss from business: +$5,133 (reported on 13.0% of returns)
Here:
+$5,133
State:
+$12,773
(% of AGI for various income ranges: 3.0% for AGIs below $25k, 1.7% for AGIs $25k-50k, 3.2% for AGIs $50k-75k)
Taxable individual retirement arrangement distribution: $9,729 (reported on 10.1% of returns)
43413:
$9,729
Ohio:
$14,511
(% of AGI for various income ranges: 3.8% for AGIs $25k-50k, 5.3% for AGIs $50k-75k)
Total itemized deductions: $15,794 (19% of AGI, reported on 24.6% of returns)
Here:
$15,794
State:
$21,278
Here:
19.0% of AGI
State:
18.8% of AGI
(% of AGI for various income ranges: 9.1% for AGIs $25k-50k, 10.1% for AGIs $50k-75k, 10.0% for AGIs $75k-100k, 8.8% for AGIs $100k-200k)
Charity contributions: $1,958 (reported on 17.4% of returns)
Here:
$1,958
State:
$3,943
(% of AGI for various income ranges: 0.4% for AGIs $25k-50k, 0.9% for AGIs $50k-75k, 1.1% for AGIs $75k-100k, 1.0% for AGIs $100k-200k)
Taxes paid: $6,218 (reported on 24.6% of returns)
43413:
$6,218
State:
$9,568
(% of AGI for various income ranges: 2.2% for AGIs $25k-50k, 3.6% for AGIs $50k-75k, 3.8% for AGIs $75k-100k, 5.2% for AGIs $100k-200k)
Earned income credit: $2,427 (reported on 15.9% of returns)
Here:
$2,427
State:
$2,285
(% of AGI for various income ranges: 5.8% for AGIs below $25k, 1.1% for AGIs $25k-50k)
Percentage of individuals using paid preparers for their 2012 taxes: 56.5%
Here:
57%
State:
51%
(% for various income ranges: 44.0% for AGIs below $25k, 70.0% for AGIs $25k-50k, 58.3% for AGIs $50k-75k, 57.1% for AGIs $75k-100k, 60.0% for AGIs $100k-200k)
Averages for the 2004 tax year for zip code 43413, filed in 2005:
Average Adjusted Gross Income (AGI) in 2004: $35,646 (Individual Income Tax Returns)
Here:
$35,646
State:
$44,480
Salary/wage: $33,533 (reported on 87.3% of returns)
Here:
$33,533
State:
$39,198
(% of AGI for various income ranges: 99.6% for AGIs below $10k, 77.3% for AGIs $10k-25k, 82.8% for AGIs $25k-50k, 81.7% for AGIs $50k-75k, 82.7% for AGIs $75k-100k)
Taxable interest for individuals: $1,021 (reported on 36.0% of returns)
This zip code:
$1,021
Ohio:
$1,532
(% of AGI for various income ranges: 1.9% for AGIs below $10k, 3.1% for AGIs $10k-25k, 1.4% for AGIs $25k-50k, 0.5% for AGIs $50k-75k, 0.2% for AGIs $75k-100k)
Taxable dividends: $794 (reported on 15.2% of returns)
Here:
$794
State:
$3,496
(% of AGI for various income ranges: 0.9% for AGIs below $10k, 0.6% for AGIs $10k-25k, 0.5% for AGIs $25k-50k, 0.2% for AGIs $50k-75k, 0.1% for AGIs $75k-100k)
Net capital gain/loss: +$1,161 (reported on 9.3% of returns)
Here:
+$1,161
State:
+$8,582
(% of AGI for various income ranges: -0.9% for AGIs below $10k, 0.6% for AGIs $25k-50k, 0.4% for AGIs $50k-75k, 0.1% for AGIs $75k-100k)
Profit/loss from business: +$4,720 (reported on 11.2% of returns)
Here:
+$4,720
State:
+$10,813
Total itemized deductions: $12,848 (23% of AGI, reported on 29.6% of returns)
Here:
$12,848
State:
$17,503
Here:
23.4% of AGI
State:
20.8% of AGI
(% of AGI for various income ranges: 8.3% for AGIs $10k-25k, 9.7% for AGIs $25k-50k, 10.5% for AGIs $50k-75k, 14.1% for AGIs $75k-100k)
Charity contributions deductions: $1,430 (3% of AGI, reported on 22.5% of returns)
Here:
$1,430
State:
$3,087
Here:
2.5% of AGI
State:
3.4% of AGI
(% of AGI for various income ranges: 0.4% for AGIs $10k-25k, 0.6% for AGIs $25k-50k, 1.3% for AGIs $50k-75k, 1.2% for AGIs $75k-100k)
Total tax: $3,699 (reported on 77.5% of returns)
43413:
$3,699
State:
$6,781
(% of AGI for various income ranges: 2.6% for AGIs below $10k, 4.4% for AGIs $10k-25k, 6.8% for AGIs $25k-50k, 8.1% for AGIs $50k-75k, 11.8% for AGIs $75k-100k)
Earned income credit: $1,545 (reported on 11.5% of returns)
Here:
$1,545
State:
$1,696
Percentage of individuals using paid preparers for their 2004 taxes: 54.9%
Here:
55%
State:
55%
(% for various income ranges: 38.3% for AGIs below $10k, 51.0% for AGIs $10k-25k, 59.7% for AGIs $25k-50k, 66.4% for AGIs $50k-75k, 58.1% for AGIs $75k-100k)
Household received Food Stamps/SNAP in the past 12 months: 5 Household did not receive Food Stamps/SNAP in the past 12 months: 372
Women who had a birth in the past 12 months: 2 (3 now married, 0 unmarried) Women who did not have a birth in the past 12 months: 199 (103 now married, 96 unmarried)
Housing units in zip code 43413 with a mortgage: 193 (3 second mortgage) Houses without a mortgage: 8
Median monthly owner costs for units with a mortgage: $1,262 Median monthly owner costs for units without a mortgage: $443
Residents with income below the poverty level in 2022:
This zip code:
12.7%
Whole state:
13.4%
Residents with income below 50% of the poverty level in 2022:
This zip code:
6.6%
Whole state:
7.0%
Median number of rooms in houses and condos:
Here:
6.6
State:
6.7
Median number of rooms in apartments:
Here:
5.4
State:
4.4
Notable locations in this zip code not listed on our city pages
Notable locations in zip code 43413: Tank Siding (A), Jerry City Fire Department (B), Cygnet Fire Department (C), Cygnet Branch Wayne Public Library (D). Display/hide their locations on the map
Size of family households: 87 2-persons, 61 3-persons, 72 4-persons, 19 5-persons, 3 6-persons
Size of nonfamily households: 118 1-person, 14 2-persons
142 married couples with children.
74 single-parent households (11 men, 63 women).
98.3% of residents of 43413 zip code speak English at home.
1.3% of residents speak Spanish at home (100% very well).
Foreign born population: 0 (0.0%)
:
0.0%
Whole state:
5.0%
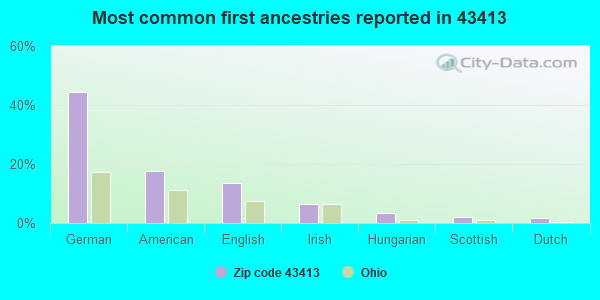
44%German
18%American
14%English
6%Irish
4%Hungarian
2%Scottish
2%Dutch
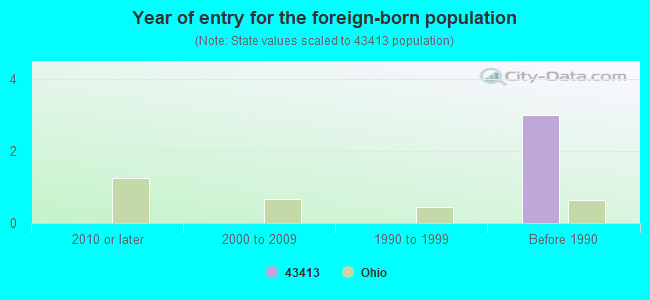
Year of entry for the foreign-born population
02010 or later
02000 to 2009
01990 to 1999
3Before 1990
Facilities with environmental interests located in this zip code:
ALLTEL - CYGNET (6489 DIXIE HWY in CYGNET, OH)
(Integrated Compliance Information System) - ICIS-HQ-2000-6004, FORMAL ENFORCEMENT ACTION
Housing units lacking complete plumbing facilities: 0.7% Housing units lacking complete kitchen facilities: 0.6%
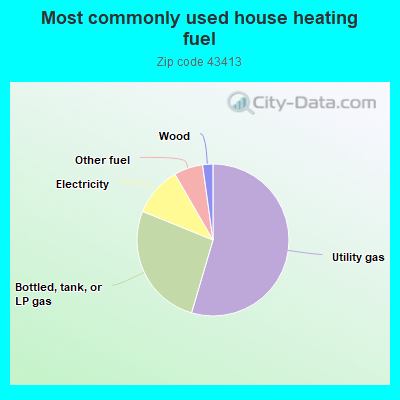
55.0%Utility gas
26.8%Bottled, tank, or LP gas
10.6%Electricity
6.2%Other fuel
2.2%Wood
Population in 1990: 1,516. Population change in the 1990s: +67 (+4.4%).
Place of birth for U.S.-born residents:
This state: 854
Northeast: 36
Midwest: 13
South: 23
West: 16
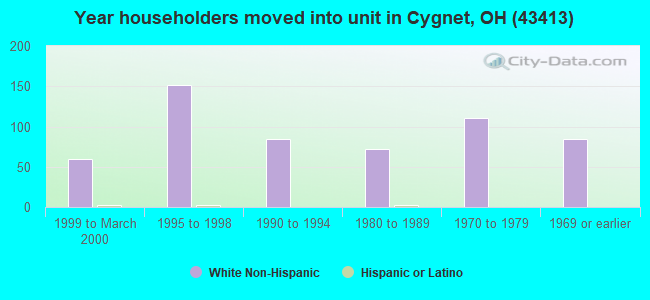
65% of the 43413 zip code residents lived in the same house 5 years ago. Out of people who lived in different houses, 69% lived in this county. Out of people who lived in different counties, 50% lived in Ohio.
90% of the 43413 zip code residents lived in the same house 1 year ago. Out of people who lived in different houses, 58% moved from this county. Out of people who lived in different houses, 18% moved from different county within same state. Out of people who lived in different houses, 21% moved from different state.
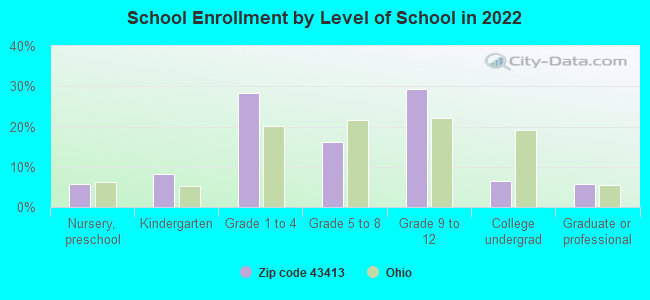
Private vs. public school enrollment:
Students in private schools in grades 1 to 8 (elementary and middle school):
Here:
0.0%
Ohio:
16.0%
Students in private schools in grades 9 to 12 (high school):
Here:
0.0%
Ohio:
13.1%
Students in private undergraduate colleges:
Here:
0.0%
Ohio:
22.3%
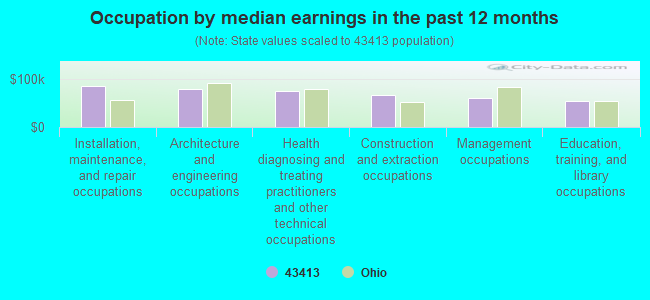
Occupation by median earnings in the past 12 months ($)
84,196Installation, maintenance, and repair occupations
79,198Architecture and engineering occupations
73,791Health diagnosing and treating practitioners and other technical occupations
65,360Construction and extraction occupations
59,228Management occupations
53,117Education, training, and library occupations
Top industries in this zip code by the number of employees in 2005:
Construction: New Single-Family Housing Construction (except Operative Builders) (20-49 employees: 1 establishment, 10-19 employees: 1 establishment)
Utilities: Natural Gas Distribution (10-19: 1)
Construction: Poured Concrete Foundation and Structure Contractors (10-19: 1)
Wholesale Trade: Recyclable Material Merchant Wholesalers (1-4: 1)
Wholesale Trade: Grain and Field Bean Merchant Wholesalers (1-4: 1)
Educational Services: Apprenticeship Training (1-4: 1)
Fatal accident statistics in 2010:
Fatal accident count: 1
Vehicles involved in fatal accidents: 1
Fatal accidents caused by drunken drivers: 1
Fatalities: 1
Persons involved in fatal accidents: 1
Pedestrians involved in fatal accidents: 0
Home Mortgage Disclosure Act Aggregated Statistics For Year 2009 (Based on 4 partial tracts)
A) FHA, FSA/RHS & VA Home Purchase Loans
B) Conventional Home Purchase Loans
C) Refinancings
D) Home Improvement Loans
F) Non-occupant Loans on < 5 Family Dwellings (A B C & D)
G) Loans On Manufactured Home Dwelling (A B C & D)
Number
Average Value
Number
Average Value
Number
Average Value
Number
Average Value
Number
Average Value
Number
Average Value
LOANS ORIGINATED
7
$95,069
7
$128,140
50
$120,302
2
$8,705
2
$61,645
1
$99,370
APPLICATIONS APPROVED, NOT ACCEPTED
0
$0
1
$19,460
9
$128,851
0
$0
1
$19,460
1
$55,830
APPLICATIONS DENIED
1
$119,340
2
$74,660
26
$98,562
1
$5,120
1
$5,120
1
$28,270
APPLICATIONS WITHDRAWN
1
$30,730
1
$53,270
9
$135,858
0
$0
0
$0
0
$0
FILES CLOSED FOR INCOMPLETENESS
1
$21,510
1
$20,490
4
$122,065
1
$10,240
0
$0
0
$0
Aggregated Statistics For Year 2008 (Based on 4 partial tracts)
A) FHA, FSA/RHS & VA Home Purchase Loans
B) Conventional Home Purchase Loans
C) Refinancings
D) Home Improvement Loans
F) Non-occupant Loans on < 5 Family Dwellings (A B C & D)
G) Loans On Manufactured Home Dwelling (A B C & D)
Number
Average Value
Number
Average Value
Number
Average Value
Number
Average Value
Number
Average Value
Number
Average Value
LOANS ORIGINATED
8
$111,696
12
$138,568
36
$119,723
5
$19,462
5
$151,588
2
$57,880
APPLICATIONS APPROVED, NOT ACCEPTED
2
$76,830
2
$161,970
5
$132,568
3
$21,603
0
$0
0
$0
APPLICATIONS DENIED
3
$55,490
4
$69,512
42
$120,868
12
$40,607
3
$45,403
2
$57,880
APPLICATIONS WITHDRAWN
1
$216,180
2
$73,010
9
$105,397
1
$86,350
1
$92,200
0
$0
FILES CLOSED FOR INCOMPLETENESS
0
$0
1
$143,420
2
$90,660
0
$0
0
$0
1
$44,050
Aggregated Statistics For Year 2007 (Based on 4 partial tracts)
A) FHA, FSA/RHS & VA Home Purchase Loans
B) Conventional Home Purchase Loans
C) Refinancings
D) Home Improvement Loans
F) Non-occupant Loans on < 5 Family Dwellings (A B C & D)
G) Loans On Manufactured Home Dwelling (A B C & D)
Number
Average Value
Number
Average Value
Number
Average Value
Number
Average Value
Number
Average Value
Number
Average Value
LOANS ORIGINATED
4
$69,530
29
$88,410
39
$92,860
11
$24,686
6
$48,512
1
$90,930
APPLICATIONS APPROVED, NOT ACCEPTED
1
$27,660
4
$100,485
13
$84,010
2
$13,490
0
$0
1
$9,730
APPLICATIONS DENIED
1
$61,210
8
$79,248
62
$116,481
9
$58,094
1
$59,420
3
$28,993
APPLICATIONS WITHDRAWN
1
$38,930
2
$76,590
12
$109,954
1
$44,050
1
$13,830
0
$0
FILES CLOSED FOR INCOMPLETENESS
0
$0
1
$24,070
5
$128,068
0
$0
0
$0
0
$0
Aggregated Statistics For Year 2006 (Based on 4 partial tracts)
A) FHA, FSA/RHS & VA Home Purchase Loans
B) Conventional Home Purchase Loans
C) Refinancings
D) Home Improvement Loans
F) Non-occupant Loans on < 5 Family Dwellings (A B C & D)
G) Loans On Manufactured Home Dwelling (A B C & D)
Number
Average Value
Number
Average Value
Number
Average Value
Number
Average Value
Number
Average Value
Number
Average Value
LOANS ORIGINATED
2
$105,455
36
$102,846
62
$108,083
15
$51,565
6
$72,457
2
$97,195
APPLICATIONS APPROVED, NOT ACCEPTED
0
$0
6
$83,207
15
$86,957
2
$38,050
1
$18,950
0
$0
APPLICATIONS DENIED
0
$0
9
$82,547
74
$119,829
14
$51,346
2
$47,890
3
$47,730
APPLICATIONS WITHDRAWN
1
$36,880
4
$109,635
31
$108,994
1
$278,910
0
$0
0
$0
FILES CLOSED FOR INCOMPLETENESS
0
$0
2
$85,220
7
$170,304
0
$0
0
$0
0
$0
Aggregated Statistics For Year 2005 (Based on 4 partial tracts)
A) FHA, FSA/RHS & VA Home Purchase Loans
B) Conventional Home Purchase Loans
C) Refinancings
D) Home Improvement Loans
F) Non-occupant Loans on < 5 Family Dwellings (A B C & D)
G) Loans On Manufactured Home Dwelling (A B C & D)
Number
Average Value
Number
Average Value
Number
Average Value
Number
Average Value
Number
Average Value
Number
Average Value
LOANS ORIGINATED
2
$101,215
40
$96,001
68
$110,305
15
$42,665
6
$120,698
3
$80,063
APPLICATIONS APPROVED, NOT ACCEPTED
0
$0
9
$77,657
20
$107,053
3
$17,870
3
$33,123
2
$28,170
APPLICATIONS DENIED
1
$94,240
24
$82,217
69
$103,973
17
$36,946
4
$63,470
6
$34,453
APPLICATIONS WITHDRAWN
2
$66,330
7
$112,994
35
$122,766
3
$115,757
2
$82,090
1
$35,120
FILES CLOSED FOR INCOMPLETENESS
0
$0
2
$91,195
13
$118,795
0
$0
1
$50,510
0
$0
Aggregated Statistics For Year 2004 (Based on 4 partial tracts)
A) FHA, FSA/RHS & VA Home Purchase Loans
B) Conventional Home Purchase Loans
C) Refinancings
D) Home Improvement Loans
F) Non-occupant Loans on < 5 Family Dwellings (A B C & D)
G) Loans On Manufactured Home Dwelling (A B C & D)
Number
Average Value
Number
Average Value
Number
Average Value
Number
Average Value
Number
Average Value
Number
Average Value
LOANS ORIGINATED
3
$116,557
37
$105,462
72
$100,639
8
$34,706
5
$50,660
4
$69,788
APPLICATIONS APPROVED, NOT ACCEPTED
0
$0
7
$106,161
23
$113,804
1
$42,560
0
$0
0
$0
APPLICATIONS DENIED
1
$118,850
10
$83,203
70
$117,496
16
$35,977
0
$0
2
$58,400
APPLICATIONS WITHDRAWN
0
$0
8
$139,964
39
$119,312
3
$78,653
1
$87,070
0
$0
FILES CLOSED FOR INCOMPLETENESS
0
$0
3
$116,173
11
$109,595
1
$71,710
1
$54,860
0
$0
Aggregated Statistics For Year 2003 (Based on 4 partial tracts)
A) FHA, FSA/RHS & VA Home Purchase Loans
B) Conventional Home Purchase Loans
C) Refinancings
D) Home Improvement Loans
F) Non-occupant Loans on < 5 Family Dwellings (A B C & D)
Number
Average Value
Number
Average Value
Number
Average Value
Number
Average Value
Number
Average Value
LOANS ORIGINATED
2
$106,190
30
$102,796
114
$96,457
11
$23,978
3
$47,590
APPLICATIONS APPROVED, NOT ACCEPTED
1
$100,390
3
$112,913
20
$114,424
4
$18,520
2
$41,950
APPLICATIONS DENIED
1
$154,300
10
$90,994
54
$112,269
13
$20,567
3
$33,977
APPLICATIONS WITHDRAWN
1
$75,290
2
$111,655
28
$117,815
1
$5,630
2
$39,185
FILES CLOSED FOR INCOMPLETENESS
1
$100,050
2
$205,670
7
$104,603
1
$57,370
0
$0
Aggregated Statistics For Year 2002 (Based on 4 partial tracts)
A) FHA, FSA/RHS & VA Home Purchase Loans
B) Conventional Home Purchase Loans
C) Refinancings
D) Home Improvement Loans
F) Non-occupant Loans on < 5 Family Dwellings (A B C & D)
Number
Average Value
Number
Average Value
Number
Average Value
Number
Average Value
Number
Average Value
LOANS ORIGINATED
3
$75,490
28
$94,880
96
$94,810
4
$21,300
6
$71,108
APPLICATIONS APPROVED, NOT ACCEPTED
1
$51,730
6
$75,603
23
$111,055
2
$15,775
1
$58,570
APPLICATIONS DENIED
0
$0
7
$80,696
57
$84,077
4
$16,082
1
$63,430
APPLICATIONS WITHDRAWN
1
$71,810
6
$99,042
27
$95,982
2
$7,175
0
$0
FILES CLOSED FOR INCOMPLETENESS
0
$0
1
$27,150
11
$98,087
0
$0
1
$11,780
Aggregated Statistics For Year 2001 (Based on 4 partial tracts)
A) FHA, FSA/RHS & VA Home Purchase Loans
B) Conventional Home Purchase Loans
C) Refinancings
D) Home Improvement Loans
F) Non-occupant Loans on < 5 Family Dwellings (A B C & D)
Number
Average Value
Number
Average Value
Number
Average Value
Number
Average Value
Number
Average Value
LOANS ORIGINATED
3
$84,117
26
$82,264
95
$89,764
7
$23,556
6
$65,365
APPLICATIONS APPROVED, NOT ACCEPTED
2
$79,390
4
$62,290
18
$84,191
1
$14,340
0
$0
APPLICATIONS DENIED
1
$69,750
12
$77,819
50
$89,366
9
$10,167
2
$56,105
APPLICATIONS WITHDRAWN
0
$0
3
$70,137
32
$90,707
3
$9,823
0
$0
FILES CLOSED FOR INCOMPLETENESS
1
$29,710
1
$71,710
6
$90,207
0
$0
0
$0
Aggregated Statistics For Year 2000 (Based on 4 partial tracts)
A) FHA, FSA/RHS & VA Home Purchase Loans
B) Conventional Home Purchase Loans
C) Refinancings
D) Home Improvement Loans
F) Non-occupant Loans on < 5 Family Dwellings (A B C & D)
Number
Average Value
Number
Average Value
Number
Average Value
Number
Average Value
Number
Average Value
LOANS ORIGINATED
2
$78,035
25
$78,924
38
$63,632
8
$12,564
4
$53,055
APPLICATIONS APPROVED, NOT ACCEPTED
0
$0
7
$72,981
8
$73,830
3
$9,843
1
$62,550
APPLICATIONS DENIED
0
$0
12
$56,248
39
$59,774
13
$13,425
2
$31,545
APPLICATIONS WITHDRAWN
1
$44,620
3
$79,117
9
$68,139
2
$15,365
0
$0
FILES CLOSED FOR INCOMPLETENESS
1
$47,120
1
$116,590
4
$65,310
0
$0
0
$0
Aggregated Statistics For Year 1999 (Based on 2 partial tracts)
A) FHA, FSA/RHS & VA Home Purchase Loans
B) Conventional Home Purchase Loans
C) Refinancings
D) Home Improvement Loans
F) Non-occupant Loans on < 5 Family Dwellings (A B C & D)
Detailed PMIC statistics for the following Tracts:0220.00
, 0223.00
2002 - 2018 National Fire Incident Reporting System (NFIRS) incidents
Based on the data from the years 2002 - 2018 the average number of fire incidents per year is 9. The highest number of reported fires - 19 took place in 2010, and the least - 2 in 2005. The data has a constant trend.
When looking into fire subcategories, the most reports belonged to: Outside Fires (43.1%), and Structure Fires (34.4%).
Fire incident types reported to NFIRS in Zip Code 43413


 Nearest zip codes: 43437, 45872, 43462, 43451, 45889, 44817.
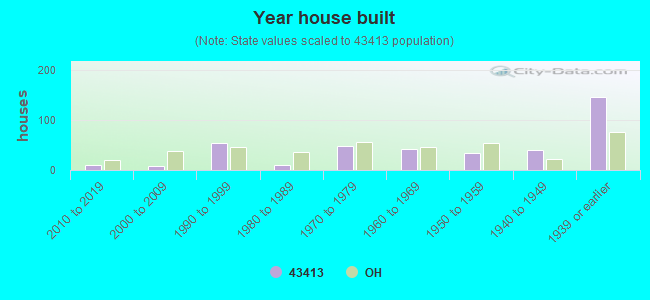


 Based on the data from the years 2002 - 2018 the average number of fire incidents per year is 9. The highest number of reported fires - 19 took place in 2010, and the least - 2 in 2005. The data has a constant trend.
 When looking into fire subcategories, the most reports belonged to: Outside Fires (43.1%), and Structure Fires (34.4%).