Estimated zip code population in 2022: 2,016 Zip code population in 2010: 2,222 Zip code population in 2000: 2,023
Houses and condos: 759 Renter-occupied apartments: 88
% of renters here:
12%
State:
33%
March 2022 cost of living index in zip code 44046: 85.3 (less than average, U.S. average is 100)
Land area: 15.4 sq. mi. Water area: 0.7 sq. mi.
Population density: 131 people per square mile
(very low).
OSM Map
General Map
Google Map
MSN Map
OSM Map
General Map
Google Map
MSN Map
OSM Map
General Map
Google Map
MSN Map
OSM Map
General Map
Google Map
MSN Map
Please wait while loading the map...
Real estate property taxes paid for housing units in 2022:
This zip code:
1.2% ($2,487)
Ohio:
1.3% ($2,639)
Median real estate property taxes paid for housing units with mortgages in 2022: $2,619 (1.1%) Median real estate property taxes paid for housing units with no mortgage in 2022: $1,938 (1.2%)
Business Search- 14 Million verified businesses
Males: 957
(47.5%)
Females: 1,059
(52.5%)
For population 25 years and over in 44046:
High school or higher: 70.9%
Bachelor's degree or higher: 14.5%
Graduate or professional degree: 4.9%
Unemployed: 1.0%
Mean travel time to work (commute): 34.0 minutes
For population 15 years and over in 44046:
Never married: 30.6%
Now married: 46.9%
Separated: 0.3%
Widowed: 11.5%
Divorced: 10.8%
Zip code 44046 compared to state average:
Unemployed percentage significantly below state average.
Black race population percentage below state average.
Hispanic race population percentage significantly below state average.
Foreign-born population percentage significantly below state average.
Renting percentage significantly below state average.
Length of stay since moving in significantly above state average.
Number of college students below state average.
Percentage of population with a bachelor's degree or higher significantly below state average.
Estimated median house/condo value in 2022: $212,562
44046:
$212,562
Ohio:
$204,100
According to our research of Ohio and other state lists, there was 1 registered sex offender living in 44046 zip code as of June 19, 2024. The ratio of all residents to sex offenders in zip code 44046 is 2,137 to 1. The ratio of registered sex offenders to all residents in this zip code is much lower than the state average.
Median resident age:
This zip code:
40.3 years
Ohio median age:
39.9 years
Average household size:
This zip code:
2.6 people
Ohio:
2.4 people
Averages for the 2020 tax year for zip code 44046, filed in 2021:
Average Adjusted Gross Income (AGI) in 2020: $61,185 (Individual Income Tax Returns)
Here:
$61,185
State:
$67,288
Salary/wage: $52,803 (reported on 72.4% of returns)
Here:
$52,803
State:
$55,628
(% of AGI for various income ranges: 1241.4% for AGIs below $25k, 3554.1% for AGIs $25k-50k, 6692.7% for AGIs $50k-75k, 10070.0% for AGIs $75k-100k, 19123.8% for AGIs $100k-200k)
Taxable interest for individuals: $571 (reported on 34.7% of returns)
This zip code:
$571
Ohio:
$1,518
(% of AGI for various income ranges: 19.3% for AGIs below $25k, 22.9% for AGIs $25k-50k, 29.1% for AGIs $50k-75k, 15.7% for AGIs $75k-100k, 106.2% for AGIs $100k-200k)
Ordinary dividends: $2,713 (reported on 15.3% of returns)
Here:
$2,713
State:
$7,167
(% of AGI for various income ranges: 33.6% for AGIs below $25k, 74.7% for AGIs $25k-50k, 91.8% for AGIs $50k-75k, 34.3% for AGIs $75k-100k, 135.0% for AGIs $100k-200k)
Net capital gain/loss in AGI: +$6,386 (reported on 14.3% of returns)
Here:
+$6,386
State:
+$18,919
(% of AGI for various income ranges: 35.9% for AGIs $25k-50k, 91.8% for AGIs $50k-75k, 915.0% for AGIs $100k-200k)
Profit/loss from business: +$32,296 (reported on 26.5% of returns)
Here:
+$32,296
State:
+$13,744
(% of AGI for various income ranges: 385.7% for AGIs below $25k, 1253.5% for AGIs $25k-50k, 1901.8% for AGIs $50k-75k, 1371.4% for AGIs $75k-100k, 3342.5% for AGIs $100k-200k)
Taxable individual retirement arrangement distribution: $13,433 (reported on 12.2% of returns)
44046:
$13,433
Ohio:
$18,876
(% of AGI for various income ranges: 115.7% for AGIs below $25k, 179.4% for AGIs $25k-50k, 653.6% for AGIs $50k-75k, 532.5% for AGIs $100k-200k)
Total itemized deductions: $17,025 (reported on 4.1% of returns)
Here:
$17,025
State:
$33,869
(% of AGI for various income ranges: 619.1% for AGIs $50k-75k)
Taxes paid: $4,975 (reported on 4.1% of returns)
44046:
$4,975
State:
$7,681
(% of AGI for various income ranges: 180.9% for AGIs $50k-75k)
Earned income credit: $2,229 (reported on 7.1% of returns)
Here:
$2,229
State:
$2,304
(% of AGI for various income ranges: 57.9% for AGIs below $25k, 44.1% for AGIs $25k-50k)
Percentage of individuals using paid preparers for their 2020 taxes: 92.9%
Here:
93%
State:
94%
(% for various income ranges: 91.3% for AGIs below $25k, 92.9% for AGIs $25k-50k, 94.7% for AGIs $50k-75k, 91.7% for AGIs $75k-100k, 92.9% for AGIs $100k-200k, 100.0% for AGIs over 200k)
Averages for the 2012 tax year for zip code 44046, filed in 2013:
Average Adjusted Gross Income (AGI) in 2012: $48,895 (Individual Income Tax Returns)
Here:
$48,895
State:
$54,926
Salary/wage: $43,873 (reported on 79.4% of returns)
Here:
$43,873
State:
$45,869
(% of AGI for various income ranges: 65.7% for AGIs below $25k, 67.4% for AGIs $25k-50k, 73.0% for AGIs $50k-75k, 80.5% for AGIs $75k-100k, 67.5% for AGIs $100k-200k)
Taxable interest for individuals: $455 (reported on 34.0% of returns)
This zip code:
$455
Ohio:
$1,297
(% of AGI for various income ranges: 0.7% for AGIs below $25k, 0.6% for AGIs $25k-50k, 0.2% for AGIs $50k-75k, 0.2% for AGIs $75k-100k, 0.1% for AGIs $100k-200k)
Ordinary dividends: $1,488 (reported on 17.5% of returns)
Here:
$1,488
State:
$5,821
(% of AGI for various income ranges: 0.6% for AGIs below $25k, 0.2% for AGIs $25k-50k, 0.7% for AGIs $50k-75k, 0.5% for AGIs $75k-100k, 0.7% for AGIs $100k-200k)
Net capital gain/loss in AGI: +$618 (reported on 11.3% of returns)
Here:
+$618
State:
+$11,232
(% of AGI for various income ranges: 0.1% for AGIs $50k-75k, 0.6% for AGIs $100k-200k)
Profit/loss from business: +$18,179 (reported on 24.7% of returns)
Here:
+$18,179
State:
+$12,773
(% of AGI for various income ranges: 18.4% for AGIs below $25k, 17.0% for AGIs $25k-50k, 6.9% for AGIs $50k-75k, 6.4% for AGIs $75k-100k, 4.2% for AGIs $100k-200k)
Taxable individual retirement arrangement distribution: $8,556 (reported on 9.3% of returns)
44046:
$8,556
Ohio:
$14,511
(% of AGI for various income ranges: 2.3% for AGIs below $25k, 2.0% for AGIs $25k-50k, 3.8% for AGIs $50k-75k)
Total itemized deductions: $15,848 (20% of AGI, reported on 29.9% of returns)
Here:
$15,848
State:
$21,278
Here:
20.3% of AGI
State:
18.8% of AGI
(% of AGI for various income ranges: 6.3% for AGIs below $25k, 8.4% for AGIs $25k-50k, 9.1% for AGIs $50k-75k, 10.3% for AGIs $75k-100k, 12.0% for AGIs $100k-200k)
Charity contributions: $2,471 (reported on 21.6% of returns)
Here:
$2,471
State:
$3,943
(% of AGI for various income ranges: 1.1% for AGIs $25k-50k, 0.8% for AGIs $50k-75k, 1.2% for AGIs $75k-100k, 1.6% for AGIs $100k-200k)
Taxes paid: $6,021 (reported on 29.9% of returns)
44046:
$6,021
State:
$9,568
(% of AGI for various income ranges: 3.3% for AGIs $25k-50k, 3.1% for AGIs $50k-75k, 4.1% for AGIs $75k-100k, 5.6% for AGIs $100k-200k)
Earned income credit: $1,560 (reported on 10.3% of returns)
Here:
$1,560
State:
$2,285
(% of AGI for various income ranges: 2.2% for AGIs below $25k, 0.7% for AGIs $25k-50k)
Percentage of individuals using paid preparers for their 2012 taxes: 64.9%
Here:
65%
State:
51%
(% for various income ranges: 58.1% for AGIs below $25k, 70.4% for AGIs $25k-50k, 66.7% for AGIs $50k-75k, 70.0% for AGIs $75k-100k, 62.5% for AGIs $100k-200k)
Averages for the 2004 tax year for zip code 44046, filed in 2005:
Average Adjusted Gross Income (AGI) in 2004: $41,857 (Individual Income Tax Returns)
Here:
$41,857
State:
$44,480
Salary/wage: $38,895 (reported on 83.1% of returns)
Here:
$38,895
State:
$39,198
(% of AGI for various income ranges: 98.2% for AGIs below $10k, 71.5% for AGIs $10k-25k, 78.4% for AGIs $25k-50k, 79.3% for AGIs $50k-75k, 85.0% for AGIs $75k-100k, 67.7% for AGIs over 100k)
Taxable interest for individuals: $812 (reported on 49.7% of returns)
This zip code:
$812
Ohio:
$1,532
(% of AGI for various income ranges: 4.3% for AGIs below $10k, 1.3% for AGIs $10k-25k, 0.5% for AGIs $25k-50k, 1.3% for AGIs $50k-75k, 0.6% for AGIs $75k-100k, 1.1% for AGIs over 100k)
Taxable dividends: $924 (reported on 23.3% of returns)
Here:
$924
State:
$3,496
(% of AGI for various income ranges: 1.6% for AGIs below $10k, 0.5% for AGIs $10k-25k, 0.2% for AGIs $25k-50k, 0.6% for AGIs $50k-75k, 0.8% for AGIs $75k-100k, 0.6% for AGIs over 100k)
Net capital gain/loss: +$3,220 (reported on 13.2% of returns)
Here:
+$3,220
State:
+$8,582
(% of AGI for various income ranges: -2.4% for AGIs below $10k, 1.4% for AGIs $10k-25k, 0.1% for AGIs $25k-50k, 0.1% for AGIs $50k-75k, 0.4% for AGIs $75k-100k, 4.1% for AGIs over 100k)
Profit/loss from business: +$15,708 (reported on 22.4% of returns)
Here:
+$15,708
State:
+$10,813
(% of AGI for various income ranges: 19.7% for AGIs below $10k, 13.3% for AGIs $10k-25k, 7.7% for AGIs $25k-50k, 11.9% for AGIs $50k-75k, 2.9% for AGIs $75k-100k, 6.2% for AGIs over 100k)
IRA payment deduction: $2,500 (reported on 3.5% of returns)
44046:
$2,500
Ohio:
$2,794
Total itemized deductions: $15,234 (23% of AGI, reported on 37.8% of returns)
Here:
$15,234
State:
$17,503
Here:
23.1% of AGI
State:
20.8% of AGI
(% of AGI for various income ranges: 11.0% for AGIs $10k-25k, 12.1% for AGIs $25k-50k, 14.9% for AGIs $50k-75k, 16.8% for AGIs $75k-100k, 14.5% for AGIs over 100k)
Charity contributions deductions: $2,050 (3% of AGI, reported on 27.0% of returns)
Here:
$2,050
State:
$3,087
Here:
2.9% of AGI
State:
3.4% of AGI
(% of AGI for various income ranges: 0.6% for AGIs $10k-25k, 0.7% for AGIs $25k-50k, 1.5% for AGIs $50k-75k, 2.0% for AGIs $75k-100k, 1.9% for AGIs over 100k)
Total tax: $4,924 (reported on 80.9% of returns)
44046:
$4,924
State:
$6,781
(% of AGI for various income ranges: 4.3% for AGIs below $10k, 6.1% for AGIs $10k-25k, 7.1% for AGIs $25k-50k, 7.9% for AGIs $50k-75k, 10.0% for AGIs $75k-100k, 16.7% for AGIs over 100k)
Earned income credit: $1,456 (reported on 7.1% of returns)
Here:
$1,456
State:
$1,696
Percentage of individuals using paid preparers for their 2004 taxes: 66.9%
Here:
67%
State:
55%
(% for various income ranges: 57.2% for AGIs below $10k, 65.3% for AGIs $10k-25k, 72.6% for AGIs $25k-50k, 68.8% for AGIs $50k-75k, 58.6% for AGIs $75k-100k, 72.5% for AGIs over 100k)
Household received Food Stamps/SNAP in the past 12 months: 17 Household did not receive Food Stamps/SNAP in the past 12 months: 717
Women who had a birth in the past 12 months: 30 (31 now married, 0 unmarried) Women who did not have a birth in the past 12 months: 309 (190 now married, 119 unmarried)
Housing units in zip code 44046 with a mortgage: 371 (31 second mortgage, 31 both second mortgage and home equity loan) Houses without a mortgage: 58
Median monthly owner costs for units with a mortgage: $1,304 Median monthly owner costs for units without a mortgage: $378
Residents with income below the poverty level in 2022:
This zip code:
12.8%
Whole state:
13.4%
Residents with income below 50% of the poverty level in 2022:
This zip code:
10.5%
Whole state:
7.0%
Median number of rooms in houses and condos:
Here:
6.3
State:
6.7
Median number of rooms in apartments:
Here:
5.4
State:
4.4
Notable locations in this zip code not listed on our city pages
In group quarters: 72 (-1 institutionalized population)
Size of family households: 186 2-persons, 97 3-persons, 46 4-persons, 122 5-persons, 17 6-persons, 14 7-or-more-persons
Size of nonfamily households: 196 1-person, 47 2-persons, 5 3-persons
530 married couples with children.
0 single-parent households ().
77.4% of residents of 44046 zip code speak English at home.
25.2% of residents speak other Indo-European language at home (47% very well, 51% well, 2% not at all).
Foreign born population: 0 (0.0%)
:
0.0%
Whole state:
5.0%
30%Pennsylvania German
17%German
8%English
7%American
4%Polish
4%Swiss
4%Irish
Housing units lacking complete plumbing facilities: 1.2% Housing units lacking complete kitchen facilities: 2.1%
27.2%Fuel oil, kerosene, etc.
26.8%Utility gas
26.1%Wood
13.2%Electricity
4.3%Bottled, tank, or LP gas
2.9%Coal or coke
Population in 1990: 1,804. Population change in the 1990s: +219 (+12.1%).
Place of birth for U.S.-born residents:
This state: 1,842
Northeast: 53
Midwest: 61
South: 39
West: 17
70% of the 44046 zip code residents lived in the same house 5 years ago. Out of people who lived in different houses, 61% lived in this county. Out of people who lived in different counties, 50% lived in Ohio.
97% of the 44046 zip code residents lived in the same house 1 year ago. Out of people who lived in different houses, 89% moved from this county. Out of people who lived in different houses, 19% moved from different county within same state.
Private vs. public school enrollment:
Students in private schools in grades 1 to 8 (elementary and middle school): 160
Here:
74.2%
Ohio:
16.0%
Students in private schools in grades 9 to 12 (high school): 26
Here:
55.2%
Ohio:
13.1%
Students in private undergraduate colleges:
Here:
0.0%
Ohio:
22.3%
Occupation by median earnings in the past 12 months ($)
109,042Health diagnosing and treating practitioners and other technical occupations
60,243Architecture and engineering occupations
58,104Installation, maintenance, and repair occupations
56,561Office and administrative support occupations
51,488Management occupations
50,351Construction and extraction occupations
Top industries in this zip code by the number of employees in 2005:
Health Care and Social Assistance: Nursing Care Facilities (100-249 employees: 1 establishment)
Construction: Site Preparation Contractors (20-49: 1, 1-4: 2)
Construction: Commercial and Institutional Building Construction (20-49: 1)
Other Services (except Public Administration): Automotive Body, Paint, and Interior Repair and Maintenance (10-19: 1)
Arts, Entertainment, and Recreation: Golf Courses and Country Clubs (5-9: 1)
Construction: Framing Contractors (1-4: 1)
Accommodation and Food Services: Snack and Nonalcoholic Beverage Bars (1-4: 1)
People in group quarters in 2010:
86 people in nursing facilities/skilled-nursing facilities
People in group quarters in 2000:
92 people in nursing homes
Fatal accident statistics in 2013:
Fatal accident count: 1
Vehicles involved in fatal accidents: 2
Fatal accidents caused by drunken drivers: 2
Fatalities: 1
Persons involved in fatal accidents: 2
Pedestrians involved in fatal accidents: 0
Home Mortgage Disclosure Act Aggregated Statistics For Year 2009 (Based on 4 partial tracts)
A) FHA, FSA/RHS & VA Home Purchase Loans
B) Conventional Home Purchase Loans
C) Refinancings
D) Home Improvement Loans
F) Non-occupant Loans on < 5 Family Dwellings (A B C & D)
G) Loans On Manufactured Home Dwelling (A B C & D)
Number
Average Value
Number
Average Value
Number
Average Value
Number
Average Value
Number
Average Value
Number
Average Value
LOANS ORIGINATED
4
$163,732
12
$163,232
75
$143,982
3
$165,923
1
$77,390
2
$138,025
APPLICATIONS APPROVED, NOT ACCEPTED
1
$168,630
2
$58,905
10
$132,505
0
$0
0
$0
0
$0
APPLICATIONS DENIED
0
$0
3
$125,643
32
$172,804
1
$16,060
2
$78,540
1
$118,970
APPLICATIONS WITHDRAWN
0
$0
3
$102,680
7
$151,060
1
$152,840
1
$123,360
0
$0
FILES CLOSED FOR INCOMPLETENESS
0
$0
0
$0
3
$202,333
0
$0
0
$0
0
$0
Aggregated Statistics For Year 2008 (Based on 4 partial tracts)
A) FHA, FSA/RHS & VA Home Purchase Loans
B) Conventional Home Purchase Loans
C) Refinancings
D) Home Improvement Loans
F) Non-occupant Loans on < 5 Family Dwellings (A B C & D)
G) Loans On Manufactured Home Dwelling (A B C & D)
Number
Average Value
Number
Average Value
Number
Average Value
Number
Average Value
Number
Average Value
Number
Average Value
LOANS ORIGINATED
7
$144,511
23
$120,314
49
$120,118
7
$53,890
2
$53,915
1
$153,250
APPLICATIONS APPROVED, NOT ACCEPTED
1
$265,650
1
$69,300
11
$129,620
0
$0
0
$0
1
$69,300
APPLICATIONS DENIED
1
$189,910
2
$69,150
29
$145,696
3
$26,537
3
$81,707
1
$80,810
APPLICATIONS WITHDRAWN
0
$0
4
$96,725
14
$159,767
3
$134,367
0
$0
0
$0
FILES CLOSED FOR INCOMPLETENESS
0
$0
0
$0
2
$201,545
0
$0
0
$0
0
$0
Aggregated Statistics For Year 2007 (Based on 4 partial tracts)
A) FHA, FSA/RHS & VA Home Purchase Loans
B) Conventional Home Purchase Loans
C) Refinancings
D) Home Improvement Loans
F) Non-occupant Loans on < 5 Family Dwellings (A B C & D)
G) Loans On Manufactured Home Dwelling (A B C & D)
Number
Average Value
Number
Average Value
Number
Average Value
Number
Average Value
Number
Average Value
Number
Average Value
LOANS ORIGINATED
3
$107,337
37
$141,999
69
$122,601
23
$46,938
6
$79,743
2
$107,460
APPLICATIONS APPROVED, NOT ACCEPTED
1
$135,130
2
$79,515
10
$99,965
2
$136,535
0
$0
1
$135,130
APPLICATIONS DENIED
2
$156,505
8
$126,256
37
$141,889
12
$37,152
1
$122,430
4
$94,160
APPLICATIONS WITHDRAWN
1
$112,040
7
$116,344
12
$141,353
0
$0
1
$189,090
1
$97,020
FILES CLOSED FOR INCOMPLETENESS
0
$0
0
$0
4
$113,258
0
$0
0
$0
0
$0
Aggregated Statistics For Year 2006 (Based on 4 partial tracts)
A) FHA, FSA/RHS & VA Home Purchase Loans
B) Conventional Home Purchase Loans
C) Refinancings
D) Home Improvement Loans
F) Non-occupant Loans on < 5 Family Dwellings (A B C & D)
G) Loans On Manufactured Home Dwelling (A B C & D)
Number
Average Value
Number
Average Value
Number
Average Value
Number
Average Value
Number
Average Value
Number
Average Value
LOANS ORIGINATED
3
$206,423
48
$135,960
92
$128,019
25
$35,903
5
$73,812
2
$71,495
APPLICATIONS APPROVED, NOT ACCEPTED
0
$0
4
$102,630
16
$131,670
3
$30,547
0
$0
0
$0
APPLICATIONS DENIED
0
$0
8
$99,114
57
$146,097
11
$54,394
1
$164,930
2
$16,265
APPLICATIONS WITHDRAWN
0
$0
3
$155,247
31
$158,751
1
$21,520
0
$0
1
$107,420
FILES CLOSED FOR INCOMPLETENESS
0
$0
3
$109,230
12
$181,292
0
$0
1
$132,140
0
$0
Aggregated Statistics For Year 2005 (Based on 4 partial tracts)
B) Conventional Home Purchase Loans
C) Refinancings
D) Home Improvement Loans
F) Non-occupant Loans on < 5 Family Dwellings (A B C & D)
G) Loans On Manufactured Home Dwelling (A B C & D)
Number
Average Value
Number
Average Value
Number
Average Value
Number
Average Value
Number
Average Value
LOANS ORIGINATED
43
$148,864
86
$136,769
38
$62,992
6
$95,865
3
$60,897
APPLICATIONS APPROVED, NOT ACCEPTED
5
$111,234
19
$110,135
1
$41,280
1
$161,700
0
$0
APPLICATIONS DENIED
16
$84,329
42
$146,930
14
$54,451
5
$110,498
7
$48,863
APPLICATIONS WITHDRAWN
9
$173,129
22
$135,263
2
$83,500
5
$108,924
0
$0
FILES CLOSED FOR INCOMPLETENESS
2
$120,320
16
$125,269
1
$175,560
0
$0
0
$0
Aggregated Statistics For Year 2004 (Based on 4 partial tracts)
A) FHA, FSA/RHS & VA Home Purchase Loans
B) Conventional Home Purchase Loans
C) Refinancings
D) Home Improvement Loans
F) Non-occupant Loans on < 5 Family Dwellings (A B C & D)
G) Loans On Manufactured Home Dwelling (A B C & D)
Number
Average Value
Number
Average Value
Number
Average Value
Number
Average Value
Number
Average Value
Number
Average Value
LOANS ORIGINATED
4
$110,470
58
$146,482
122
$134,283
19
$88,346
3
$144,253
2
$89,555
APPLICATIONS APPROVED, NOT ACCEPTED
0
$0
4
$180,775
23
$154,138
3
$46,587
0
$0
0
$0
APPLICATIONS DENIED
1
$172,100
6
$91,028
54
$154,372
4
$76,630
0
$0
4
$71,232
APPLICATIONS WITHDRAWN
0
$0
4
$124,942
32
$137,705
2
$58,120
0
$0
0
$0
FILES CLOSED FOR INCOMPLETENESS
0
$0
2
$172,870
12
$129,871
0
$0
0
$0
0
$0
Aggregated Statistics For Year 2003 (Based on 4 partial tracts)
A) FHA, FSA/RHS & VA Home Purchase Loans
B) Conventional Home Purchase Loans
C) Refinancings
D) Home Improvement Loans
F) Non-occupant Loans on < 5 Family Dwellings (A B C & D)
Number
Average Value
Number
Average Value
Number
Average Value
Number
Average Value
Number
Average Value
LOANS ORIGINATED
0
$0
42
$142,138
255
$128,851
5
$27,912
12
$117,849
APPLICATIONS APPROVED, NOT ACCEPTED
0
$0
2
$175,430
29
$134,499
2
$15,135
1
$144,380
APPLICATIONS DENIED
1
$149,000
6
$150,330
56
$121,711
4
$27,785
3
$64,333
APPLICATIONS WITHDRAWN
1
$207,650
4
$238,905
42
$143,360
1
$15,890
0
$0
FILES CLOSED FOR INCOMPLETENESS
0
$0
2
$228,690
10
$146,743
0
$0
1
$279,510
Aggregated Statistics For Year 2002 (Based on 2 partial tracts)
B) Conventional Home Purchase Loans
C) Refinancings
D) Home Improvement Loans
F) Non-occupant Loans on < 5 Family Dwellings (A B C & D)
Number
Average Value
Number
Average Value
Number
Average Value
Number
Average Value
LOANS ORIGINATED
12
$130,040
30
$135,874
1
$25,250
2
$67,415
APPLICATIONS APPROVED, NOT ACCEPTED
1
$146,030
4
$144,278
0
$0
0
$0
APPLICATIONS DENIED
2
$188,305
10
$120,956
2
$29,535
0
$0
APPLICATIONS WITHDRAWN
0
$0
7
$141,360
1
$29,210
0
$0
FILES CLOSED FOR INCOMPLETENESS
0
$0
1
$374,200
0
$0
0
$0
Aggregated Statistics For Year 2001 (Based on 2 partial tracts)
A) FHA, FSA/RHS & VA Home Purchase Loans
B) Conventional Home Purchase Loans
C) Refinancings
D) Home Improvement Loans
Number
Average Value
Number
Average Value
Number
Average Value
Number
Average Value
LOANS ORIGINATED
1
$143,840
11
$121,359
26
$130,130
4
$20,972
APPLICATIONS APPROVED, NOT ACCEPTED
0
$0
1
$189,950
5
$98,952
1
$46,120
APPLICATIONS DENIED
0
$0
2
$67,305
7
$124,639
1
$28,550
APPLICATIONS WITHDRAWN
0
$0
0
$0
7
$134,677
0
$0
FILES CLOSED FOR INCOMPLETENESS
0
$0
0
$0
2
$139,115
0
$0
Aggregated Statistics For Year 2000 (Based on 2 partial tracts)
A) FHA, FSA/RHS & VA Home Purchase Loans
B) Conventional Home Purchase Loans
C) Refinancings
D) Home Improvement Loans
F) Non-occupant Loans on < 5 Family Dwellings (A B C & D)
Number
Average Value
Number
Average Value
Number
Average Value
Number
Average Value
Number
Average Value
LOANS ORIGINATED
1
$73,570
10
$136,416
7
$120,310
3
$15,883
1
$83,670
APPLICATIONS APPROVED, NOT ACCEPTED
0
$0
2
$63,245
4
$86,358
1
$30,090
0
$0
APPLICATIONS DENIED
0
$0
4
$59,895
6
$111,703
2
$10,430
1
$131,320
APPLICATIONS WITHDRAWN
0
$0
1
$182,270
4
$166,018
0
$0
0
$0
FILES CLOSED FOR INCOMPLETENESS
0
$0
0
$0
0
$0
0
$0
0
$0
Aggregated Statistics For Year 1999 (Based on 2 partial tracts)
A) FHA, FSA/RHS & VA Home Purchase Loans
B) Conventional Home Purchase Loans
C) Refinancings
D) Home Improvement Loans
F) Non-occupant Loans on < 5 Family Dwellings (A B C & D)
Detailed PMIC statistics for the following Tracts:3109.00
, 3110.00
2002 - 2018 National Fire Incident Reporting System (NFIRS) incidents
Based on the data from the years 2002 - 2018 the average number of fires per year is 21. The highest number of reported fire incidents - 42 took place in 2014, and the least - 5 in 2012. The data has a growing trend.
When looking into fire subcategories, the most reports belonged to: Structure Fires (81.5%), and Outside Fires (11.5%).
Fire incident types reported to NFIRS in Zip Code 44046

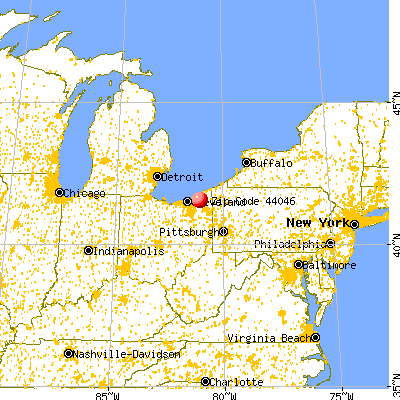


 Nearest zip codes: 44064, 44099, 44062, 44021, 44024, 44086.


 Based on the data from the years 2002 - 2018 the average number of fires per year is 21. The highest number of reported fire incidents - 42 took place in 2014, and the least - 5 in 2012. The data has a growing trend.
 When looking into fire subcategories, the most reports belonged to: Structure Fires (81.5%), and Outside Fires (11.5%).