Estimated zip code population in 2022: 1,609 Zip code population in 2010: 1,612 Zip code population in 2000: 1,728
Houses and condos: 775 Renter-occupied apartments: 75
% of renters here:
11%
State:
33%
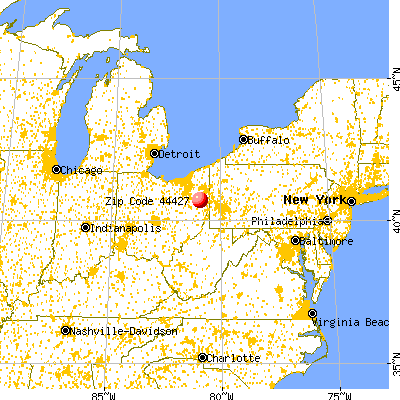
March 2022 cost of living index in zip code 44427: 83.4 (less than average, U.S. average is 100)
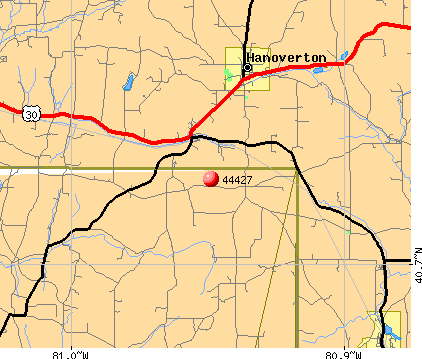
Land area: 30.6 sq. mi. Water area: 0.0 sq. mi.
Population density: 53 people per square mile
(very low).
OSM Map
General Map
Google Map
MSN Map
OSM Map
General Map
Google Map
MSN Map
OSM Map
General Map
Google Map
MSN Map
OSM Map
General Map
Google Map
MSN Map
Please wait while loading the map...
Real estate property taxes paid for housing units in 2022:
This zip code:
1.1% ($1,309)
Ohio:
1.3% ($2,639)
Median real estate property taxes paid for housing units with mortgages in 2022: $1,866 (0.8%) Median real estate property taxes paid for housing units with no mortgage in 2022: $1,224 (1.7%)
Business Search- 14 Million verified businesses
Males: 871
(54.1%)
Females: 738
(45.9%)
For population 25 years and over in 44427:
High school or higher: 90.9%
Bachelor's degree or higher: 14.2%
Graduate or professional degree: 2.7%
Unemployed: 6.6%
Mean travel time to work (commute): 34.5 minutes
For population 15 years and over in 44427:
Never married: 27.8%
Now married: 48.9%
Separated: 1.1%
Widowed: 3.9%
Divorced: 18.3%
Zip code 44427 compared to state average:
Median household income below state average.
Median house value below state average.
Unemployed percentage above state average.
Black race population percentage significantly below state average.
Hispanic race population percentage significantly below state average.
Foreign-born population percentage significantly below state average.
Renting percentage significantly below state average.
Length of stay since moving in significantly above state average.
Percentage of population with a bachelor's degree or higher significantly below state average.
Estimated median house/condo value in 2022: $121,480
44427:
$121,480
Ohio:
$204,100
According to our research of Ohio and other state lists, there were 2 registered sex offenders living in 44427 zip code as of June 15, 2024. The ratio of all residents to sex offenders in zip code 44427 is 912 to 1. The ratio of registered sex offenders to all residents in this zip code is lower than the state average.
Median resident age:
This zip code:
42.3 years
Ohio median age:
39.9 years
Average household size:
This zip code:
2.4 people
Ohio:
2.4 people
Averages for the 2020 tax year for zip code 44427, filed in 2021:
Average Adjusted Gross Income (AGI) in 2020: $47,472 (Individual Income Tax Returns)
Here:
$47,472
State:
$67,288
Salary/wage: $43,168 (reported on 78.9% of returns)
Here:
$43,168
State:
$55,628
(% of AGI for various income ranges: 1235.3% for AGIs below $25k, 3366.7% for AGIs $25k-50k, 6313.3% for AGIs $50k-75k, 8980.0% for AGIs $75k-100k, 15500.0% for AGIs $100k-200k)
Taxable interest for individuals: $418 (reported on 23.9% of returns)
This zip code:
$418
Ohio:
$1,518
(% of AGI for various income ranges: 7.6% for AGIs below $25k, 22.0% for AGIs $25k-50k, 10.0% for AGIs $50k-75k, 32.0% for AGIs $100k-200k)
Ordinary dividends: $2,200 (reported on 11.3% of returns)
Here:
$2,200
State:
$7,167
(% of AGI for various income ranges: 59.3% for AGIs $25k-50k, 34.4% for AGIs $50k-75k, 112.0% for AGIs $100k-200k)
Net capital gain/loss in AGI: +$2,562 (reported on 11.3% of returns)
Here:
+$2,562
State:
+$18,919
(% of AGI for various income ranges: 98.7% for AGIs $25k-50k, 142.5% for AGIs $75k-100k)
Profit/loss from business: +$14,800 (reported on 14.1% of returns)
Here:
+$14,800
State:
+$13,744
(% of AGI for various income ranges: 146.5% for AGIs below $25k, 528.7% for AGIs $25k-50k, 1095.0% for AGIs $75k-100k)
Taxable individual retirement arrangement distribution: $10,040 (reported on 7.0% of returns)
44427:
$10,040
Ohio:
$18,876
(% of AGI for various income ranges: 334.7% for AGIs $25k-50k)
Earned income credit: $2,427 (reported on 15.5% of returns)
Here:
$2,427
State:
$2,304
(% of AGI for various income ranges: 96.5% for AGIs below $25k, 68.7% for AGIs $25k-50k)
Percentage of individuals using paid preparers for their 2020 taxes: 93.0%
Here:
93%
State:
94%
(% for various income ranges: 95.8% for AGIs below $25k, 90.5% for AGIs $25k-50k, 91.7% for AGIs $50k-75k, 83.3% for AGIs $75k-100k, 100.0% for AGIs $100k-200k)
Averages for the 2012 tax year for zip code 44427, filed in 2013:
Average Adjusted Gross Income (AGI) in 2012: $46,994 (Individual Income Tax Returns)
Here:
$46,994
State:
$54,926
Salary/wage: $38,900 (reported on 80.9% of returns)
Here:
$38,900
State:
$45,869
(% of AGI for various income ranges: 71.2% for AGIs below $25k, 77.3% for AGIs $25k-50k, 78.5% for AGIs $50k-75k, 74.0% for AGIs $75k-100k, 43.0% for AGIs $100k-200k)
Taxable interest for individuals: $506 (reported on 25.0% of returns)
This zip code:
$506
Ohio:
$1,297
(% of AGI for various income ranges: 0.3% for AGIs below $25k, 0.5% for AGIs $25k-50k, 0.2% for AGIs $75k-100k, 0.3% for AGIs $100k-200k)
Ordinary dividends: $1,622 (reported on 13.2% of returns)
Here:
$1,622
State:
$5,821
(% of AGI for various income ranges: 0.3% for AGIs below $25k, 1.2% for AGIs $50k-75k, 0.5% for AGIs $100k-200k)
Net capital gain/loss in AGI: +$12,771 (reported on 10.3% of returns)
Here:
+$12,771
State:
+$11,232
(% of AGI for various income ranges: 4.9% for AGIs $50k-75k, 10.0% for AGIs $75k-100k)
Profit/loss from business: +$9,238 (reported on 19.1% of returns)
Here:
+$9,238
State:
+$12,773
(% of AGI for various income ranges: 10.7% for AGIs below $25k, 7.7% for AGIs $25k-50k, 3.5% for AGIs $50k-75k, 0.9% for AGIs $75k-100k)
Taxable individual retirement arrangement distribution: $9,720 (reported on 7.4% of returns)
44427:
$9,720
Ohio:
$14,511
(% of AGI for various income ranges: 4.2% for AGIs below $25k, 4.6% for AGIs $50k-75k)
Total itemized deductions: $16,292 (20% of AGI, reported on 19.1% of returns)
Here:
$16,292
State:
$21,278
Here:
19.6% of AGI
State:
18.8% of AGI
(% of AGI for various income ranges: 5.8% for AGIs $25k-50k, 6.8% for AGIs $50k-75k, 7.8% for AGIs $75k-100k, 8.8% for AGIs $100k-200k)
Charity contributions: $4,312 (reported on 11.8% of returns)
Here:
$4,312
State:
$3,943
(% of AGI for various income ranges: 1.4% for AGIs $50k-75k, 2.7% for AGIs $100k-200k)
Taxes paid: $5,269 (reported on 19.1% of returns)
44427:
$5,269
State:
$9,568
(% of AGI for various income ranges: 1.1% for AGIs $25k-50k, 2.0% for AGIs $50k-75k, 2.6% for AGIs $75k-100k, 3.6% for AGIs $100k-200k)
Earned income credit: $2,250 (reported on 17.6% of returns)
Here:
$2,250
State:
$2,285
(% of AGI for various income ranges: 5.8% for AGIs below $25k, 1.2% for AGIs $25k-50k)
Percentage of individuals using paid preparers for their 2012 taxes: 60.3%
Here:
60%
State:
51%
(% for various income ranges: 48.0% for AGIs below $25k, 63.2% for AGIs $25k-50k, 69.2% for AGIs $50k-75k, 66.7% for AGIs $75k-100k, 80.0% for AGIs $100k-200k)
Averages for the 2004 tax year for zip code 44427, filed in 2005:
Average Adjusted Gross Income (AGI) in 2004: $32,122 (Individual Income Tax Returns)
Here:
$32,122
State:
$44,480
Salary/wage: $29,339 (reported on 87.2% of returns)
Here:
$29,339
State:
$39,198
(% of AGI for various income ranges: 177.1% for AGIs below $10k, 75.6% for AGIs $10k-25k, 80.5% for AGIs $25k-50k, 88.3% for AGIs $50k-75k, 77.6% for AGIs $75k-100k, 45.6% for AGIs over 100k)
Taxable interest for individuals: $777 (reported on 36.8% of returns)
This zip code:
$777
Ohio:
$1,532
(% of AGI for various income ranges: 2.4% for AGIs below $10k, 1.6% for AGIs $10k-25k, 0.5% for AGIs $25k-50k, 0.3% for AGIs $50k-75k, 0.5% for AGIs $75k-100k, 2.7% for AGIs over 100k)
Taxable dividends: $711 (reported on 17.4% of returns)
Here:
$711
State:
$3,496
(% of AGI for various income ranges: 4.8% for AGIs below $10k, 0.8% for AGIs $10k-25k, 0.1% for AGIs $25k-50k, 0.2% for AGIs $50k-75k, 0.6% for AGIs $75k-100k)
Net capital gain/loss: +$2,703 (reported on 13.1% of returns)
Here:
+$2,703
State:
+$8,582
(% of AGI for various income ranges: 1.5% for AGIs $10k-25k, 0.1% for AGIs $25k-50k, 0.9% for AGIs $50k-75k, 4.4% for AGIs $75k-100k)
Profit/loss from business: +$9,798 (reported on 17.8% of returns)
Here:
+$9,798
State:
+$10,813
(% of AGI for various income ranges: 18.1% for AGIs below $10k, 10.7% for AGIs $10k-25k, 6.9% for AGIs $25k-50k, -0.0% for AGIs $50k-75k, 10.0% for AGIs $75k-100k)
IRA payment deduction: $2,909 (reported on 1.6% of returns)
44427:
$2,909
Ohio:
$2,794
Total itemized deductions: $14,823 (24% of AGI, reported on 18.7% of returns)
Here:
$14,823
State:
$17,503
Here:
24.4% of AGI
State:
20.8% of AGI
(% of AGI for various income ranges: 4.9% for AGIs $10k-25k, 6.6% for AGIs $25k-50k, 10.2% for AGIs $50k-75k, 11.7% for AGIs $75k-100k, 13.2% for AGIs over 100k)
Charity contributions deductions: $2,484 (4% of AGI, reported on 13.1% of returns)
Here:
$2,484
State:
$3,087
Here:
3.7% of AGI
State:
3.4% of AGI
(% of AGI for various income ranges: 0.5% for AGIs $25k-50k, 1.2% for AGIs $50k-75k, 0.7% for AGIs $75k-100k, 4.0% for AGIs over 100k)
Total tax: $3,580 (reported on 72.1% of returns)
44427:
$3,580
State:
$6,781
(% of AGI for various income ranges: 4.1% for AGIs below $10k, 4.4% for AGIs $10k-25k, 6.8% for AGIs $25k-50k, 7.8% for AGIs $50k-75k, 11.8% for AGIs $75k-100k, 13.5% for AGIs over 100k)
Earned income credit: $1,889 (reported on 18.1% of returns)
Here:
$1,889
State:
$1,696
Percentage of individuals using paid preparers for their 2004 taxes: 57.6%
Here:
58%
State:
55%
(% for various income ranges: 45.8% for AGIs below $10k, 58.4% for AGIs $10k-25k, 59.2% for AGIs $25k-50k, 63.6% for AGIs $50k-75k, 68.6% for AGIs $75k-100k, 68.4% for AGIs over 100k)
Size of family households: 149 2-persons, 22 3-persons, 134 4-persons, 57 5-persons, 17 6-persons, 1 7-or-more-persons
Size of nonfamily households: 259 1-person, 28 2-persons
307 married couples with children.
44 single-parent households (44 women).
98.5% of residents of 44427 zip code speak English at home.
1.2% of residents speak other Indo-European language at home (100% very well).
Foreign born population: 0 (0.0%)
:
0.0%
Whole state:
5.0%
50%German
16%English
5%Irish
4%Polish
3%American
2%Russian
2%Italian
Facilities with environmental interests located in this zip code:
BUCKEYE INDUS MINING CO (MYERS RD in KENSINGTON, OH)
STATE MASTER (Ohio general info) - PCS-OH0121801, National Pollutant Discharge Elimination System Permit National Pollutant Discharge Elimination System NON-MAJOR (Tracking pollutant discharge elimination systems) - permit Business SIC classification: BITUMINOUS COAL AND LIGNITE SURFACE MINING Organizations: BUCKEYE INDUSTRIAL MINING (CONTACT/OWNER)
Alternative names: BUCKEYE INDUS MINING RD
Housing units lacking complete kitchen facilities: 4.7%
46.1%Wood
16.8%Utility gas
12.7%Fuel oil, kerosene, etc.
11.4%Electricity
11.2%Bottled, tank, or LP gas
2.1%Other fuel
Population in 1990: 1,463. Population change in the 1990s: +265 (+18.1%).
Place of birth for U.S.-born residents:
This state: 1,308
Northeast: 57
Midwest: 112
South: 126
63% of the 44427 zip code residents lived in the same house 5 years ago. Out of people who lived in different houses, 57% lived in this county. Out of people who lived in different counties, 50% lived in Ohio.
97% of the 44427 zip code residents lived in the same house 1 year ago. Out of people who lived in different houses, 53% moved from this county. Out of people who lived in different houses, 59% moved from different county within same state. Out of people who lived in different houses, 3% moved from abroad.
Private vs. public school enrollment:
Students in private schools in grades 1 to 8 (elementary and middle school):
Here:
0.0%
Ohio:
16.0%
Students in private schools in grades 9 to 12 (high school):
Here:
0.0%
Ohio:
13.1%
Students in private undergraduate colleges: 10
Here:
12.4%
Ohio:
22.3%
Occupation by median earnings in the past 12 months ($)
63,701Management occupations
60,061Transportation occupations
55,796Health diagnosing and treating practitioners and other technical occupations
55,446Installation, maintenance, and repair occupations
44,651Health technologists and technicians
38,920Office and administrative support occupations
Top industries in this zip code by the number of employees in 2005:
Health Care and Social Assistance: Residential Mental Retardation Facilities (20-49 employees: 1 establishment)
Health Care and Social Assistance: Home Health Care Services (10-19: 1)
Other Services (except Public Administration): Funeral Homes and Funeral Services (10-19: 1)
Administrative and Support and Waste Management and Remediation Services: Other Waste Collection (5-9: 1)
Other Services (except Public Administration): Other Automotive Mechanical and Electrical Repair and Maintenance (5-9: 1)
Finance and Insurance: Insurance Agencies and Brokerages (1-4: 2)
Professional, Scientific, and Technical Services: Computer Systems Design Services (1-4: 1)
Wholesale Trade: Recyclable Material Merchant Wholesalers (1-4: 1)
Other Services (except Public Administration): Religious Organizations (1-4: 1)
People in group quarters in 2000:
26 people in other nonhousehold living situations
Fatal accident statistics in 2014:
Fatal accident count: 1
Vehicles involved in fatal accidents: 2
Fatal accidents caused by drunken drivers: 1
Fatalities: 1
Persons involved in fatal accidents: 3
Pedestrians involved in fatal accidents: 0
Fatal accident statistics in 2013:
Fatal accident count: 1
Vehicles involved in fatal accidents: 1
Fatal accidents caused by drunken drivers: 0
Fatalities: 1
Persons involved in fatal accidents: 1
Pedestrians involved in fatal accidents: 0
Home Mortgage Disclosure Act Aggregated Statistics For Year 2003 (Based on 2 partial tracts)
A) FHA, FSA/RHS & VA Home Purchase Loans
B) Conventional Home Purchase Loans
C) Refinancings
D) Home Improvement Loans
F) Non-occupant Loans on < 5 Family Dwellings (A B C & D)
Number
Average Value
Number
Average Value
Number
Average Value
Number
Average Value
Number
Average Value
LOANS ORIGINATED
5
$90,222
22
$86,666
105
$88,793
8
$20,189
4
$63,150
APPLICATIONS APPROVED, NOT ACCEPTED
0
$0
3
$67,890
22
$82,019
1
$60,860
2
$51,115
APPLICATIONS DENIED
1
$63,650
6
$80,223
47
$91,477
5
$19,174
3
$91,760
APPLICATIONS WITHDRAWN
0
$0
4
$72,200
21
$100,132
1
$23,470
0
$0
FILES CLOSED FOR INCOMPLETENESS
0
$0
1
$34,210
8
$100,692
0
$0
0
$0
Aggregated Statistics For Year 2002 (Based on 2 partial tracts)
A) FHA, FSA/RHS & VA Home Purchase Loans
B) Conventional Home Purchase Loans
C) Refinancings
D) Home Improvement Loans
F) Non-occupant Loans on < 5 Family Dwellings (A B C & D)
Number
Average Value
Number
Average Value
Number
Average Value
Number
Average Value
Number
Average Value
LOANS ORIGINATED
2
$88,115
31
$80,304
68
$79,525
8
$16,708
4
$48,232
APPLICATIONS APPROVED, NOT ACCEPTED
1
$54,500
5
$69,536
24
$95,107
2
$7,955
0
$0
APPLICATIONS DENIED
1
$75,580
10
$55,732
37
$84,979
5
$29,516
1
$46,540
APPLICATIONS WITHDRAWN
0
$0
4
$96,665
23
$85,406
2
$13,125
0
$0
FILES CLOSED FOR INCOMPLETENESS
0
$0
0
$0
9
$84,333
0
$0
1
$53,310
Aggregated Statistics For Year 2001 (Based on 2 partial tracts)
A) FHA, FSA/RHS & VA Home Purchase Loans
B) Conventional Home Purchase Loans
C) Refinancings
D) Home Improvement Loans
F) Non-occupant Loans on < 5 Family Dwellings (A B C & D)
Number
Average Value
Number
Average Value
Number
Average Value
Number
Average Value
Number
Average Value
LOANS ORIGINATED
5
$88,948
22
$73,774
76
$85,862
9
$15,779
6
$84,467
APPLICATIONS APPROVED, NOT ACCEPTED
0
$0
4
$54,698
18
$73,063
1
$11,540
1
$17,900
APPLICATIONS DENIED
0
$0
15
$51,767
41
$88,554
4
$20,188
3
$44,820
APPLICATIONS WITHDRAWN
0
$0
1
$53,700
23
$78,643
1
$19,890
0
$0
FILES CLOSED FOR INCOMPLETENESS
0
$0
0
$0
2
$76,575
0
$0
0
$0
Aggregated Statistics For Year 2000 (Based on 2 partial tracts)
A) FHA, FSA/RHS & VA Home Purchase Loans
B) Conventional Home Purchase Loans
C) Refinancings
D) Home Improvement Loans
F) Non-occupant Loans on < 5 Family Dwellings (A B C & D)
Number
Average Value
Number
Average Value
Number
Average Value
Number
Average Value
Number
Average Value
LOANS ORIGINATED
1
$44,550
22
$78,963
39
$57,079
11
$15,116
4
$68,920
APPLICATIONS APPROVED, NOT ACCEPTED
0
$0
6
$61,792
14
$55,749
4
$15,315
0
$0
APPLICATIONS DENIED
1
$108,600
15
$51,635
25
$66,560
6
$20,685
2
$29,435
APPLICATIONS WITHDRAWN
0
$0
4
$90,698
14
$66,291
1
$18,300
0
$0
FILES CLOSED FOR INCOMPLETENESS
0
$0
0
$0
3
$52,243
0
$0
0
$0
Aggregated Statistics For Year 1999 (Based on 1 partial tract)
A) FHA, FSA/RHS & VA Home Purchase Loans
B) Conventional Home Purchase Loans
C) Refinancings
D) Home Improvement Loans
F) Non-occupant Loans on < 5 Family Dwellings (A B C & D)
Detailed PMIC statistics for the following Tracts:9510.00
2002 - 2018 National Fire Incident Reporting System (NFIRS) incidents
Based on the data from the years 2002 - 2018 the average number of fires per year is 8. The highest number of reported fires - 33 took place in 2008, and the least - 1 in 2016. The data has a decreasing trend.
When looking into fire subcategories, the most reports belonged to: Structure Fires (50.8%), and Outside Fires (34.8%).
Fire incident types reported to NFIRS in Zip Code 44427


 Nearest zip codes: 44423, 44625, 44607, 43962, 44651, 43945.


 Based on the data from the years 2002 - 2018 the average number of fires per year is 8. The highest number of reported fires - 33 took place in 2008, and the least - 1 in 2016. The data has a decreasing trend.
 When looking into fire subcategories, the most reports belonged to: Structure Fires (50.8%), and Outside Fires (34.8%).