Estimated zip code population in 2022: 945 Zip code population in 2010: 1,435 Zip code population in 2000: 1,393
Houses and condos: 456 Renter-occupied apartments: 55
% of renters here:
13%
State:
33%
March 2022 cost of living index in zip code 45312: 84.8 (less than average, U.S. average is 100)
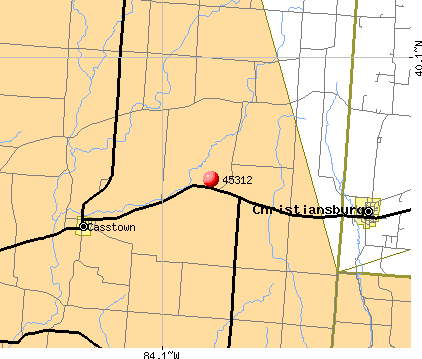
Land area: 27.6 sq. mi. Water area: 0.0 sq. mi.
Population density: 34 people per square mile
(very low).
OSM Map
General Map
Google Map
MSN Map
OSM Map
General Map
Google Map
MSN Map
OSM Map
General Map
Google Map
MSN Map
OSM Map
General Map
Google Map
MSN Map
Please wait while loading the map...
Real estate property taxes paid for housing units in 2022:
This zip code:
1.0% ($2,253)
Ohio:
1.3% ($2,639)
Median real estate property taxes paid for housing units with mortgages in 2022: $1,986 (0.8%) Median real estate property taxes paid for housing units with no mortgage in 2022: $2,548 (1.3%)
Business Search- 14 Million verified businesses
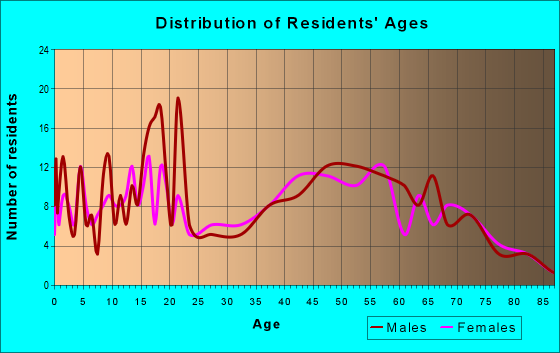
Males: 512
(54.2%)
Females: 432
(45.8%)
For population 25 years and over in 45312:
High school or higher: 95.2%
Bachelor's degree or higher: 13.2%
Graduate or professional degree: 2.9%
Unemployed: 5.5%
Mean travel time to work (commute): 22.4 minutes
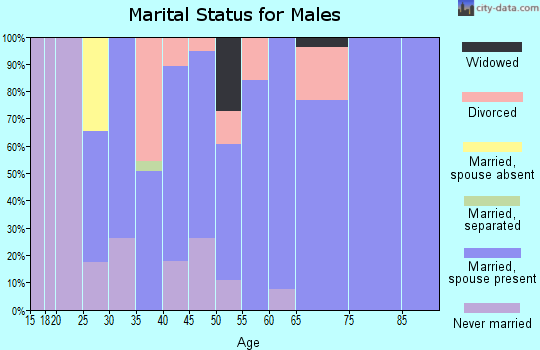
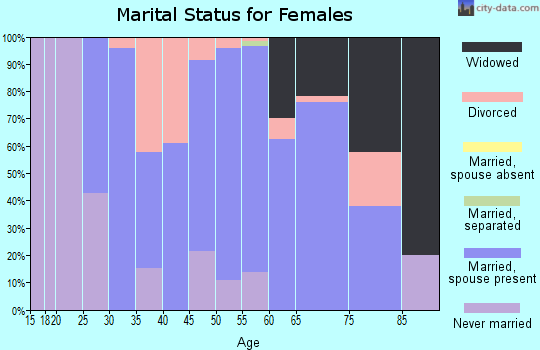
For population 15 years and over in 45312:
Never married: 22.0%
Now married: 59.5%
Separated: 2.9%
Widowed: 9.3%
Divorced: 6.3%
Zip code 45312 compared to state average:
Black race population percentage significantly below state average.
Hispanic race population percentage significantly below state average.
Median age significantly above state average.
Foreign-born population percentage significantly below state average.
Renting percentage significantly below state average.
Length of stay since moving in significantly above state average.
Percentage of population with a bachelor's degree or higher significantly below state average.
Estimated median house/condo value in 2022: $221,470
45312:
$221,470
Ohio:
$204,100
According to our research of Ohio and other state lists, there was 1 registered sex offender living in 45312 zip code as of May 17, 2024. The ratio of all residents to sex offenders in zip code 45312 is 1,431 to 1. The ratio of registered sex offenders to all residents in this zip code is much lower than the state average.
Median resident age:
This zip code:
51.8 years
Ohio median age:
39.9 years
Average household size:
This zip code:
2.2 people
Ohio:
2.4 people
Averages for the 2020 tax year for zip code 45312, filed in 2021:
Average Adjusted Gross Income (AGI) in 2020: $69,684 (Individual Income Tax Returns)
Here:
$69,684
State:
$67,288
Salary/wage: $60,029 (reported on 78.7% of returns)
Here:
$60,029
State:
$55,628
(% of AGI for various income ranges: 1263.6% for AGIs below $25k, 3341.5% for AGIs $25k-50k, 6448.9% for AGIs $50k-75k, 10021.4% for AGIs $75k-100k, 20926.7% for AGIs $100k-200k)
Taxable interest for individuals: $661 (reported on 41.3% of returns)
This zip code:
$661
Ohio:
$1,518
(% of AGI for various income ranges: 13.6% for AGIs below $25k, 35.4% for AGIs $25k-50k, 21.1% for AGIs $50k-75k, 22.9% for AGIs $75k-100k, 181.7% for AGIs $100k-200k)
Ordinary dividends: $3,561 (reported on 24.0% of returns)
Here:
$3,561
State:
$7,167
(% of AGI for various income ranges: 22.7% for AGIs below $25k, 16.2% for AGIs $25k-50k, 36.7% for AGIs $50k-75k, 212.9% for AGIs $75k-100k, 688.3% for AGIs $100k-200k)
Net capital gain/loss in AGI: +$5,938 (reported on 21.3% of returns)
Here:
+$5,938
State:
+$18,919
(% of AGI for various income ranges: 20.9% for AGIs below $25k, 53.1% for AGIs $25k-50k, 361.4% for AGIs $75k-100k, 1008.3% for AGIs $100k-200k)
Profit/loss from business: +$9,791 (reported on 14.7% of returns)
Here:
+$9,791
State:
+$13,744
(% of AGI for various income ranges: 101.8% for AGIs below $25k, 113.1% for AGIs $25k-50k, 611.4% for AGIs $75k-100k, 650.0% for AGIs $100k-200k)
Taxable individual retirement arrangement distribution: $13,112 (reported on 10.7% of returns)
45312:
$13,112
Ohio:
$18,876
(% of AGI for various income ranges: 273.8% for AGIs $25k-50k, 990.0% for AGIs $75k-100k)
Total itemized deductions: $31,867 (reported on 4.0% of returns)
Here:
$31,867
State:
$33,869
(% of AGI for various income ranges: 1593.3% for AGIs $100k-200k)
Charity contributions: $7,133 (reported on 4.0% of returns)
Here:
$7,133
State:
$14,577
(% of AGI for various income ranges: 356.7% for AGIs $100k-200k)
Taxes paid: $9,267 (reported on 4.0% of returns)
45312:
$9,267
State:
$7,681
(% of AGI for various income ranges: 463.3% for AGIs $100k-200k)
Earned income credit: $2,078 (reported on 12.0% of returns)
Here:
$2,078
State:
$2,304
(% of AGI for various income ranges: 100.0% for AGIs below $25k, 59.2% for AGIs $25k-50k)
Percentage of individuals using paid preparers for their 2020 taxes: 94.7%
Here:
95%
State:
94%
(% for various income ranges: 89.5% for AGIs below $25k, 94.1% for AGIs $25k-50k, 100.0% for AGIs $50k-75k, 100.0% for AGIs $75k-100k, 92.3% for AGIs $100k-200k, 100.0% for AGIs over 200k)
Averages for the 2012 tax year for zip code 45312, filed in 2013:
Average Adjusted Gross Income (AGI) in 2012: $54,028 (Individual Income Tax Returns)
Here:
$54,028
State:
$54,926
Salary/wage: $46,910 (reported on 80.0% of returns)
Here:
$46,910
State:
$45,869
(% of AGI for various income ranges: 70.2% for AGIs below $25k, 69.6% for AGIs $25k-50k, 71.1% for AGIs $50k-75k, 70.3% for AGIs $75k-100k, 68.0% for AGIs $100k-200k)
Taxable interest for individuals: $430 (reported on 44.0% of returns)
This zip code:
$430
Ohio:
$1,297
(% of AGI for various income ranges: 0.5% for AGIs below $25k, 0.6% for AGIs $25k-50k, 0.2% for AGIs $50k-75k, 0.2% for AGIs $75k-100k, 0.3% for AGIs $100k-200k)
Ordinary dividends: $3,056 (reported on 21.3% of returns)
Here:
$3,056
State:
$5,821
(% of AGI for various income ranges: 1.1% for AGIs below $25k, 0.7% for AGIs $25k-50k, 0.8% for AGIs $50k-75k, 1.8% for AGIs $75k-100k, 1.3% for AGIs $100k-200k)
Net capital gain/loss in AGI: +$3,464 (reported on 14.7% of returns)
Here:
+$3,464
State:
+$11,232
(% of AGI for various income ranges: 0.5% for AGIs $50k-75k, 1.0% for AGIs $75k-100k, 1.7% for AGIs $100k-200k)
Profit/loss from business: +$5,907 (reported on 20.0% of returns)
Here:
+$5,907
State:
+$12,773
(% of AGI for various income ranges: 9.8% for AGIs below $25k, 4.9% for AGIs $25k-50k, 3.4% for AGIs $50k-75k, 0.1% for AGIs $100k-200k)
Taxable individual retirement arrangement distribution: $10,760 (reported on 13.3% of returns)
45312:
$10,760
Ohio:
$14,511
(% of AGI for various income ranges: 4.9% for AGIs $25k-50k, 3.6% for AGIs $50k-75k, 6.0% for AGIs $75k-100k)
Total itemized deductions: $18,256 (20% of AGI, reported on 36.0% of returns)
Here:
$18,256
State:
$21,278
Here:
20.5% of AGI
State:
18.8% of AGI
(% of AGI for various income ranges: 11.0% for AGIs below $25k, 8.3% for AGIs $25k-50k, 10.2% for AGIs $50k-75k, 14.6% for AGIs $75k-100k, 13.7% for AGIs $100k-200k)
Charity contributions: $2,843 (reported on 28.0% of returns)
Here:
$2,843
State:
$3,943
(% of AGI for various income ranges: 0.9% for AGIs $25k-50k, 1.2% for AGIs $50k-75k, 1.7% for AGIs $75k-100k, 2.0% for AGIs $100k-200k)
Taxes paid: $7,174 (reported on 36.0% of returns)
45312:
$7,174
State:
$9,568
(% of AGI for various income ranges: 3.6% for AGIs $25k-50k, 3.5% for AGIs $50k-75k, 5.5% for AGIs $75k-100k, 6.4% for AGIs $100k-200k)
Earned income credit: $2,022 (reported on 12.0% of returns)
Here:
$2,022
State:
$2,285
(% of AGI for various income ranges: 4.5% for AGIs below $25k, 0.8% for AGIs $25k-50k)
Percentage of individuals using paid preparers for their 2012 taxes: 60.0%
Here:
60%
State:
51%
(% for various income ranges: 52.0% for AGIs below $25k, 61.1% for AGIs $25k-50k, 66.7% for AGIs $50k-75k, 66.7% for AGIs $75k-100k, 63.6% for AGIs $100k-200k)
Averages for the 2004 tax year for zip code 45312, filed in 2005:
Average Adjusted Gross Income (AGI) in 2004: $42,229 (Individual Income Tax Returns)
Here:
$42,229
State:
$44,480
Salary/wage: $39,088 (reported on 86.8% of returns)
Here:
$39,088
State:
$39,198
(% of AGI for various income ranges: 143.8% for AGIs below $10k, 67.9% for AGIs $10k-25k, 78.9% for AGIs $25k-50k, 85.1% for AGIs $50k-75k, 90.0% for AGIs $75k-100k, 69.6% for AGIs over 100k)
Taxable interest for individuals: $762 (reported on 46.6% of returns)
This zip code:
$762
Ohio:
$1,532
(% of AGI for various income ranges: 7.9% for AGIs below $10k, 2.3% for AGIs $10k-25k, 0.9% for AGIs $25k-50k, 0.4% for AGIs $50k-75k, 0.5% for AGIs $75k-100k, 0.6% for AGIs over 100k)
Taxable dividends: $1,872 (reported on 23.6% of returns)
Here:
$1,872
State:
$3,496
(% of AGI for various income ranges: 2.9% for AGIs below $10k, 1.5% for AGIs $10k-25k, 1.2% for AGIs $25k-50k, 0.5% for AGIs $50k-75k, 1.0% for AGIs $75k-100k, 1.2% for AGIs over 100k)
Net capital gain/loss: +$3,844 (reported on 17.5% of returns)
Here:
+$3,844
State:
+$8,582
(% of AGI for various income ranges: -3.3% for AGIs below $10k, 0.2% for AGIs $10k-25k, 0.0% for AGIs $25k-50k, 0.2% for AGIs $50k-75k, -0.2% for AGIs $75k-100k, 7.3% for AGIs over 100k)
Profit/loss from business: +$7,319 (reported on 15.5% of returns)
Here:
+$7,319
State:
+$10,813
(% of AGI for various income ranges: -4.8% for AGIs below $10k, 4.7% for AGIs $10k-25k, 4.1% for AGIs $25k-50k, 1.4% for AGIs $50k-75k, 0.9% for AGIs $75k-100k, 3.6% for AGIs over 100k)
IRA payment deduction: $2,611 (reported on 2.5% of returns)
45312:
$2,611
Ohio:
$2,794
Total itemized deductions: $15,889 (23% of AGI, reported on 35.9% of returns)
Here:
$15,889
State:
$17,503
Here:
22.9% of AGI
State:
20.8% of AGI
(% of AGI for various income ranges: 13.6% for AGIs $10k-25k, 12.1% for AGIs $25k-50k, 12.0% for AGIs $50k-75k, 16.1% for AGIs $75k-100k, 15.5% for AGIs over 100k)
Charity contributions deductions: $2,457 (3% of AGI, reported on 27.3% of returns)
Here:
$2,457
State:
$3,087
Here:
3.3% of AGI
State:
3.4% of AGI
(% of AGI for various income ranges: 0.9% for AGIs $10k-25k, 1.1% for AGIs $25k-50k, 1.0% for AGIs $50k-75k, 1.6% for AGIs $75k-100k, 3.2% for AGIs over 100k)
Total tax: $5,066 (reported on 79.3% of returns)
45312:
$5,066
State:
$6,781
(% of AGI for various income ranges: 2.9% for AGIs below $10k, 4.6% for AGIs $10k-25k, 7.4% for AGIs $25k-50k, 8.2% for AGIs $50k-75k, 9.6% for AGIs $75k-100k, 15.6% for AGIs over 100k)
Earned income credit: $1,231 (reported on 7.1% of returns)
Here:
$1,231
State:
$1,696
Percentage of individuals using paid preparers for their 2004 taxes: 60.5%
Here:
61%
State:
55%
(% for various income ranges: 43.9% for AGIs below $10k, 63.7% for AGIs $10k-25k, 66.8% for AGIs $25k-50k, 68.0% for AGIs $50k-75k, 53.1% for AGIs $75k-100k, 62.5% for AGIs over 100k)
Household received Food Stamps/SNAP in the past 12 months: 4 Household did not receive Food Stamps/SNAP in the past 12 months: 415
Women who had a birth in the past 12 months: 6 (7 now married, 0 unmarried) Women who did not have a birth in the past 12 months: 111 (75 now married, 35 unmarried)
Housing units in zip code 45312 with a mortgage: 182 (13 second mortgage, 7 both second mortgage and home equity loan) Median monthly owner costs for units with a mortgage: $1,457 Median monthly owner costs for units without a mortgage: $527
Residents with income below the poverty level in 2022:
This zip code:
0.6%
Whole state:
13.4%
Residents with income below 50% of the poverty level in 2022:
This zip code:
0.6%
Whole state:
7.0%
Median number of rooms in houses and condos:
Here:
7.3
State:
6.7
Median number of rooms in apartments:
Here:
5.4
State:
4.4
Notable locations in this zip code not listed on our city pages
Notable locations in zip code 45312: Bodenmiller Farms (A), Bair Farms (B), Butler Farm (C), Henger Farms (D), Bel Mar Farms (E), Rat Fork Farm (F), Killdeer Ridge Farms (G), Circle G Farm (H), Castle Hill Farm (I), Volk Fruit Farms (J), Double J Farm (K), Casstown Community Volunteer Fire Company (L), Garden Stone Greenhouse (M). Display/hide their locations on the map
Churches in zip code 45312 include: Lost Creek Church (A), Casstown Lutheran Church (B), Casstown United Methodist Church (C). Display/hide their locations on the map
Cemeteries: Bright Cemetery (1), Sodom Cemetery (2), Casstown Cemetery (3), Johnston Cemetery (4), Lewis Cemetery (5), Youtsey Cemetery (6), Lost Creek Cemetery (7). Display/hide their locations on the map
Size of family households: 169 2-persons, 51 3-persons, 41 4-persons, 13 5-persons, 12 6-persons
Size of nonfamily households: 126 1-person, 6 2-persons
139 married couples with children.
35 single-parent households (23 men, 12 women).
98.1% of residents of 45312 zip code speak English at home.
1.0% of residents speak Spanish at home (100% very well).
1.4% of residents speak other Indo-European language at home (100% very well).
Foreign born population: 0 (0.0%)
:
0.0%
Whole state:
5.0%
32%American
25%German
21%English
7%Irish
4%European
2%Italian
2%Polish
Facilities with environmental interests located in this zip code:
CASSTOWN ELEMENTARY SCHOOL (4308 E ST RTE 55 in CASSTOWN, OH)
AIR MINOR (AIRS/AFS) STATE MASTER (Ohio general info) - AIR MAJOR Business SIC classification: ELEMENTARY AND SECONDARY SCHOOLS Alternative names: CASSTOWN ELEM SCHOOL
Housing units lacking complete kitchen facilities: 5.2%
32.2%Electricity
24.1%Bottled, tank, or LP gas
21.9%Utility gas
9.7%Other fuel
7.8%Fuel oil, kerosene, etc.
5.1%Wood
Population in 1990: 1,283. Population change in the 1990s: +110 (+8.6%).
Place of birth for U.S.-born residents:
This state: 826
Northeast: 9
Midwest: 49
South: 38
West: 20
71% of the 45312 zip code residents lived in the same house 5 years ago. Out of people who lived in different houses, 51% lived in this county. Out of people who lived in different counties, 50% lived in Ohio.
94% of the 45312 zip code residents lived in the same house 1 year ago. Out of people who lived in different houses, 83% moved from this county. Out of people who lived in different houses, 5% moved from different county within same state. Out of people who lived in different houses, 10% moved from different state.
Private vs. public school enrollment:
Students in private schools in grades 1 to 8 (elementary and middle school):
Here:
0.0%
Ohio:
16.0%
Students in private schools in grades 9 to 12 (high school): 13
Here:
21.1%
Ohio:
13.1%
Students in private undergraduate colleges:
Here:
0.0%
Ohio:
22.3%
Occupation by median earnings in the past 12 months ($)
63,119Management occupations
59,246Business and financial operations occupations
55,083Construction and extraction occupations
54,943Sales and related occupations
52,241Health technologists and technicians
51,688Office and administrative support occupations
Top industries in this zip code by the number of employees in 2005:
Administrative and Support and Waste Management and Remediation Services: Solid Waste Landfill (5-9 employees: 1 establishment)
Wholesale Trade: Farm and Garden Machinery and Equipment Merchant Wholesalers (5-9: 1)
Administrative and Support and Waste Management and Remediation Services: Landscaping Services (1-4: 2)
Health Care and Social Assistance: Ambulance Services (1-4: 1)
Other Services (except Public Administration): Religious Organizations (1-4: 1)
Professional, Scientific, and Technical Services: Offices of Certified Public Accountants (1-4: 1)
Construction: Drywall and Insulation Contractors (1-4: 1)
Construction: Tile and Terrazzo Contractors (1-4: 1)
Other Services (except Public Administration): Civic and Social Organizations (1-4: 1)
Fatal accident statistics in 2012:
Fatal accident count: 1
Vehicles involved in fatal accidents: 1
Fatal accidents caused by drunken drivers: 1
Fatalities: 1
Persons involved in fatal accidents: 1
Pedestrians involved in fatal accidents: 0
Home Mortgage Disclosure Act Aggregated Statistics For Year 2009 (Based on 2 partial tracts)
A) FHA, FSA/RHS & VA Home Purchase Loans
B) Conventional Home Purchase Loans
C) Refinancings
D) Home Improvement Loans
F) Non-occupant Loans on < 5 Family Dwellings (A B C & D)
G) Loans On Manufactured Home Dwelling (A B C & D)
Number
Average Value
Number
Average Value
Number
Average Value
Number
Average Value
Number
Average Value
Number
Average Value
LOANS ORIGINATED
5
$100,584
10
$153,842
103
$143,961
3
$141,010
3
$188,420
1
$33,290
APPLICATIONS APPROVED, NOT ACCEPTED
0
$0
1
$84,120
11
$153,611
1
$58,100
0
$0
1
$38,130
APPLICATIONS DENIED
4
$123,310
2
$319,545
44
$135,042
2
$11,800
0
$0
1
$35,710
APPLICATIONS WITHDRAWN
0
$0
1
$119,830
10
$142,464
1
$93,810
0
$0
0
$0
FILES CLOSED FOR INCOMPLETENESS
0
$0
0
$0
1
$156,750
0
$0
0
$0
0
$0
Aggregated Statistics For Year 2008 (Based on 2 partial tracts)
A) FHA, FSA/RHS & VA Home Purchase Loans
B) Conventional Home Purchase Loans
C) Refinancings
D) Home Improvement Loans
F) Non-occupant Loans on < 5 Family Dwellings (A B C & D)
G) Loans On Manufactured Home Dwelling (A B C & D)
Number
Average Value
Number
Average Value
Number
Average Value
Number
Average Value
Number
Average Value
Number
Average Value
LOANS ORIGINATED
10
$131,813
19
$135,437
46
$126,421
5
$125,398
2
$90,175
0
$0
APPLICATIONS APPROVED, NOT ACCEPTED
0
$0
0
$0
5
$128,424
0
$0
0
$0
0
$0
APPLICATIONS DENIED
1
$176,110
6
$169,960
30
$136,473
3
$67,783
0
$0
1
$80,490
APPLICATIONS WITHDRAWN
1
$56,280
2
$183,375
15
$132,942
1
$15,740
0
$0
0
$0
FILES CLOSED FOR INCOMPLETENESS
0
$0
0
$0
2
$122,250
1
$5,450
0
$0
0
$0
Aggregated Statistics For Year 2007 (Based on 2 partial tracts)
A) FHA, FSA/RHS & VA Home Purchase Loans
B) Conventional Home Purchase Loans
C) Refinancings
D) Home Improvement Loans
F) Non-occupant Loans on < 5 Family Dwellings (A B C & D)
G) Loans On Manufactured Home Dwelling (A B C & D)
Number
Average Value
Number
Average Value
Number
Average Value
Number
Average Value
Number
Average Value
Number
Average Value
LOANS ORIGINATED
4
$100,312
39
$138,591
45
$125,465
9
$62,672
4
$101,672
1
$113,780
APPLICATIONS APPROVED, NOT ACCEPTED
0
$0
5
$146,096
13
$106,236
2
$32,075
1
$30,870
1
$23,600
APPLICATIONS DENIED
1
$70,810
10
$167,277
36
$122,284
10
$48,719
2
$88,055
0
$0
APPLICATIONS WITHDRAWN
1
$252,970
2
$63,850
11
$87,699
1
$20,580
1
$39,340
0
$0
FILES CLOSED FOR INCOMPLETENESS
0
$0
1
$66,570
2
$195,175
0
$0
0
$0
0
$0
Aggregated Statistics For Year 2006 (Based on 2 partial tracts)
A) FHA, FSA/RHS & VA Home Purchase Loans
B) Conventional Home Purchase Loans
C) Refinancings
D) Home Improvement Loans
F) Non-occupant Loans on < 5 Family Dwellings (A B C & D)
G) Loans On Manufactured Home Dwelling (A B C & D)
Number
Average Value
Number
Average Value
Number
Average Value
Number
Average Value
Number
Average Value
Number
Average Value
LOANS ORIGINATED
2
$134,050
36
$144,122
67
$117,066
10
$42,001
5
$70,808
2
$134,960
APPLICATIONS APPROVED, NOT ACCEPTED
0
$0
6
$138,590
11
$121,865
6
$115,392
1
$9,080
0
$0
APPLICATIONS DENIED
0
$0
11
$147,999
47
$134,110
7
$68,560
2
$188,820
2
$88,360
APPLICATIONS WITHDRAWN
0
$0
3
$158,763
22
$114,383
2
$111,355
1
$173,690
0
$0
FILES CLOSED FOR INCOMPLETENESS
0
$0
2
$229,675
7
$176,286
2
$24,210
1
$49,020
0
$0
Aggregated Statistics For Year 2005 (Based on 2 partial tracts)
A) FHA, FSA/RHS & VA Home Purchase Loans
B) Conventional Home Purchase Loans
C) Refinancings
D) Home Improvement Loans
F) Non-occupant Loans on < 5 Family Dwellings (A B C & D)
G) Loans On Manufactured Home Dwelling (A B C & D)
Number
Average Value
Number
Average Value
Number
Average Value
Number
Average Value
Number
Average Value
Number
Average Value
LOANS ORIGINATED
4
$113,930
46
$132,855
79
$112,843
11
$51,112
2
$65,060
2
$102,580
APPLICATIONS APPROVED, NOT ACCEPTED
0
$0
2
$144,340
21
$112,106
2
$88,360
1
$36,920
1
$17,550
APPLICATIONS DENIED
1
$95,620
13
$88,266
47
$114,975
8
$113,399
2
$65,060
1
$95,620
APPLICATIONS WITHDRAWN
0
$0
7
$141,530
21
$131,184
2
$97,435
1
$85,940
0
$0
FILES CLOSED FOR INCOMPLETENESS
0
$0
2
$177,930
7
$111,703
0
$0
1
$80,490
0
$0
Aggregated Statistics For Year 2004 (Based on 2 partial tracts)
A) FHA, FSA/RHS & VA Home Purchase Loans
B) Conventional Home Purchase Loans
C) Refinancings
D) Home Improvement Loans
F) Non-occupant Loans on < 5 Family Dwellings (A B C & D)
G) Loans On Manufactured Home Dwelling (A B C & D)
Number
Average Value
Number
Average Value
Number
Average Value
Number
Average Value
Number
Average Value
Number
Average Value
LOANS ORIGINATED
4
$96,075
43
$136,100
84
$125,810
10
$93,201
2
$83,520
1
$72,620
APPLICATIONS APPROVED, NOT ACCEPTED
0
$0
5
$98,406
21
$69,281
1
$13,920
1
$55,680
1
$68,990
APPLICATIONS DENIED
1
$190,030
8
$177,701
45
$92,327
8
$35,026
4
$57,192
0
$0
APPLICATIONS WITHDRAWN
0
$0
4
$114,535
29
$122,897
2
$86,845
0
$0
0
$0
FILES CLOSED FOR INCOMPLETENESS
0
$0
1
$82,310
5
$119,588
1
$107,730
1
$53,860
0
$0
Aggregated Statistics For Year 2003 (Based on 2 partial tracts)
A) FHA, FSA/RHS & VA Home Purchase Loans
B) Conventional Home Purchase Loans
C) Refinancings
D) Home Improvement Loans
F) Non-occupant Loans on < 5 Family Dwellings (A B C & D)
Number
Average Value
Number
Average Value
Number
Average Value
Number
Average Value
Number
Average Value
LOANS ORIGINATED
7
$101,500
38
$108,586
168
$120,446
6
$17,753
3
$62,133
APPLICATIONS APPROVED, NOT ACCEPTED
1
$135,560
3
$130,117
21
$102,480
1
$20,580
3
$82,510
APPLICATIONS DENIED
1
$101,670
7
$76,687
58
$101,298
10
$14,585
2
$82,005
APPLICATIONS WITHDRAWN
0
$0
2
$85,940
45
$101,620
0
$0
1
$48,420
FILES CLOSED FOR INCOMPLETENESS
0
$0
2
$73,230
10
$115,170
0
$0
0
$0
Aggregated Statistics For Year 2002 (Based on 2 partial tracts)
A) FHA, FSA/RHS & VA Home Purchase Loans
B) Conventional Home Purchase Loans
C) Refinancings
D) Home Improvement Loans
F) Non-occupant Loans on < 5 Family Dwellings (A B C & D)
Number
Average Value
Number
Average Value
Number
Average Value
Number
Average Value
Number
Average Value
LOANS ORIGINATED
7
$103,749
30
$125,135
122
$113,277
4
$28,142
3
$121,040
APPLICATIONS APPROVED, NOT ACCEPTED
1
$47,210
4
$130,722
16
$102,695
1
$18,160
0
$0
APPLICATIONS DENIED
1
$36,920
5
$126,728
37
$132,719
5
$26,266
2
$77,465
APPLICATIONS WITHDRAWN
2
$117,105
4
$94,108
24
$103,741
0
$0
0
$0
FILES CLOSED FOR INCOMPLETENESS
1
$49,020
1
$228,770
5
$147,548
0
$0
0
$0
Aggregated Statistics For Year 2001 (Based on 2 partial tracts)
A) FHA, FSA/RHS & VA Home Purchase Loans
B) Conventional Home Purchase Loans
C) Refinancings
D) Home Improvement Loans
F) Non-occupant Loans on < 5 Family Dwellings (A B C & D)
Number
Average Value
Number
Average Value
Number
Average Value
Number
Average Value
Number
Average Value
LOANS ORIGINATED
5
$96,348
28
$118,079
112
$106,164
14
$20,144
4
$42,062
APPLICATIONS APPROVED, NOT ACCEPTED
1
$137,990
2
$233,910
18
$71,952
2
$15,130
1
$59,910
APPLICATIONS DENIED
1
$49,020
1
$57,490
45
$98,594
12
$12,962
1
$36,310
APPLICATIONS WITHDRAWN
1
$49,020
2
$88,965
25
$94,218
3
$14,120
0
$0
FILES CLOSED FOR INCOMPLETENESS
0
$0
1
$171,880
4
$98,950
0
$0
0
$0
Aggregated Statistics For Year 2000 (Based on 2 partial tracts)
A) FHA, FSA/RHS & VA Home Purchase Loans
B) Conventional Home Purchase Loans
C) Refinancings
D) Home Improvement Loans
F) Non-occupant Loans on < 5 Family Dwellings (A B C & D)
Number
Average Value
Number
Average Value
Number
Average Value
Number
Average Value
Number
Average Value
LOANS ORIGINATED
4
$91,082
29
$128,532
34
$89,605
19
$18,666
2
$354,950
APPLICATIONS APPROVED, NOT ACCEPTED
0
$0
3
$88,963
15
$71,737
4
$14,675
0
$0
APPLICATIONS DENIED
1
$29,050
6
$93,807
27
$98,401
10
$19,185
0
$0
APPLICATIONS WITHDRAWN
0
$0
2
$86,240
8
$83,442
1
$6,050
0
$0
FILES CLOSED FOR INCOMPLETENESS
0
$0
1
$66,570
2
$62,940
0
$0
0
$0
Aggregated Statistics For Year 1999 (Based on 1 partial tract)
A) FHA, FSA/RHS & VA Home Purchase Loans
B) Conventional Home Purchase Loans
C) Refinancings
D) Home Improvement Loans
F) Non-occupant Loans on < 5 Family Dwellings (A B C & D)
Detailed PMIC statistics for the following Tracts:3901.00
2002 - 2018 National Fire Incident Reporting System (NFIRS) incidents
Based on the data from the years 2002 - 2018 the average number of fires per year is 13. The highest number of reported fires - 31 took place in 2014, and the least - 4 in 2002. The data has an increasing trend.
When looking into fire subcategories, the most incidents belonged to: Outside Fires (50.7%), and Structure Fires (39.5%).
Fire incident types reported to NFIRS in Zip Code 45312


 Nearest zip codes: 45389, 45326, 45373, 45344, 45371, 43072.


 Based on the data from the years 2002 - 2018 the average number of fires per year is 13. The highest number of reported fires - 31 took place in 2014, and the least - 4 in 2002. The data has an increasing trend.
 When looking into fire subcategories, the most incidents belonged to: Outside Fires (50.7%), and Structure Fires (39.5%).