Estimated zip code population in 2022: 3,096 Zip code population in 2010: 2,812 Zip code population in 2000: 2,687
Houses and condos: 1,365 Renter-occupied apartments: 334
% of renters here:
28%
State:
33%
March 2022 cost of living index in zip code 45679: 84.2 (less than average, U.S. average is 100)
Land area: 58.0 sq. mi. Water area: 0.0 sq. mi.
Population density: 53 people per square mile
(very low).
OSM Map
General Map
Google Map
MSN Map
OSM Map
General Map
Google Map
MSN Map
OSM Map
General Map
Google Map
MSN Map
OSM Map
General Map
Google Map
MSN Map
Please wait while loading the map...
Real estate property taxes paid for housing units in 2022:
This zip code:
0.8% ($1,407)
Ohio:
1.3% ($2,639)
Median real estate property taxes paid for housing units with mortgages in 2022: $1,652 (0.9%) Median real estate property taxes paid for housing units with no mortgage in 2022: $1,097 (0.9%)
Business Search- 14 Million verified businesses
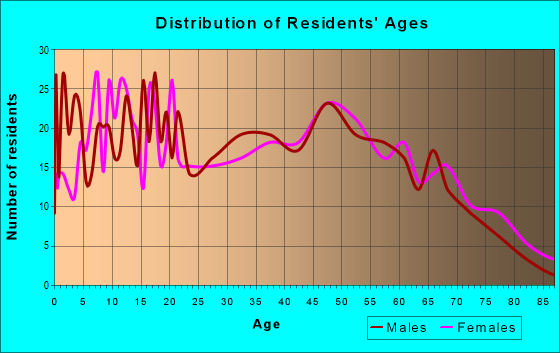
Males: 1,354
(43.8%)
Females: 1,740
(56.2%)
For population 25 years and over in 45679:
High school or higher: 84.6%
Bachelor's degree or higher: 17.6%
Graduate or professional degree: 8.6%
Unemployed: 4.9%
Mean travel time to work (commute): 33.6 minutes
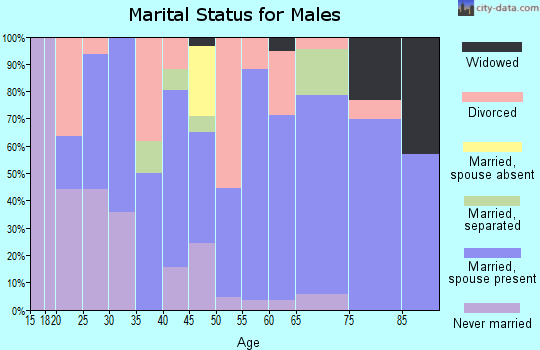
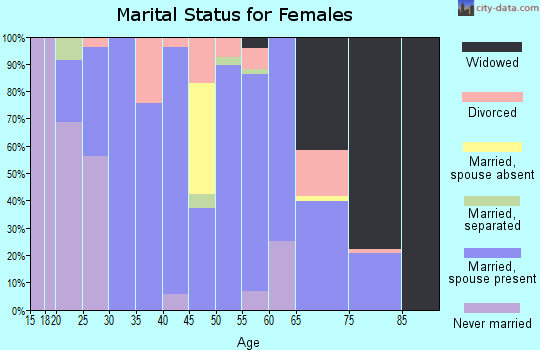
For population 15 years and over in 45679:
Never married: 23.2%
Now married: 57.5%
Separated: 1.7%
Widowed: 6.6%
Divorced: 11.0%
Zip code 45679 compared to state average:
Median household income below state average.
Black race population percentage significantly below state average.
Hispanic race population percentage significantly below state average.
Foreign-born population percentage significantly below state average.
Length of stay since moving in significantly above state average.
Number of college students significantly below state average.
Percentage of population with a bachelor's degree or higher below state average.
Averages for the 2020 tax year for zip code 45679, filed in 2021:
Average Adjusted Gross Income (AGI) in 2020: $48,164 (Individual Income Tax Returns)
Here:
$48,164
State:
$67,288
Salary/wage: $43,804 (reported on 80.6% of returns)
Here:
$43,804
State:
$55,628
(% of AGI for various income ranges: 1267.1% for AGIs below $25k, 3399.0% for AGIs $25k-50k, 6426.9% for AGIs $50k-75k, 9980.0% for AGIs $75k-100k, 15691.1% for AGIs $100k-200k)
Taxable interest for individuals: $826 (reported on 27.1% of returns)
This zip code:
$826
Ohio:
$1,518
(% of AGI for various income ranges: 12.9% for AGIs below $25k, 12.1% for AGIs $25k-50k, 26.9% for AGIs $50k-75k, 21.4% for AGIs $75k-100k, 168.9% for AGIs $100k-200k)
Ordinary dividends: $2,500 (reported on 10.1% of returns)
Here:
$2,500
State:
$7,167
(% of AGI for various income ranges: 14.4% for AGIs below $25k, 17.2% for AGIs $25k-50k, 55.6% for AGIs $50k-75k, 152.2% for AGIs $100k-200k)
Net capital gain/loss in AGI: +$7,077 (reported on 10.1% of returns)
Here:
+$7,077
State:
+$18,919
(% of AGI for various income ranges: 47.9% for AGIs $25k-50k, 191.9% for AGIs $50k-75k, 526.7% for AGIs $100k-200k)
Profit/loss from business: +$11,290 (reported on 16.3% of returns)
Here:
+$11,290
State:
+$13,744
(% of AGI for various income ranges: 99.7% for AGIs below $25k, 204.1% for AGIs $25k-50k, 494.4% for AGIs $50k-75k, 721.1% for AGIs $100k-200k)
Taxable individual retirement arrangement distribution: $12,038 (reported on 6.2% of returns)
45679:
$12,038
Ohio:
$18,876
(% of AGI for various income ranges: 36.2% for AGIs below $25k, 85.2% for AGIs $25k-50k, 370.6% for AGIs $50k-75k)
Earned income credit: $2,688 (reported on 20.2% of returns)
Here:
$2,688
State:
$2,304
(% of AGI for various income ranges: 116.2% for AGIs below $25k, 104.8% for AGIs $25k-50k)
Percentage of individuals using paid preparers for their 2020 taxes: 96.9%
Here:
97%
State:
94%
(% for various income ranges: 95.7% for AGIs below $25k, 100.0% for AGIs $25k-50k, 95.5% for AGIs $50k-75k, 100.0% for AGIs $75k-100k, 92.9% for AGIs $100k-200k)
Averages for the 2012 tax year for zip code 45679, filed in 2013:
Average Adjusted Gross Income (AGI) in 2012: $37,981 (Individual Income Tax Returns)
Here:
$37,981
State:
$54,926
Salary/wage: $33,566 (reported on 80.2% of returns)
Here:
$33,566
State:
$45,869
(% of AGI for various income ranges: 69.0% for AGIs below $25k, 77.6% for AGIs $25k-50k, 74.7% for AGIs $50k-75k, 73.6% for AGIs $75k-100k, 53.4% for AGIs $100k-200k)
Taxable interest for individuals: $936 (reported on 31.0% of returns)
This zip code:
$936
Ohio:
$1,297
(% of AGI for various income ranges: 1.3% for AGIs below $25k, 0.7% for AGIs $25k-50k, 0.7% for AGIs $50k-75k, 0.6% for AGIs $75k-100k, 0.6% for AGIs $100k-200k)
Ordinary dividends: $2,738 (reported on 11.2% of returns)
Here:
$2,738
State:
$5,821
(% of AGI for various income ranges: 0.8% for AGIs below $25k, 0.5% for AGIs $25k-50k, 0.4% for AGIs $50k-75k, 2.6% for AGIs $75k-100k)
Net capital gain/loss in AGI: +$7,373 (reported on 12.9% of returns)
Here:
+$7,373
State:
+$11,232
(% of AGI for various income ranges: 1.1% for AGIs below $25k, 0.9% for AGIs $25k-50k, 2.7% for AGIs $50k-75k, 0.7% for AGIs $75k-100k, 8.0% for AGIs $100k-200k)
Profit/loss from business: +$8,477 (reported on 19.0% of returns)
Here:
+$8,477
State:
+$12,773
(% of AGI for various income ranges: 12.3% for AGIs below $25k, 5.0% for AGIs $25k-50k, 4.2% for AGIs $50k-75k, 0.6% for AGIs $75k-100k)
Taxable individual retirement arrangement distribution: $6,533 (reported on 7.8% of returns)
45679:
$6,533
Ohio:
$14,511
(% of AGI for various income ranges: 2.3% for AGIs below $25k, 1.4% for AGIs $25k-50k, 2.8% for AGIs $50k-75k)
Total itemized deductions: $18,705 (25% of AGI, reported on 18.1% of returns)
Here:
$18,705
State:
$21,278
Here:
25.5% of AGI
State:
18.8% of AGI
(% of AGI for various income ranges: 5.4% for AGIs below $25k, 7.8% for AGIs $25k-50k, 8.9% for AGIs $50k-75k, 10.5% for AGIs $75k-100k, 12.1% for AGIs $100k-200k)
Charity contributions: $3,885 (reported on 11.2% of returns)
Here:
$3,885
State:
$3,943
(% of AGI for various income ranges: 0.9% for AGIs $25k-50k, 1.5% for AGIs $50k-75k, 1.1% for AGIs $75k-100k, 2.1% for AGIs $100k-200k)
Taxes paid: $4,510 (reported on 18.1% of returns)
45679:
$4,510
State:
$9,568
(% of AGI for various income ranges: 1.4% for AGIs $25k-50k, 1.9% for AGIs $50k-75k, 2.7% for AGIs $75k-100k, 4.9% for AGIs $100k-200k)
Earned income credit: $2,340 (reported on 25.9% of returns)
Here:
$2,340
State:
$2,285
(% of AGI for various income ranges: 8.2% for AGIs below $25k, 1.5% for AGIs $25k-50k)
Percentage of individuals using paid preparers for their 2012 taxes: 69.0%
Here:
69%
State:
51%
(% for various income ranges: 60.0% for AGIs below $25k, 72.2% for AGIs $25k-50k, 81.2% for AGIs $50k-75k, 77.8% for AGIs $75k-100k, 80.0% for AGIs $100k-200k)
Averages for the 2004 tax year for zip code 45679, filed in 2005:
Average Adjusted Gross Income (AGI) in 2004: $30,934 (Individual Income Tax Returns)
Here:
$30,934
State:
$44,480
Salary/wage: $29,104 (reported on 82.6% of returns)
Here:
$29,104
State:
$39,198
(% of AGI for various income ranges: 108.1% for AGIs below $10k, 73.4% for AGIs $10k-25k, 84.3% for AGIs $25k-50k, 85.7% for AGIs $50k-75k, 70.6% for AGIs $75k-100k, 48.3% for AGIs over 100k)
Taxable interest for individuals: $1,542 (reported on 38.1% of returns)
This zip code:
$1,542
Ohio:
$1,532
(% of AGI for various income ranges: 6.5% for AGIs below $10k, 2.7% for AGIs $10k-25k, 1.7% for AGIs $25k-50k, 1.1% for AGIs $50k-75k, 2.3% for AGIs $75k-100k, 1.5% for AGIs over 100k)
Taxable dividends: $1,874 (reported on 11.7% of returns)
Here:
$1,874
State:
$3,496
(% of AGI for various income ranges: 0.8% for AGIs below $10k, 0.8% for AGIs $10k-25k, 0.8% for AGIs $25k-50k, 0.3% for AGIs $50k-75k, 1.0% for AGIs $75k-100k, 0.6% for AGIs over 100k)
Net capital gain/loss: +$11,748 (reported on 9.7% of returns)
Here:
+$11,748
State:
+$8,582
(% of AGI for various income ranges: -1.2% for AGIs below $10k, 0.4% for AGIs $10k-25k, 1.1% for AGIs $25k-50k, 0.3% for AGIs $50k-75k, 25.6% for AGIs $75k-100k)
Profit/loss from business: +$8,124 (reported on 17.1% of returns)
Here:
+$8,124
State:
+$10,813
(% of AGI for various income ranges: 26.5% for AGIs below $10k, 6.8% for AGIs $10k-25k, 3.9% for AGIs $25k-50k, 5.4% for AGIs $50k-75k, 1.7% for AGIs $75k-100k)
IRA payment deduction: $2,550 (reported on 1.6% of returns)
45679:
$2,550
Ohio:
$2,794
Total itemized deductions: $14,878 (25% of AGI, reported on 19.5% of returns)
Here:
$14,878
State:
$17,503
Here:
24.9% of AGI
State:
20.8% of AGI
(% of AGI for various income ranges: 4.6% for AGIs $10k-25k, 9.2% for AGIs $25k-50k, 10.5% for AGIs $50k-75k, 12.5% for AGIs $75k-100k, 12.9% for AGIs over 100k)
Charity contributions deductions: $2,858 (4% of AGI, reported on 12.1% of returns)
Here:
$2,858
State:
$3,087
Here:
4.5% of AGI
State:
3.4% of AGI
(% of AGI for various income ranges: 0.2% for AGIs $10k-25k, 1.1% for AGIs $25k-50k, 1.4% for AGIs $50k-75k, 1.7% for AGIs $75k-100k, 1.5% for AGIs over 100k)
Total tax: $3,379 (reported on 71.6% of returns)
45679:
$3,379
State:
$6,781
(% of AGI for various income ranges: 5.8% for AGIs below $10k, 4.3% for AGIs $10k-25k, 6.1% for AGIs $25k-50k, 8.2% for AGIs $50k-75k, 10.5% for AGIs $75k-100k, 15.1% for AGIs over 100k)
Earned income credit: $1,575 (reported on 22.9% of returns)
Here:
$1,575
State:
$1,696
Percentage of individuals using paid preparers for their 2004 taxes: 72.6%
Here:
73%
State:
55%
(% for various income ranges: 64.9% for AGIs below $10k, 73.1% for AGIs $10k-25k, 76.9% for AGIs $25k-50k, 73.5% for AGIs $50k-75k, 76.4% for AGIs $75k-100k, 70.8% for AGIs over 100k)
Household received Food Stamps/SNAP in the past 12 months: 210 Household did not receive Food Stamps/SNAP in the past 12 months: 980
Women who had a birth in the past 12 months: 20 (10 now married, 10 unmarried) Women who did not have a birth in the past 12 months: 618 (340 now married, 277 unmarried)
Housing units in zip code 45679 with a mortgage: 378 (31 second mortgage, 31 both second mortgage and home equity loan) Houses without a mortgage: 21
Median monthly owner costs for units with a mortgage: $1,050 Median monthly owner costs for units without a mortgage: $461
Residents with income below the poverty level in 2022:
This zip code:
21.2%
Whole state:
13.4%
Residents with income below 50% of the poverty level in 2022:
This zip code:
12.1%
Whole state:
7.0%
Median number of rooms in houses and condos:
Here:
6.1
State:
6.7
Median number of rooms in apartments:
Here:
5.5
State:
4.4
Notable locations in this zip code not listed on our city pages
Cemeteries: Fenner Cemetery (1), Tranquility Cemetery (2), Mount Calvary Cemetery (3), Horner Cemetery (4), Mount Leigh Cemetery (5), Mount Zion Cemetery (6), Oakland Cemetery (7). Display/hide their locations on the map
Streams, rivers, and creeks: Martins Run (A), Gregg Run (B), Cherry Fork (C), Buck Run (D), Big Run (E), Grace Run (F), Georges Creek (G), Elk Fork (H), West Fork Ohio Brush Creek (I). Display/hide their locations on the map
In group quarters: 30 (-1 institutionalized population)
Size of family households: 387 2-persons, 227 3-persons, 157 4-persons, 108 5-persons
Size of nonfamily households: 275 1-person, 26 2-persons
432 married couples with children.
237 single-parent households (7 men, 230 women).
99.6% of residents of 45679 zip code speak English at home.
Foreign born population: 0 (0.0%)
:
0.0%
Whole state:
5.0%
23%English
17%American
12%German
6%Scottish
5%Irish
5%French
2%Dutch
Housing units lacking complete plumbing facilities: 5.9% Housing units lacking complete kitchen facilities: 1.2%
64.9%Electricity
14.2%Bottled, tank, or LP gas
11.7%Wood
5.4%Fuel oil, kerosene, etc.
3.0%Utility gas
0.8%Other fuel
Population in 1990: 3,482.
Place of birth for U.S.-born residents:
This state: 2,677
Northeast: 24
Midwest: 63
South: 297
West: 23
66% of the 45679 zip code residents lived in the same house 5 years ago. Out of people who lived in different houses, 60% lived in this county. Out of people who lived in different counties, 50% lived in Ohio.
96% of the 45679 zip code residents lived in the same house 1 year ago. Out of people who lived in different houses, 47% moved from this county. Out of people who lived in different houses, 46% moved from different county within same state. Out of people who lived in different houses, 2% moved from different state. Out of people who lived in different houses, 22% moved from abroad.
Private vs. public school enrollment:
Students in private schools in grades 1 to 8 (elementary and middle school): 3
Here:
1.3%
Ohio:
16.0%
Students in private schools in grades 9 to 12 (high school): 10
Here:
15.5%
Ohio:
13.1%
Students in private undergraduate colleges:
Here:
0.0%
Ohio:
22.3%
Occupation by median earnings in the past 12 months ($)
81,688Health diagnosing and treating practitioners and other technical occupations
77,851Education, training, and library occupations
74,174Installation, maintenance, and repair occupations
65,583Health technologists and technicians
50,561Construction and extraction occupations
48,441Production occupations
Companies with federal contracts located in this zip code:
M & L MACHINE (17400 STATE ROUTE 247 in SEAMAN, OH; small business)
$8,519 with Defense Logistics Agency for Airframe Structural Components. Signed on 2005-04-08. Completion date: 2005-05-27.
Top industries in this zip code by the number of employees in 2005:
Health Care and Social Assistance: All Other Outpatient Care Centers (20-49 employees: 1 establishment, 10-19 employees: 1 establishment)
Accommodation and Food Services: Limited-Service Restaurants (10-19: 2, 5-9: 1)
Wholesale Trade: Farm and Garden Machinery and Equipment Merchant Wholesalers (20-49: 1)
Utilities: Fossil Fuel Electric Power Generation (10-19: 1)
Administrative and Support and Waste Management and Remediation Services: Janitorial Services (5-9: 1, 1-4: 1)
People in group quarters in 2010:
8 people in group homes intended for adults
People in group quarters in 2000:
9 people in other noninstitutional group quarters
Fatal accident statistics in 2012:
Fatal accident count: 3
Vehicles involved in fatal accidents: 3
Fatal accidents caused by drunken drivers: 0
Fatalities: 3
Persons involved in fatal accidents: 4
Pedestrians involved in fatal accidents: 0
Fatal accident statistics in 2011:
Fatal accident count: 1
Vehicles involved in fatal accidents: 1
Fatal accidents caused by drunken drivers: 0
Fatalities: 1
Persons involved in fatal accidents: 1
Pedestrians involved in fatal accidents: 0
2002 - 2018 National Fire Incident Reporting System (NFIRS) incidents
Based on the data from the years 2002 - 2018 the average number of fires per year is 36. The highest number of reported fire incidents - 64 took place in 2010, and the least - 9 in 2016. The data has a rising trend.
When looking into fire subcategories, the most reports belonged to: Structure Fires (59.0%), and Outside Fires (28.4%).
Fire incident types reported to NFIRS in Zip Code 45679
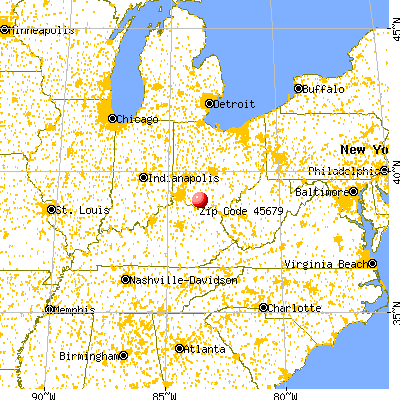


 Nearest zip codes: 45618, 45697, 45693, 45660, 45133, 45115.


 Based on the data from the years 2002 - 2018 the average number of fires per year is 36. The highest number of reported fire incidents - 64 took place in 2010, and the least - 9 in 2016. The data has a rising trend.
 When looking into fire subcategories, the most reports belonged to: Structure Fires (59.0%), and Outside Fires (28.4%).