Estimated median house/condo value in 2022: $168,580
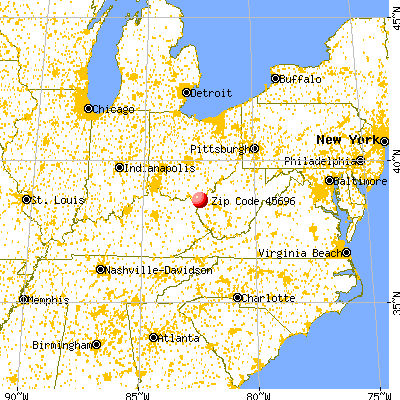
45696:
$168,580
Ohio:
$204,100
According to our research of Ohio and other state lists, there were 3 registered sex offenders living in 45696 zip code as of June 15, 2024. The ratio of all residents to sex offenders in zip code 45696 is 473 to 1. The ratio of registered sex offenders to all residents in this zip code is near the state average.
Median resident age:
This zip code:
49.8 years
Ohio median age:
39.9 years
Average household size:
This zip code:
1.6 people
Ohio:
2.4 people
Averages for the 2020 tax year for zip code 45696, filed in 2021:
Average Adjusted Gross Income (AGI) in 2020: $55,587 (Individual Income Tax Returns)
Here:
$55,587
State:
$67,288
Salary/wage: $50,922 (reported on 86.8% of returns)
Here:
$50,922
State:
$55,628
(% of AGI for various income ranges: 1336.9% for AGIs below $25k, 3329.2% for AGIs $25k-50k, 5900.0% for AGIs $50k-75k, 9647.5% for AGIs $75k-100k, 16170.0% for AGIs $100k-200k)
Taxable interest for individuals: $530 (reported on 18.9% of returns)
This zip code:
$530
Ohio:
$1,518
(% of AGI for various income ranges: 35.8% for AGIs $25k-50k, 7.1% for AGIs $50k-75k, 8.3% for AGIs $100k-200k)
Ordinary dividends: $875 (reported on 7.5% of returns)
Here:
$875
State:
$7,167
(% of AGI for various income ranges: 50.0% for AGIs $50k-75k)
Net capital gain/loss in AGI: +$2,067 (reported on 5.7% of returns)
Here:
+$2,067
State:
+$18,919
(% of AGI for various income ranges: 51.7% for AGIs $25k-50k)
Profit/loss from business: +$7,500 (reported on 9.4% of returns)
Here:
+$7,500
State:
+$13,744
(% of AGI for various income ranges: 106.2% for AGIs below $25k, 592.5% for AGIs $75k-100k)
Taxable individual retirement arrangement distribution: $7,950 (reported on 3.8% of returns)
45696:
$7,950
Ohio:
$18,876
(% of AGI for various income ranges: 122.3% for AGIs below $25k)
Earned income credit: $2,430 (reported on 18.9% of returns)
Here:
$2,430
State:
$2,304
(% of AGI for various income ranges: 107.7% for AGIs below $25k, 85.8% for AGIs $25k-50k)
Percentage of individuals using paid preparers for their 2020 taxes: 94.3%
Here:
94%
State:
94%
(% for various income ranges: 93.8% for AGIs below $25k, 93.3% for AGIs $25k-50k, 88.9% for AGIs $50k-75k, 100.0% for AGIs $75k-100k, 100.0% for AGIs $100k-200k)
Averages for the 2012 tax year for zip code 45696, filed in 2013:
Average Adjusted Gross Income (AGI) in 2012: $41,320 (Individual Income Tax Returns)
Here:
$41,320
State:
$54,926
Salary/wage: $40,298 (reported on 87.0% of returns)
Here:
$40,298
State:
$45,869
(% of AGI for various income ranges: 75.5% for AGIs below $25k, 86.7% for AGIs $25k-50k, 83.1% for AGIs $50k-75k, 90.5% for AGIs $75k-100k, 85.3% for AGIs $100k-200k)
Taxable interest for individuals: $173 (reported on 20.4% of returns)
This zip code:
$173
Ohio:
$1,297
(% of AGI for various income ranges: 0.3% for AGIs below $25k, 0.1% for AGIs $25k-50k, 0.1% for AGIs $75k-100k)
Ordinary dividends: $400 (reported on 7.4% of returns)
Here:
$400
State:
$5,821
(% of AGI for various income ranges: 0.3% for AGIs $50k-75k)
Net capital gain/loss in AGI: +$733 (reported on 5.6% of returns)
Here:
+$733
State:
+$11,232
(% of AGI for various income ranges: 0.4% for AGIs $25k-50k)
Profit/loss from business: +$5,017 (reported on 11.1% of returns)
Here:
+$5,017
State:
+$12,773
(% of AGI for various income ranges: 7.7% for AGIs below $25k, 1.4% for AGIs $25k-50k)
Total itemized deductions: $18,188 (22% of AGI, reported on 14.8% of returns)
Here:
$18,188
State:
$21,278
Here:
22.3% of AGI
State:
18.8% of AGI
(% of AGI for various income ranges: 18.0% for AGIs $50k-75k, 11.8% for AGIs $100k-200k)
Charity contributions: $3,020 (reported on 9.3% of returns)
Here:
$3,020
State:
$3,943
(% of AGI for various income ranges: 0.9% for AGIs $50k-75k, 2.2% for AGIs $100k-200k)
Taxes paid: $4,375 (reported on 14.8% of returns)
45696:
$4,375
State:
$9,568
(% of AGI for various income ranges: 3.6% for AGIs $50k-75k, 3.6% for AGIs $100k-200k)
Earned income credit: $2,275 (reported on 22.2% of returns)
Here:
$2,275
State:
$2,285
(% of AGI for various income ranges: 7.3% for AGIs below $25k, 1.1% for AGIs $25k-50k)
Percentage of individuals using paid preparers for their 2012 taxes: 53.7%
Here:
54%
State:
51%
(% for various income ranges: 47.8% for AGIs below $25k, 50.0% for AGIs $25k-50k, 75.0% for AGIs $50k-75k, 60.0% for AGIs $75k-100k, 50.0% for AGIs $100k-200k)
Averages for the 2004 tax year for zip code 45696, filed in 2005:
Average Adjusted Gross Income (AGI) in 2004: $29,586 (Individual Income Tax Returns)
Here:
$29,586
State:
$44,480
Salary/wage: $30,439 (reported on 85.7% of returns)
Here:
$30,439
State:
$39,198
(% of AGI for various income ranges: 117.7% for AGIs below $10k, 80.8% for AGIs $10k-25k, 91.4% for AGIs $25k-50k, 98.2% for AGIs $50k-75k, 132.1% for AGIs $75k-100k)
Taxable interest for individuals: $697 (reported on 32.3% of returns)
This zip code:
$697
Ohio:
$1,532
(% of AGI for various income ranges: 7.6% for AGIs below $10k, 2.0% for AGIs $10k-25k, 0.3% for AGIs $25k-50k, 0.1% for AGIs $50k-75k, 0.3% for AGIs $75k-100k)
Taxable dividends: $396 (reported on 8.7% of returns)
Here:
$396
State:
$3,496
Profit/loss from business: +$1,912 (reported on 16.5% of returns)
Here:
+$1,912
State:
+$10,813
(% of AGI for various income ranges: 7.8% for AGIs below $10k, 4.4% for AGIs $10k-25k, 0.2% for AGIs $25k-50k, -0.4% for AGIs $50k-75k)
Total itemized deductions: $14,102 (22% of AGI, reported on 16.0% of returns)
Here:
$14,102
State:
$17,503
Here:
21.9% of AGI
State:
20.8% of AGI
(% of AGI for various income ranges: 7.8% for AGIs $25k-50k, 10.9% for AGIs $50k-75k, 11.1% for AGIs $75k-100k, 12.5% for AGIs over 100k)
Charity contributions deductions: $2,453 (4% of AGI, reported on 11.6% of returns)
Here:
$2,453
State:
$3,087
Here:
3.7% of AGI
State:
3.4% of AGI
Total tax: $3,304 (reported on 68.1% of returns)
45696:
$3,304
State:
$6,781
(% of AGI for various income ranges: 3.4% for AGIs below $10k, 3.3% for AGIs $10k-25k, 6.4% for AGIs $25k-50k, 7.5% for AGIs $50k-75k, 9.8% for AGIs $75k-100k, 18.8% for AGIs over 100k)
Earned income credit: $2,135 (reported on 24.1% of returns)
Here:
$2,135
State:
$1,696
Percentage of individuals using paid preparers for their 2004 taxes: 68.4%
Here:
68%
State:
55%
(% for various income ranges: 63.5% for AGIs below $10k, 67.7% for AGIs $10k-25k, 73.3% for AGIs $25k-50k, 72.4% for AGIs $50k-75k, 88.5% for AGIs $75k-100k)
Household received Food Stamps/SNAP in the past 12 months: 76 Household did not receive Food Stamps/SNAP in the past 12 months: 252
Women who had a birth in the past 12 months: 13 (14 now married, 0 unmarried) Women who did not have a birth in the past 12 months: 66 (13 now married, 52 unmarried)
Housing units in zip code 45696 with a mortgage: 78 (11 second mortgage, 11 both second mortgage and home equity loan) Median monthly owner costs for units with a mortgage: $1,268 Median monthly owner costs for units without a mortgage: $650
Residents with income below the poverty level in 2022:
This zip code:
16.6%
Whole state:
13.4%
Residents with income below 50% of the poverty level in 2022:
This zip code:
11.7%
Whole state:
7.0%
Median number of rooms in houses and condos:
Here:
6.3
State:
6.7
Median number of rooms in apartments:
Here:
4.8
State:
4.4
Notable locations in this zip code not listed on our city pages
Notable locations in zip code 45696: Southeast Ohio Emergency Medical Services Station 15 Willow Wood (A), Windsor Township Volunteer Fire Department (B), Aid Township Volunteer Fire Department (C). Display/hide their locations on the map
Churches in zip code 45696 include: Mount Pleasant Church (A), Locust Grove Church (B), Ridge Church (C), Symmes Creek Church (D), Fairview Church (E). Display/hide their locations on the map
Cemeteries: Rucker Cemetery (1), Murnaham Cemetery (2), Bradshaw Cemetery (3), Fairview Baptist Cemetery (4), Locust Grove Methodist Episcopal Cemetery (5), New Zion Cemetery (6), Old Baptist Cemetery (7). Display/hide their locations on the map
Streams, rivers, and creeks: Dicks Creek (A), Buck Creek (B), Brushy Branch (C), Venisonham Creek (D), Yellow Creek (E), Buckeye Creek (F), Long Creek (G). Display/hide their locations on the map
Facilities with environmental interests located in this zip code:
ALLTEL - BUCKHORN (1005 COUNTY RD. 193 in WILLOW WOOD, OH)
(Integrated Compliance Information System) - ICIS-HQ-2000-6004, FORMAL ENFORCEMENT ACTION
Housing units lacking complete plumbing facilities: 9.2%
65.9%Bottled, tank, or LP gas
17.5%Electricity
8.1%Utility gas
4.7%Coal or coke
4.4%Wood
Population in 1990: 665. Population change in the 1990s: +701 (+105.4%).
Place of birth for U.S.-born residents:
This state: 225
Midwest: 11
South: 291
64% of the 45696 zip code residents lived in the same house 5 years ago. Out of people who lived in different houses, 69% lived in this county. Out of people who lived in different counties, 50% lived in Ohio.
91% of the 45696 zip code residents lived in the same house 1 year ago. Out of people who lived in different houses, 92% moved from this county.
Private vs. public school enrollment:
Students in private schools in grades 1 to 8 (elementary and middle school):
Here:
0.0%
Ohio:
16.0%
Top industries in this zip code by the number of employees in 2005:
Construction: New Single-Family Housing Construction (except Operative Builders) (1-4 employees: 1 establishment)
Construction: Residential Remodelers (1-4: 1)
Arts, Entertainment, and Recreation: All Other Amusement and Recreation Industries (1-4: 1)
Accommodation and Food Services: Snack and Nonalcoholic Beverage Bars (1-4: 1)
Health Care and Social Assistance: Child Day Care Services (1-4: 1)
Home Mortgage Disclosure Act Aggregated Statistics For Year 2009 (Based on 2 partial tracts)
A) FHA, FSA/RHS & VA Home Purchase Loans
B) Conventional Home Purchase Loans
C) Refinancings
D) Home Improvement Loans
F) Non-occupant Loans on < 5 Family Dwellings (A B C & D)
G) Loans On Manufactured Home Dwelling (A B C & D)
Number
Average Value
Number
Average Value
Number
Average Value
Number
Average Value
Number
Average Value
Number
Average Value
LOANS ORIGINATED
3
$112,893
7
$62,216
41
$126,811
7
$33,706
3
$45,763
3
$29,853
APPLICATIONS APPROVED, NOT ACCEPTED
0
$0
0
$0
5
$161,202
0
$0
0
$0
0
$0
APPLICATIONS DENIED
1
$43,190
1
$72,740
22
$100,529
10
$34,050
0
$0
2
$58,415
APPLICATIONS WITHDRAWN
0
$0
1
$86,370
7
$132,873
0
$0
0
$0
1
$131,380
FILES CLOSED FOR INCOMPLETENESS
0
$0
0
$0
2
$89,785
0
$0
0
$0
0
$0
Aggregated Statistics For Year 2008 (Based on 2 partial tracts)
A) FHA, FSA/RHS & VA Home Purchase Loans
B) Conventional Home Purchase Loans
C) Refinancings
D) Home Improvement Loans
F) Non-occupant Loans on < 5 Family Dwellings (A B C & D)
G) Loans On Manufactured Home Dwelling (A B C & D)
Number
Average Value
Number
Average Value
Number
Average Value
Number
Average Value
Number
Average Value
Number
Average Value
LOANS ORIGINATED
7
$133,847
13
$105,188
24
$96,280
12
$40,308
4
$75,918
7
$61,696
APPLICATIONS APPROVED, NOT ACCEPTED
0
$0
0
$0
3
$85,617
2
$50,235
0
$0
0
$0
APPLICATIONS DENIED
2
$92,285
4
$76,940
30
$92,102
11
$60,957
0
$0
3
$52,280
APPLICATIONS WITHDRAWN
2
$112,970
1
$73,190
3
$142,137
1
$59,550
0
$0
1
$69,550
FILES CLOSED FOR INCOMPLETENESS
0
$0
0
$0
0
$0
1
$121,380
0
$0
0
$0
Aggregated Statistics For Year 2007 (Based on 2 partial tracts)
A) FHA, FSA/RHS & VA Home Purchase Loans
B) Conventional Home Purchase Loans
C) Refinancings
D) Home Improvement Loans
F) Non-occupant Loans on < 5 Family Dwellings (A B C & D)
G) Loans On Manufactured Home Dwelling (A B C & D)
Number
Average Value
Number
Average Value
Number
Average Value
Number
Average Value
Number
Average Value
Number
Average Value
LOANS ORIGINATED
4
$80,122
23
$93,806
42
$86,471
14
$25,815
2
$62,960
10
$70,372
APPLICATIONS APPROVED, NOT ACCEPTED
0
$0
2
$61,825
11
$84,804
1
$70,460
0
$0
1
$76,370
APPLICATIONS DENIED
0
$0
16
$79,441
32
$92,781
17
$40,834
1
$41,820
10
$61,462
APPLICATIONS WITHDRAWN
0
$0
2
$117,515
10
$104,876
2
$43,870
0
$0
0
$0
FILES CLOSED FOR INCOMPLETENESS
0
$0
0
$0
1
$129,560
0
$0
0
$0
0
$0
Aggregated Statistics For Year 2006 (Based on 2 partial tracts)
A) FHA, FSA/RHS & VA Home Purchase Loans
B) Conventional Home Purchase Loans
C) Refinancings
D) Home Improvement Loans
F) Non-occupant Loans on < 5 Family Dwellings (A B C & D)
G) Loans On Manufactured Home Dwelling (A B C & D)
Number
Average Value
Number
Average Value
Number
Average Value
Number
Average Value
Number
Average Value
Number
Average Value
LOANS ORIGINATED
4
$85,465
25
$98,212
36
$93,723
17
$37,197
2
$127,060
9
$59,048
APPLICATIONS APPROVED, NOT ACCEPTED
0
$0
8
$68,872
8
$82,738
1
$39,550
1
$63,640
5
$46,096
APPLICATIONS DENIED
2
$84,330
17
$81,026
45
$83,737
9
$32,529
1
$93,650
17
$59,285
APPLICATIONS WITHDRAWN
1
$139,110
4
$130,470
15
$79,070
2
$82,055
0
$0
2
$84,100
FILES CLOSED FOR INCOMPLETENESS
0
$0
1
$172,750
6
$95,467
0
$0
0
$0
0
$0
Aggregated Statistics For Year 2005 (Based on 2 partial tracts)
A) FHA, FSA/RHS & VA Home Purchase Loans
B) Conventional Home Purchase Loans
C) Refinancings
D) Home Improvement Loans
F) Non-occupant Loans on < 5 Family Dwellings (A B C & D)
G) Loans On Manufactured Home Dwelling (A B C & D)
Number
Average Value
Number
Average Value
Number
Average Value
Number
Average Value
Number
Average Value
Number
Average Value
LOANS ORIGINATED
4
$91,375
30
$79,388
38
$81,744
11
$43,187
6
$68,115
11
$49,427
APPLICATIONS APPROVED, NOT ACCEPTED
1
$89,560
8
$53,018
9
$65,816
4
$52,848
0
$0
7
$46,174
APPLICATIONS DENIED
0
$0
16
$69,582
75
$92,023
16
$39,948
2
$67,055
20
$59,076
APPLICATIONS WITHDRAWN
1
$109,560
4
$120,810
26
$109,227
4
$93,875
0
$0
2
$93,195
FILES CLOSED FOR INCOMPLETENESS
0
$0
1
$131,830
3
$51,977
1
$62,730
0
$0
0
$0
Aggregated Statistics For Year 2004 (Based on 2 partial tracts)
A) FHA, FSA/RHS & VA Home Purchase Loans
B) Conventional Home Purchase Loans
C) Refinancings
D) Home Improvement Loans
F) Non-occupant Loans on < 5 Family Dwellings (A B C & D)
G) Loans On Manufactured Home Dwelling (A B C & D)
Number
Average Value
Number
Average Value
Number
Average Value
Number
Average Value
Number
Average Value
Number
Average Value
LOANS ORIGINATED
1
$120,920
24
$72,585
43
$77,367
13
$33,955
3
$18,640
8
$44,096
APPLICATIONS APPROVED, NOT ACCEPTED
0
$0
6
$52,430
13
$61,965
2
$27,730
0
$0
6
$37,505
APPLICATIONS DENIED
1
$45,910
21
$54,011
53
$67,289
16
$35,231
2
$55,690
21
$44,897
APPLICATIONS WITHDRAWN
1
$72,280
4
$80,350
25
$85,246
4
$31,935
0
$0
1
$100,010
FILES CLOSED FOR INCOMPLETENESS
0
$0
1
$76,830
5
$81,828
0
$0
0
$0
0
$0
Aggregated Statistics For Year 2003 (Based on 2 partial tracts)
A) FHA, FSA/RHS & VA Home Purchase Loans
B) Conventional Home Purchase Loans
C) Refinancings
D) Home Improvement Loans
F) Non-occupant Loans on < 5 Family Dwellings (A B C & D)
Number
Average Value
Number
Average Value
Number
Average Value
Number
Average Value
Number
Average Value
LOANS ORIGINATED
1
$52,730
27
$63,173
77
$78,150
14
$20,846
2
$27,050
APPLICATIONS APPROVED, NOT ACCEPTED
1
$42,730
13
$50,950
18
$89,026
4
$19,775
0
$0
APPLICATIONS DENIED
5
$44,096
39
$45,087
60
$71,902
9
$23,841
3
$27,427
APPLICATIONS WITHDRAWN
0
$0
4
$61,258
22
$73,542
1
$21,820
0
$0
FILES CLOSED FOR INCOMPLETENESS
0
$0
0
$0
6
$114,028
1
$30,460
0
$0
Aggregated Statistics For Year 2002 (Based on 2 partial tracts)
A) FHA, FSA/RHS & VA Home Purchase Loans
B) Conventional Home Purchase Loans
C) Refinancings
D) Home Improvement Loans
F) Non-occupant Loans on < 5 Family Dwellings (A B C & D)
Number
Average Value
Number
Average Value
Number
Average Value
Number
Average Value
Number
Average Value
LOANS ORIGINATED
3
$65,917
26
$48,485
48
$73,503
14
$17,567
2
$26,140
APPLICATIONS APPROVED, NOT ACCEPTED
1
$84,560
20
$44,256
15
$73,675
3
$19,243
0
$0
APPLICATIONS DENIED
5
$49,824
52
$41,491
47
$68,973
9
$15,356
0
$0
APPLICATIONS WITHDRAWN
0
$0
3
$73,190
19
$66,419
1
$14,550
0
$0
FILES CLOSED FOR INCOMPLETENESS
0
$0
1
$30,000
6
$102,967
1
$117,740
1
$67,280
Aggregated Statistics For Year 2001 (Based on 2 partial tracts)
A) FHA, FSA/RHS & VA Home Purchase Loans
B) Conventional Home Purchase Loans
C) Refinancings
D) Home Improvement Loans
F) Non-occupant Loans on < 5 Family Dwellings (A B C & D)
Number
Average Value
Number
Average Value
Number
Average Value
Number
Average Value
Number
Average Value
LOANS ORIGINATED
3
$66,827
20
$60,143
46
$71,649
27
$19,430
4
$37,732
APPLICATIONS APPROVED, NOT ACCEPTED
1
$58,640
10
$36,595
13
$75,813
3
$15,760
1
$60,460
APPLICATIONS DENIED
1
$40,000
24
$37,751
35
$76,087
13
$10,911
0
$0
APPLICATIONS WITHDRAWN
0
$0
2
$53,870
21
$68,169
5
$11,366
0
$0
FILES CLOSED FOR INCOMPLETENESS
0
$0
0
$0
3
$80,920
0
$0
0
$0
Aggregated Statistics For Year 2000 (Based on 2 partial tracts)
A) FHA, FSA/RHS & VA Home Purchase Loans
B) Conventional Home Purchase Loans
C) Refinancings
D) Home Improvement Loans
F) Non-occupant Loans on < 5 Family Dwellings (A B C & D)
Number
Average Value
Number
Average Value
Number
Average Value
Number
Average Value
Number
Average Value
LOANS ORIGINATED
4
$61,712
26
$56,580
27
$63,897
9
$22,174
2
$46,595
APPLICATIONS APPROVED, NOT ACCEPTED
1
$50,010
17
$42,706
11
$63,314
2
$19,320
1
$40,000
APPLICATIONS DENIED
1
$41,370
33
$37,994
39
$58,142
14
$16,204
1
$19,550
APPLICATIONS WITHDRAWN
0
$0
5
$56,098
24
$54,798
1
$39,100
0
$0
FILES CLOSED FOR INCOMPLETENESS
0
$0
0
$0
3
$66,977
0
$0
0
$0
Aggregated Statistics For Year 1999 (Based on 1 partial tract)
B) Conventional Home Purchase Loans
C) Refinancings
D) Home Improvement Loans
F) Non-occupant Loans on < 5 Family Dwellings (A B C & D)
Detailed PMIC statistics for the following Tracts:0505.00
2003 - 2018 National Fire Incident Reporting System (NFIRS) incidents
Based on the data from the years 2003 - 2018 the average number of fires per year is 15. The highest number of fire incidents - 36 took place in 2009, and the least - 3 in 2018. The data has a dropping trend.
When looking into fire subcategories, the most reports belonged to: Outside Fires (43.0%), and Structure Fires (38.3%).
Fire incident types reported to NFIRS in Zip Code 45696


 Nearest zip codes: 45678, 45645, 45619, 45669, 45688, 45680.


 (Students: 267, Location: 14778 STATE ROUTE 141, Grades: 9-12)


 Based on the data from the years 2003 - 2018 the average number of fires per year is 15. The highest number of fire incidents - 36 took place in 2009, and the least - 3 in 2018. The data has a dropping trend.
 When looking into fire subcategories, the most reports belonged to: Outside Fires (43.0%), and Structure Fires (38.3%).