Estimated zip code population in 2022: 2,107 Zip code population in 2010: 1,289 Zip code population in 2000: 1,410
March 2022 cost of living index in zip code 45729: 80.6 (low, U.S. average is 100)
Land area: 25.6 sq. mi. Water area: 0.0 sq. mi.
Population density: 82 people per square mile
(very low).
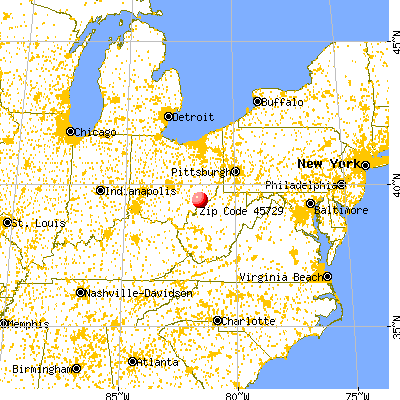
OSM Map
General Map
Google Map
MSN Map
OSM Map
General Map
Google Map
MSN Map
OSM Map
General Map
Google Map
MSN Map
OSM Map
General Map
Google Map
MSN Map
Please wait while loading the map...
Real estate property taxes paid for housing units in 2022:
This zip code:
0.9% ($2,100)
Ohio:
1.3% ($2,639)
Median real estate property taxes paid for housing units with mortgages in 2022: $2,316 (0.9%) Median real estate property taxes paid for housing units with no mortgage in 2022: $1,435 (0.9%)
Business Search- 14 Million verified businesses
Males: 958
(45.5%)
Females: 1,149
(54.5%)
For population 25 years and over in 45729:
High school or higher: 95.9%
Bachelor's degree or higher: 15.0%
Graduate or professional degree: 6.4%
Unemployed: 8.2%
Mean travel time to work (commute): 28.1 minutes
For population 15 years and over in 45729:
Never married: 24.3%
Now married: 47.6%
Separated: 7.5%
Widowed: 6.7%
Divorced: 14.0%
Zip code 45729 compared to state average:
Unemployed percentage above state average.
Black race population percentage significantly below state average.
Hispanic race population percentage significantly below state average.
Foreign-born population percentage significantly below state average.
Renting percentage significantly below state average.
Length of stay since moving in above state average.
Number of rooms per house above state average.
House age below state average.
Percentage of population with a bachelor's degree or higher significantly below state average.
Estimated median house/condo value in 2022: $223,697
45729:
$223,697
Ohio:
$204,100
According to our research of Ohio and other state lists, there was 1 registered sex offender living in 45729 zip code as of June 16, 2024. The ratio of all residents to sex offenders in zip code 45729 is 1,534 to 1. The ratio of registered sex offenders to all residents in this zip code is much lower than the state average.
Median resident age:
This zip code:
37.2 years
Ohio median age:
39.9 years
Average household size:
This zip code:
2.9 people
Ohio:
2.4 people
Averages for the 2020 tax year for zip code 45729, filed in 2021:
Average Adjusted Gross Income (AGI) in 2020: $66,779 (Individual Income Tax Returns)
Here:
$66,779
State:
$67,288
Salary/wage: $60,337 (reported on 81.9% of returns)
Here:
$60,337
State:
$55,628
(% of AGI for various income ranges: 1109.4% for AGIs below $25k, 3259.2% for AGIs $25k-50k, 5670.0% for AGIs $50k-75k, 10180.0% for AGIs $75k-100k, 13556.7% for AGIs $100k-200k)
Taxable interest for individuals: $559 (reported on 37.5% of returns)
This zip code:
$559
Ohio:
$1,518
(% of AGI for various income ranges: 13.1% for AGIs below $25k, 20.8% for AGIs $25k-50k, 31.1% for AGIs $50k-75k, 16.7% for AGIs $75k-100k, 72.2% for AGIs $100k-200k)
Ordinary dividends: $3,450 (reported on 16.7% of returns)
Here:
$3,450
State:
$7,167
(% of AGI for various income ranges: 36.2% for AGIs below $25k, 83.3% for AGIs $50k-75k, 312.2% for AGIs $100k-200k)
Net capital gain/loss in AGI: +$9,182 (reported on 15.3% of returns)
Here:
+$9,182
State:
+$18,919
(% of AGI for various income ranges: 39.4% for AGIs below $25k, 115.6% for AGIs $50k-75k, 936.7% for AGIs $100k-200k)
Profit/loss from business: +$9,000 (reported on 15.3% of returns)
Here:
+$9,000
State:
+$13,744
(% of AGI for various income ranges: 77.5% for AGIs below $25k, 376.7% for AGIs $50k-75k, 585.6% for AGIs $100k-200k)
Taxable individual retirement arrangement distribution: $15,838 (reported on 11.1% of returns)
45729:
$15,838
Ohio:
$18,876
(% of AGI for various income ranges: 440.0% for AGIs $25k-50k, 1158.3% for AGIs $75k-100k)
Earned income credit: $2,400 (reported on 9.7% of returns)
Here:
$2,400
State:
$2,304
(% of AGI for various income ranges: 72.5% for AGIs below $25k, 40.0% for AGIs $25k-50k)
Percentage of individuals using paid preparers for their 2020 taxes: 94.4%
Here:
94%
State:
94%
(% for various income ranges: 95.2% for AGIs below $25k, 93.8% for AGIs $25k-50k, 91.7% for AGIs $50k-75k, 100.0% for AGIs $75k-100k, 91.7% for AGIs $100k-200k, 100.0% for AGIs over 200k)
Averages for the 2012 tax year for zip code 45729, filed in 2013:
Average Adjusted Gross Income (AGI) in 2012: $53,117 (Individual Income Tax Returns)
Here:
$53,117
State:
$54,926
Salary/wage: $46,471 (reported on 81.9% of returns)
Here:
$46,471
State:
$45,869
(% of AGI for various income ranges: 71.2% for AGIs below $25k, 69.1% for AGIs $25k-50k, 78.3% for AGIs $50k-75k, 78.7% for AGIs $75k-100k, 66.6% for AGIs $100k-200k)
Taxable interest for individuals: $743 (reported on 31.9% of returns)
This zip code:
$743
Ohio:
$1,297
(% of AGI for various income ranges: 0.9% for AGIs below $25k, 0.9% for AGIs $25k-50k, 0.5% for AGIs $50k-75k, 0.4% for AGIs $75k-100k, 0.1% for AGIs $100k-200k)
Ordinary dividends: $1,815 (reported on 18.1% of returns)
Here:
$1,815
State:
$5,821
(% of AGI for various income ranges: 1.8% for AGIs below $25k, 1.8% for AGIs $50k-75k, 0.3% for AGIs $100k-200k)
Net capital gain/loss in AGI: +$22,325 (reported on 11.1% of returns)
Here:
+$22,325
State:
+$11,232
(% of AGI for various income ranges: 0.2% for AGIs $50k-75k, 26.4% for AGIs $75k-100k)
Profit/loss from business: +$11,364 (reported on 15.3% of returns)
Here:
+$11,364
State:
+$12,773
(% of AGI for various income ranges: 4.5% for AGIs below $25k, 6.8% for AGIs $25k-50k, 3.3% for AGIs $50k-75k, 3.0% for AGIs $100k-200k)
Taxable individual retirement arrangement distribution: $9,557 (reported on 9.7% of returns)
45729:
$9,557
Ohio:
$14,511
(% of AGI for various income ranges: 4.8% for AGIs $25k-50k, 5.1% for AGIs $50k-75k)
Total itemized deductions: $20,814 (19% of AGI, reported on 19.4% of returns)
Here:
$20,814
State:
$21,278
Here:
18.7% of AGI
State:
18.8% of AGI
(% of AGI for various income ranges: 11.8% for AGIs below $25k, 7.4% for AGIs $50k-75k, 7.9% for AGIs $75k-100k, 10.0% for AGIs $100k-200k)
Charity contributions: $4,264 (reported on 15.3% of returns)
Here:
$4,264
State:
$3,943
(% of AGI for various income ranges: 1.9% for AGIs $50k-75k, 1.4% for AGIs $75k-100k, 1.6% for AGIs $100k-200k)
Taxes paid: $7,443 (reported on 19.4% of returns)
45729:
$7,443
State:
$9,568
(% of AGI for various income ranges: 2.3% for AGIs below $25k, 2.1% for AGIs $50k-75k, 2.3% for AGIs $75k-100k, 4.5% for AGIs $100k-200k)
Earned income credit: $2,020 (reported on 13.9% of returns)
Here:
$2,020
State:
$2,285
(% of AGI for various income ranges: 5.5% for AGIs below $25k, 0.5% for AGIs $25k-50k)
Percentage of individuals using paid preparers for their 2012 taxes: 52.8%
Here:
53%
State:
51%
(% for various income ranges: 46.4% for AGIs below $25k, 52.9% for AGIs $25k-50k, 58.3% for AGIs $50k-75k, 50.0% for AGIs $75k-100k, 71.4% for AGIs $100k-200k)
Averages for the 2004 tax year for zip code 45729, filed in 2005:
Average Adjusted Gross Income (AGI) in 2004: $40,264 (Individual Income Tax Returns)
Here:
$40,264
State:
$44,480
Salary/wage: $39,102 (reported on 86.0% of returns)
Here:
$39,102
State:
$39,198
(% of AGI for various income ranges: 111.3% for AGIs below $10k, 67.9% for AGIs $10k-25k, 86.8% for AGIs $25k-50k, 89.0% for AGIs $50k-75k, 85.8% for AGIs $75k-100k, 74.5% for AGIs over 100k)
Taxable interest for individuals: $755 (reported on 45.5% of returns)
This zip code:
$755
Ohio:
$1,532
(% of AGI for various income ranges: 3.0% for AGIs below $10k, 2.5% for AGIs $10k-25k, 1.0% for AGIs $25k-50k, 0.4% for AGIs $50k-75k, 0.2% for AGIs $75k-100k, 0.9% for AGIs over 100k)
Taxable dividends: $822 (reported on 19.4% of returns)
Here:
$822
State:
$3,496
(% of AGI for various income ranges: 0.5% for AGIs below $10k, 0.6% for AGIs $10k-25k, 0.4% for AGIs $25k-50k, 0.3% for AGIs $50k-75k, 0.3% for AGIs $75k-100k, 0.5% for AGIs over 100k)
Net capital gain/loss: +$2,393 (reported on 12.7% of returns)
Here:
+$2,393
State:
+$8,582
(% of AGI for various income ranges: 1.3% for AGIs $10k-25k, 0.6% for AGIs $25k-50k, 0.4% for AGIs $50k-75k, 1.8% for AGIs over 100k)
Profit/loss from business: +$9,927 (reported on 12.3% of returns)
Here:
+$9,927
State:
+$10,813
(% of AGI for various income ranges: 9.5% for AGIs $10k-25k, 2.8% for AGIs $25k-50k, 3.5% for AGIs $50k-75k, 1.8% for AGIs $75k-100k)
IRA payment deduction: $1,909 (reported on 1.7% of returns)
45729:
$1,909
Ohio:
$2,794
Total itemized deductions: $15,599 (20% of AGI, reported on 20.6% of returns)
Here:
$15,599
State:
$17,503
Here:
20.1% of AGI
State:
20.8% of AGI
(% of AGI for various income ranges: 6.2% for AGIs $25k-50k, 8.2% for AGIs $50k-75k, 8.5% for AGIs $75k-100k, 14.9% for AGIs over 100k)
Charity contributions deductions: $2,805 (3% of AGI, reported on 17.0% of returns)
Here:
$2,805
State:
$3,087
Here:
3.4% of AGI
State:
3.4% of AGI
(% of AGI for various income ranges: 0.7% for AGIs $25k-50k, 1.1% for AGIs $50k-75k, 1.4% for AGIs $75k-100k, 2.5% for AGIs over 100k)
Total tax: $4,685 (reported on 78.8% of returns)
45729:
$4,685
State:
$6,781
(% of AGI for various income ranges: 3.0% for AGIs below $10k, 4.7% for AGIs $10k-25k, 6.7% for AGIs $25k-50k, 8.6% for AGIs $50k-75k, 9.9% for AGIs $75k-100k, 16.0% for AGIs over 100k)
Earned income credit: $1,785 (reported on 9.8% of returns)
Here:
$1,785
State:
$1,696
Percentage of individuals using paid preparers for their 2004 taxes: 51.8%
Here:
52%
State:
55%
(% for various income ranges: 48.3% for AGIs below $10k, 55.3% for AGIs $10k-25k, 54.5% for AGIs $25k-50k, 42.8% for AGIs $50k-75k, 58.1% for AGIs $75k-100k, 65.6% for AGIs over 100k)
Likely homosexual households (counted as self-reported same-sex unmarried-partner households)
Lesbian couples: 2.3% of all households
Gay men: 0.0% of all households
Household received Food Stamps/SNAP in the past 12 months: 0 Household did not receive Food Stamps/SNAP in the past 12 months: 721
Women who had a birth in the past 12 months: 12 (9 now married, 3 unmarried) Women who did not have a birth in the past 12 months: 523 (316 now married, 205 unmarried)
Housing units in zip code 45729 with a mortgage: 401 (17 second mortgage, 7 home equity loan, 10 both second mortgage and home equity loan) Houses without a mortgage: 33
Median monthly owner costs for units with a mortgage: $1,272 Median monthly owner costs for units without a mortgage: $393
Residents with income below the poverty level in 2022:
This zip code:
8.6%
Whole state:
13.4%
Residents with income below 50% of the poverty level in 2022:
This zip code:
1.5%
Whole state:
7.0%
Median number of rooms in houses and condos:
Here:
7.7
State:
6.7
Notable locations in this zip code not listed on our city pages
Streams, rivers, and creeks: Horse Run (A), Chainey Run (B), Buffalo Run (C), Turkeyhen Run (D), Halfway Run (E), Browns Run (F). Display/hide their locations on the map
Year house built (houses)
02020 or later
2402010 to 2019
922000 to 2009
841990 to 1999
741980 to 1989
771970 to 1979
481960 to 1969
671950 to 1959
131940 to 1949
521939 or earlier
Bedrooms in owner-occupied houses and condos in 45729
0no bedroom
441 bedroom
1532 bedrooms
2493 bedrooms
674 bedrooms
2245+ bedrooms
Cars and other vehicles available in 45729 in owner-occupied houses/condos
0no vehicle
1571 vehicle
2472 vehicles
2673 vehicles
424 vehicles
125+ vehicles
Zip code 45729 household income distribution in 2022
30$10,000 to $14,999
20$15,000 to $19,999
51$20,000 to $24,999
27$30,000 to $34,999
7$35,000 to $39,999
17$40,000 to $44,999
28$45,000 to $49,999
80$50,000 to $59,999
62$60,000 to $74,999
233$75,000 to $99,999
23$100,000 to $124,999
43$125,000 to $149,999
40$150,000 to $199,999
53$200,000 or more
Estimate of home value of owner-occupied houses/condos in 2022 in zip code 45729
30Less than $10,000
6$15,000 to $19,999
58$70,000 to $79,999
6$90,000 to $99,999
58$100,000 to $124,999
21$125,000 to $149,999
91$150,000 to $174,999
61$175,000 to $199,999
208$200,000 to $249,999
53$250,000 to $299,999
67$300,000 to $399,999
34$400,000 to $499,999
33$500,000 to $749,999
Estimated median house (or condo) value in 2022 for:
White Non-Hispanic householders: $217,483
Two or more races householders: $111,848
Estimated median house or condo value in 2022: $223,697
45729:
$223,697
Ohio:
$204,100
Lower value quartile - upper value quartile: $145,441 - $275,045
Mean price in 2022:
Detached houses: $236,615
Here:
$236,615
State:
$254,366
Mobile homes: $55,541
Here:
$55,541
State:
$62,719
Housing units in structures:
One, detached: 645
Mobile homes: 67
Unemployment: 8.2%
Means of transportation to work in zip code 45729
76.5%709Drove a car alone
12.4%115Carpooled
2.8%26Bus or trolley bus
5.9%55Worked at home
Travel time to work (commute) in zip code 45729
475 to 9 minutes
3910 to 14 minutes
7715 to 19 minutes
22520 to 24 minutes
8125 to 29 minutes
31430 to 34 minutes
5145 to 59 minutes
1790 or more minutes
Percentage of zip code residents living and working in this county: 71.2%
Household type by relationship:
Households: 2,107
Male householders: 365 (120 living alone), Female householders: 359 (114 living alone)
Size of family households: 168 2-persons, 83 3-persons, 55 4-persons, 13 5-persons, 137 6-persons, 19 7-or-more-persons
Size of nonfamily households: 233 1-person, 10 2-persons
305 married couples with children.
119 single-parent households (119 men).
99.3% of residents of 45729 zip code speak English at home.
Foreign born population: 13 (0.6%) (100.0% of them are naturalized citizens)
This zip code:
0.6%
Whole state:
5.0%
77%Belize
40%German
21%English
6%American
4%Irish
3%European
3%Scottish
1%French
Year of entry for the foreign-born population
02010 or later
02000 to 2009
121990 to 1999
0Before 1990
65.7%Utility gas
19.6%Electricity
7.3%Bottled, tank, or LP gas
4.2%Fuel oil, kerosene, etc.
3.0%Other fuel
0.6%Wood
Population in 1990: 1,864.
Place of birth for U.S.-born residents:
This state: 1,355
Northeast: 55
Midwest: 96
South: 553
West: 18
73% of the 45729 zip code residents lived in the same house 5 years ago. Out of people who lived in different houses, 74% lived in this county. Out of people who lived in different counties, 50% lived in Ohio.
100% of the 45729 zip code residents lived in the same house 1 year ago. Out of people who lived in different houses, 900% moved from this county.
Private vs. public school enrollment:
Students in private schools in grades 1 to 8 (elementary and middle school): 36
Here:
8.2%
Ohio:
16.0%
Students in private schools in grades 9 to 12 (high school): 38
Here:
16.6%
Ohio:
13.1%
Students in private undergraduate colleges:
Here:
0.0%
Ohio:
22.3%
Occupation by median earnings in the past 12 months ($)
246,312Architecture and engineering occupations
75,216Health diagnosing and treating practitioners and other technical occupations
64,921Education, training, and library occupations
59,060Office and administrative support occupations
55,532Production occupations
51,084Management occupations
Companies with federal contracts located in this zip code:
DECKER WELL SERVICE (HC 550 in FLEMING, OH; small business)
-$18,000 with Bureau of Land Management for Construction of Structures and Facilities -- Other Conservation and Development Facilities. Signed on 2000-09-15. Completion date: 1999-12-15.
Top industries in this zip code by the number of employees in 2005:
Mining: Drilling Oil and Gas Wells (20-49 employees: 1 establishment, 1-4 employees: 1 establishment)
Mining: Crude Petroleum and Natural Gas Extraction (20-49: 1)
Administrative and Support and Waste Management and Remediation Services: Janitorial Services (20-49: 1)
Construction: Highway, Street, and Bridge Construction (5-9: 1)
Professional, Scientific, and Technical Services: Other Accounting Services (5-9: 1)
Construction: Painting and Wall Covering Contractors (1-4: 1)
Mining: Support Activities for Oil and Gas Operations (1-4: 1)
Home Mortgage Disclosure Act Aggregated Statistics For Year 2009 (Based on 4 partial tracts)
A) FHA, FSA/RHS & VA Home Purchase Loans
B) Conventional Home Purchase Loans
C) Refinancings
D) Home Improvement Loans
F) Non-occupant Loans on < 5 Family Dwellings (A B C & D)
G) Loans On Manufactured Home Dwelling (A B C & D)
Number
Average Value
Number
Average Value
Number
Average Value
Number
Average Value
Number
Average Value
Number
Average Value
LOANS ORIGINATED
6
$116,597
14
$114,226
47
$117,170
3
$32,490
4
$89,768
7
$57,453
APPLICATIONS APPROVED, NOT ACCEPTED
0
$0
0
$0
2
$128,245
1
$33,060
0
$0
0
$0
APPLICATIONS DENIED
1
$193,910
5
$94,756
18
$130,672
3
$27,540
1
$171,400
3
$43,463
APPLICATIONS WITHDRAWN
1
$55,480
2
$109,885
12
$102,717
2
$44,810
0
$0
1
$89,380
FILES CLOSED FOR INCOMPLETENESS
0
$0
0
$0
2
$88,095
1
$63,750
0
$0
0
$0
Aggregated Statistics For Year 2008 (Based on 4 partial tracts)
A) FHA, FSA/RHS & VA Home Purchase Loans
B) Conventional Home Purchase Loans
C) Refinancings
D) Home Improvement Loans
F) Non-occupant Loans on < 5 Family Dwellings (A B C & D)
G) Loans On Manufactured Home Dwelling (A B C & D)
Number
Average Value
Number
Average Value
Number
Average Value
Number
Average Value
Number
Average Value
Number
Average Value
LOANS ORIGINATED
9
$101,513
14
$105,750
32
$113,824
8
$27,310
4
$89,620
8
$60,339
APPLICATIONS APPROVED, NOT ACCEPTED
1
$55,320
1
$192,160
2
$98,615
1
$10,310
0
$0
0
$0
APPLICATIONS DENIED
1
$75,750
3
$84,067
21
$112,960
4
$70,010
0
$0
5
$86,286
APPLICATIONS WITHDRAWN
0
$0
1
$35,420
10
$124,439
0
$0
0
$0
2
$48,345
FILES CLOSED FOR INCOMPLETENESS
0
$0
0
$0
1
$253,870
0
$0
0
$0
0
$0
Aggregated Statistics For Year 2007 (Based on 4 partial tracts)
A) FHA, FSA/RHS & VA Home Purchase Loans
B) Conventional Home Purchase Loans
C) Refinancings
D) Home Improvement Loans
F) Non-occupant Loans on < 5 Family Dwellings (A B C & D)
G) Loans On Manufactured Home Dwelling (A B C & D)
Number
Average Value
Number
Average Value
Number
Average Value
Number
Average Value
Number
Average Value
Number
Average Value
LOANS ORIGINATED
7
$102,126
28
$113,331
33
$116,988
7
$32,367
6
$87,880
10
$64,541
APPLICATIONS APPROVED, NOT ACCEPTED
0
$0
4
$116,750
3
$108,143
2
$52,125
0
$0
1
$85,980
APPLICATIONS DENIED
0
$0
7
$92,104
25
$93,560
7
$40,546
1
$72,030
7
$57,699
APPLICATIONS WITHDRAWN
1
$107,590
2
$109,885
11
$112,936
2
$87,065
0
$0
0
$0
FILES CLOSED FOR INCOMPLETENESS
0
$0
0
$0
1
$123,100
0
$0
0
$0
0
$0
Aggregated Statistics For Year 2006 (Based on 4 partial tracts)
A) FHA, FSA/RHS & VA Home Purchase Loans
B) Conventional Home Purchase Loans
C) Refinancings
D) Home Improvement Loans
F) Non-occupant Loans on < 5 Family Dwellings (A B C & D)
G) Loans On Manufactured Home Dwelling (A B C & D)
Number
Average Value
Number
Average Value
Number
Average Value
Number
Average Value
Number
Average Value
Number
Average Value
LOANS ORIGINATED
6
$106,908
24
$113,384
41
$89,960
10
$29,485
6
$82,557
10
$59,208
APPLICATIONS APPROVED, NOT ACCEPTED
0
$0
5
$76,036
7
$86,976
1
$56,530
0
$0
3
$42,767
APPLICATIONS DENIED
2
$100,835
8
$84,452
36
$92,163
7
$22,660
0
$0
11
$58,528
APPLICATIONS WITHDRAWN
1
$115,360
5
$104,928
18
$108,170
1
$92,910
0
$0
2
$81,930
FILES CLOSED FOR INCOMPLETENESS
0
$0
0
$0
6
$101,388
1
$30,960
0
$0
0
$0
Aggregated Statistics For Year 2005 (Based on 4 partial tracts)
A) FHA, FSA/RHS & VA Home Purchase Loans
B) Conventional Home Purchase Loans
C) Refinancings
D) Home Improvement Loans
F) Non-occupant Loans on < 5 Family Dwellings (A B C & D)
G) Loans On Manufactured Home Dwelling (A B C & D)
Number
Average Value
Number
Average Value
Number
Average Value
Number
Average Value
Number
Average Value
Number
Average Value
LOANS ORIGINATED
3
$110,400
27
$101,279
37
$94,656
8
$19,530
3
$73,330
9
$55,510
APPLICATIONS APPROVED, NOT ACCEPTED
0
$0
5
$58,080
12
$76,402
2
$46,165
1
$28,270
4
$70,982
APPLICATIONS DENIED
0
$0
12
$78,313
44
$95,545
8
$26,178
0
$0
15
$56,798
APPLICATIONS WITHDRAWN
1
$56,590
6
$81,740
23
$102,961
5
$118,088
1
$58,070
6
$57,608
FILES CLOSED FOR INCOMPLETENESS
0
$0
1
$63,140
3
$88,797
1
$12,270
0
$0
1
$33,170
Aggregated Statistics For Year 2004 (Based on 4 partial tracts)
A) FHA, FSA/RHS & VA Home Purchase Loans
B) Conventional Home Purchase Loans
C) Refinancings
D) Home Improvement Loans
F) Non-occupant Loans on < 5 Family Dwellings (A B C & D)
G) Loans On Manufactured Home Dwelling (A B C & D)
Number
Average Value
Number
Average Value
Number
Average Value
Number
Average Value
Number
Average Value
Number
Average Value
LOANS ORIGINATED
2
$62,105
31
$90,692
50
$83,436
8
$35,682
3
$114,793
16
$45,734
APPLICATIONS APPROVED, NOT ACCEPTED
1
$118,050
4
$74,270
6
$71,295
1
$38,430
1
$34,880
3
$35,790
APPLICATIONS DENIED
1
$33,170
7
$66,434
28
$91,266
6
$21,898
0
$0
9
$54,718
APPLICATIONS WITHDRAWN
0
$0
4
$79,045
20
$92,877
2
$55,795
1
$45,100
3
$77,427
FILES CLOSED FOR INCOMPLETENESS
0
$0
0
$0
2
$100,305
0
$0
0
$0
0
$0
Aggregated Statistics For Year 2003 (Based on 4 partial tracts)
A) FHA, FSA/RHS & VA Home Purchase Loans
B) Conventional Home Purchase Loans
C) Refinancings
D) Home Improvement Loans
F) Non-occupant Loans on < 5 Family Dwellings (A B C & D)
Number
Average Value
Number
Average Value
Number
Average Value
Number
Average Value
Number
Average Value
LOANS ORIGINATED
4
$91,872
26
$88,097
82
$82,767
7
$13,077
3
$49,200
APPLICATIONS APPROVED, NOT ACCEPTED
1
$66,680
3
$87,133
8
$81,902
0
$0
0
$0
APPLICATIONS DENIED
1
$41,650
12
$66,601
32
$76,265
3
$4,960
0
$0
APPLICATIONS WITHDRAWN
0
$0
4
$83,985
17
$91,171
1
$12,610
1
$26,730
FILES CLOSED FOR INCOMPLETENESS
0
$0
1
$61,410
1
$90,640
0
$0
0
$0
Aggregated Statistics For Year 2002 (Based on 4 partial tracts)
A) FHA, FSA/RHS & VA Home Purchase Loans
B) Conventional Home Purchase Loans
C) Refinancings
D) Home Improvement Loans
F) Non-occupant Loans on < 5 Family Dwellings (A B C & D)
Number
Average Value
Number
Average Value
Number
Average Value
Number
Average Value
Number
Average Value
LOANS ORIGINATED
6
$85,190
22
$80,602
57
$82,298
7
$12,601
2
$28,785
APPLICATIONS APPROVED, NOT ACCEPTED
1
$114,950
2
$67,920
9
$68,748
0
$0
0
$0
APPLICATIONS DENIED
1
$59,080
8
$60,268
20
$64,592
2
$13,440
0
$0
APPLICATIONS WITHDRAWN
0
$0
3
$51,403
13
$94,661
0
$0
1
$23,830
FILES CLOSED FOR INCOMPLETENESS
0
$0
0
$0
3
$82,693
0
$0
0
$0
Aggregated Statistics For Year 2001 (Based on 4 partial tracts)
A) FHA, FSA/RHS & VA Home Purchase Loans
B) Conventional Home Purchase Loans
C) Refinancings
D) Home Improvement Loans
F) Non-occupant Loans on < 5 Family Dwellings (A B C & D)
Number
Average Value
Number
Average Value
Number
Average Value
Number
Average Value
Number
Average Value
LOANS ORIGINATED
3
$90,030
26
$82,391
64
$74,008
8
$15,114
1
$55,500
APPLICATIONS APPROVED, NOT ACCEPTED
0
$0
3
$40,100
5
$67,272
1
$13,780
0
$0
APPLICATIONS DENIED
1
$53,620
9
$60,430
17
$65,894
2
$5,605
1
$88,290
APPLICATIONS WITHDRAWN
0
$0
3
$70,603
8
$65,638
1
$2,100
0
$0
FILES CLOSED FOR INCOMPLETENESS
0
$0
0
$0
1
$31,590
0
$0
0
$0
Aggregated Statistics For Year 2000 (Based on 4 partial tracts)
A) FHA, FSA/RHS & VA Home Purchase Loans
B) Conventional Home Purchase Loans
C) Refinancings
D) Home Improvement Loans
F) Non-occupant Loans on < 5 Family Dwellings (A B C & D)
Number
Average Value
Number
Average Value
Number
Average Value
Number
Average Value
Number
Average Value
LOANS ORIGINATED
1
$84,820
20
$75,118
32
$57,484
9
$21,630
3
$63,127
APPLICATIONS APPROVED, NOT ACCEPTED
0
$0
4
$60,540
7
$63,541
1
$26,400
0
$0
APPLICATIONS DENIED
0
$0
9
$47,334
16
$53,673
3
$13,160
1
$37,840
APPLICATIONS WITHDRAWN
0
$0
4
$85,090
4
$49,465
0
$0
0
$0
FILES CLOSED FOR INCOMPLETENESS
0
$0
0
$0
2
$72,270
0
$0
0
$0
Aggregated Statistics For Year 1999 (Based on 2 partial tracts)
A) FHA, FSA/RHS & VA Home Purchase Loans
B) Conventional Home Purchase Loans
C) Refinancings
D) Home Improvement Loans
F) Non-occupant Loans on < 5 Family Dwellings (A B C & D)


 Nearest zip codes: 45787, 45784, 45786, 45714, 26105, 45721.


