Estimated zip code population in 2022: 752 Zip code population in 2010: 1,435 Zip code population in 2000: 1,486
Houses and condos: 380 Renter-occupied apartments: 24
% of renters here:
7%
State:
33%
March 2022 cost of living index in zip code 45821: 81.9 (low, U.S. average is 100)
Land area: 39.7 sq. mi. Water area: 0.4 sq. mi.
Population density: 19 people per square mile
(very low).
OSM Map
General Map
Google Map
MSN Map
OSM Map
General Map
Google Map
MSN Map
OSM Map
General Map
Google Map
MSN Map
OSM Map
General Map
Google Map
MSN Map
Please wait while loading the map...
Real estate property taxes paid for housing units in 2022:
This zip code:
0.9% ($1,226)
Ohio:
1.3% ($2,639)
Median real estate property taxes paid for housing units with mortgages in 2022: $1,400 (0.9%) Median real estate property taxes paid for housing units with no mortgage in 2022: $925 (0.9%)
Business Search- 14 Million verified businesses
Males: 433
(57.6%)
Females: 319
(42.4%)
For population 25 years and over in 45821:
High school or higher: 85.9%
Bachelor's degree or higher: 14.0%
Graduate or professional degree: 8.0%
Unemployed: 0.3%
Mean travel time to work (commute): 23.9 minutes
For population 15 years and over in 45821:
Never married: 15.6%
Now married: 69.6%
Separated: 0.0%
Widowed: 2.4%
Divorced: 12.4%
Zip code 45821 compared to state average:
Unemployed percentage significantly below state average.
Black race population percentage significantly below state average.
Median age significantly above state average.
Foreign-born population percentage significantly below state average.
Renting percentage significantly below state average.
Length of stay since moving in significantly above state average.
Number of college students below state average.
Percentage of population with a bachelor's degree or higher below state average.
Averages for the 2020 tax year for zip code 45821, filed in 2021:
Average Adjusted Gross Income (AGI) in 2020: $49,887 (Individual Income Tax Returns)
Here:
$49,887
State:
$67,288
Salary/wage: $43,882 (reported on 82.0% of returns)
Here:
$43,882
State:
$55,628
(% of AGI for various income ranges: 931.3% for AGIs below $25k, 3419.3% for AGIs $25k-50k, 6403.3% for AGIs $50k-75k, 7592.0% for AGIs $75k-100k, 15495.0% for AGIs $100k-200k)
Taxable interest for individuals: $507 (reported on 23.0% of returns)
This zip code:
$507
Ohio:
$1,518
(% of AGI for various income ranges: 7.3% for AGIs below $25k, 11.4% for AGIs $25k-50k, 44.4% for AGIs $50k-75k, 10.0% for AGIs $100k-200k)
Ordinary dividends: $843 (reported on 11.5% of returns)
Here:
$843
State:
$7,167
(% of AGI for various income ranges: 27.1% for AGIs $25k-50k, 42.0% for AGIs $75k-100k)
Net capital gain/loss in AGI: +$4,560 (reported on 8.2% of returns)
Here:
+$4,560
State:
+$18,919
(% of AGI for various income ranges: 32.1% for AGIs $25k-50k, 366.0% for AGIs $75k-100k)
Profit/loss from business: +$5,550 (reported on 9.8% of returns)
Here:
+$5,550
State:
+$13,744
(% of AGI for various income ranges: 100.7% for AGIs below $25k, 202.2% for AGIs $50k-75k)
Taxable individual retirement arrangement distribution: $7,625 (reported on 6.6% of returns)
45821:
$7,625
Ohio:
$18,876
(% of AGI for various income ranges: 217.9% for AGIs $25k-50k)
Earned income credit: $2,138 (reported on 13.1% of returns)
Here:
$2,138
State:
$2,304
(% of AGI for various income ranges: 70.0% for AGIs below $25k, 47.1% for AGIs $25k-50k)
Percentage of individuals using paid preparers for their 2020 taxes: 96.7%
Here:
97%
State:
94%
(% for various income ranges: 94.7% for AGIs below $25k, 100.0% for AGIs $25k-50k, 92.3% for AGIs $50k-75k, 100.0% for AGIs $75k-100k, 100.0% for AGIs $100k-200k)
Averages for the 2012 tax year for zip code 45821, filed in 2013:
Average Adjusted Gross Income (AGI) in 2012: $41,661 (Individual Income Tax Returns)
Here:
$41,661
State:
$54,926
Salary/wage: $35,748 (reported on 83.9% of returns)
Here:
$35,748
State:
$45,869
(% of AGI for various income ranges: 70.8% for AGIs below $25k, 77.6% for AGIs $25k-50k, 72.8% for AGIs $50k-75k, 70.0% for AGIs $75k-100k, 64.1% for AGIs $100k-200k)
Taxable interest for individuals: $418 (reported on 27.4% of returns)
This zip code:
$418
Ohio:
$1,297
(% of AGI for various income ranges: 0.3% for AGIs below $25k, 0.4% for AGIs $25k-50k, 0.3% for AGIs $50k-75k, 0.2% for AGIs $75k-100k)
Ordinary dividends: $767 (reported on 9.7% of returns)
Here:
$767
State:
$5,821
(% of AGI for various income ranges: 0.4% for AGIs $25k-50k, 0.2% for AGIs $50k-75k)
Net capital gain/loss in AGI: +$617 (reported on 9.7% of returns)
Here:
+$617
State:
+$11,232
(% of AGI for various income ranges: 0.9% for AGIs $50k-75k)
Profit/loss from business: +$8,522 (reported on 14.5% of returns)
Here:
+$8,522
State:
+$12,773
(% of AGI for various income ranges: 2.5% for AGIs below $25k, 1.5% for AGIs $25k-50k, 12.9% for AGIs $75k-100k)
Taxable individual retirement arrangement distribution: $8,400 (reported on 6.5% of returns)
45821:
$8,400
Ohio:
$14,511
(% of AGI for various income ranges: 3.2% for AGIs below $25k, 3.8% for AGIs $50k-75k)
Total itemized deductions: $14,408 (21% of AGI, reported on 19.4% of returns)
Here:
$14,408
State:
$21,278
Here:
21.0% of AGI
State:
18.8% of AGI
(% of AGI for various income ranges: 7.6% for AGIs $25k-50k, 6.3% for AGIs $50k-75k, 6.6% for AGIs $75k-100k, 10.2% for AGIs $100k-200k)
Charity contributions: $2,743 (reported on 11.3% of returns)
Here:
$2,743
State:
$3,943
(% of AGI for various income ranges: 1.3% for AGIs $25k-50k, 2.1% for AGIs $75k-100k)
Taxes paid: $5,033 (reported on 19.4% of returns)
45821:
$5,033
State:
$9,568
(% of AGI for various income ranges: 1.7% for AGIs $25k-50k, 2.0% for AGIs $50k-75k, 2.8% for AGIs $75k-100k, 4.9% for AGIs $100k-200k)
Earned income credit: $2,430 (reported on 16.1% of returns)
Here:
$2,430
State:
$2,285
(% of AGI for various income ranges: 6.4% for AGIs below $25k, 0.7% for AGIs $25k-50k)
Percentage of individuals using paid preparers for their 2012 taxes: 66.1%
Here:
66%
State:
51%
(% for various income ranges: 56.5% for AGIs below $25k, 65.0% for AGIs $25k-50k, 80.0% for AGIs $50k-75k, 80.0% for AGIs $75k-100k, 75.0% for AGIs $100k-200k)
Averages for the 2004 tax year for zip code 45821, filed in 2005:
Average Adjusted Gross Income (AGI) in 2004: $35,793 (Individual Income Tax Returns)
Here:
$35,793
State:
$44,480
Salary/wage: $32,808 (reported on 89.9% of returns)
Here:
$32,808
State:
$39,198
(% of AGI for various income ranges: 93.9% for AGIs below $10k, 75.6% for AGIs $10k-25k, 82.9% for AGIs $25k-50k, 86.4% for AGIs $50k-75k, 88.7% for AGIs $75k-100k, 57.8% for AGIs over 100k)
Taxable interest for individuals: $656 (reported on 37.4% of returns)
This zip code:
$656
Ohio:
$1,532
(% of AGI for various income ranges: 2.9% for AGIs below $10k, 1.6% for AGIs $10k-25k, 0.7% for AGIs $25k-50k, 0.6% for AGIs $50k-75k, 0.4% for AGIs $75k-100k)
Taxable dividends: $391 (reported on 13.4% of returns)
Here:
$391
State:
$3,496
(% of AGI for various income ranges: 0.5% for AGIs $10k-25k, 0.1% for AGIs $25k-50k, 0.2% for AGIs $50k-75k, 0.1% for AGIs $75k-100k)
Net capital gain/loss: +$944 (reported on 7.9% of returns)
Here:
+$944
State:
+$8,582
Profit/loss from business: +$2,864 (reported on 11.8% of returns)
Here:
+$2,864
State:
+$10,813
(% of AGI for various income ranges: -0.1% for AGIs $10k-25k, 2.2% for AGIs $25k-50k, 1.3% for AGIs $50k-75k, -1.0% for AGIs $75k-100k)
Profit/loss from farming: +$769 (reported on 7.6% of returns)
Here:
+$769
State:
-$3,706
IRA payment deduction: $2,700 (reported on 1.5% of returns)
45821:
$2,700
Ohio:
$2,794
Total itemized deductions: $12,627 (21% of AGI, reported on 23.5% of returns)
Here:
$12,627
State:
$17,503
Here:
21.1% of AGI
State:
20.8% of AGI
(% of AGI for various income ranges: 5.6% for AGIs $10k-25k, 6.8% for AGIs $25k-50k, 9.3% for AGIs $50k-75k, 10.4% for AGIs $75k-100k, 13.5% for AGIs over 100k)
Charity contributions deductions: $2,573 (4% of AGI, reported on 17.1% of returns)
Here:
$2,573
State:
$3,087
Here:
4.1% of AGI
State:
3.4% of AGI
Total tax: $3,855 (reported on 78.4% of returns)
45821:
$3,855
State:
$6,781
(% of AGI for various income ranges: 3.5% for AGIs below $10k, 4.2% for AGIs $10k-25k, 6.8% for AGIs $25k-50k, 8.4% for AGIs $50k-75k, 10.8% for AGIs $75k-100k, 18.5% for AGIs over 100k)
Earned income credit: $1,606 (reported on 13.7% of returns)
Here:
$1,606
State:
$1,696
Percentage of individuals using paid preparers for their 2004 taxes: 63.4%
Here:
63%
State:
55%
(% for various income ranges: 53.4% for AGIs below $10k, 59.2% for AGIs $10k-25k, 67.4% for AGIs $25k-50k, 67.9% for AGIs $50k-75k, 86.0% for AGIs $75k-100k)
Household received Food Stamps/SNAP in the past 12 months: 21 Household did not receive Food Stamps/SNAP in the past 12 months: 338
Women who had a birth in the past 12 months: 31 (22 now married, 9 unmarried) Women who did not have a birth in the past 12 months: 70 (45 now married, 24 unmarried)
Housing units in zip code 45821 with a mortgage: 160 (3 second mortgage, 1 both second mortgage and home equity loan) Median monthly owner costs for units with a mortgage: $964 Median monthly owner costs for units without a mortgage: $368
Residents with income below the poverty level in 2022:
This zip code:
4.3%
Whole state:
13.4%
Median number of rooms in houses and condos:
Here:
6.1
State:
6.7
Median number of rooms in apartments:
Here:
5.6
State:
4.4
Notable locations in this zip code not listed on our city pages
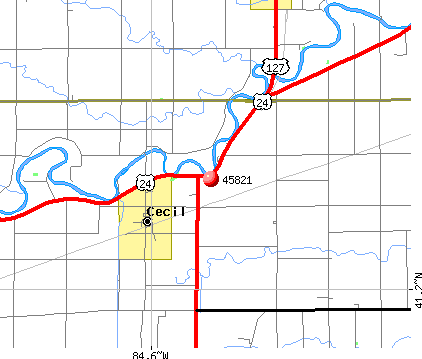
Notable locations in zip code 45821: Eaton Childrens Home (A), Crane Township Cecil Fire Department (B), Emerald Township Hall (C), Crane Township Hall (D), Cecil Community Grange (E). Display/hide their locations on the map
Size of family households: 155 2-persons, 80 3-persons, 16 4-persons
Size of nonfamily households: 106 1-person, 4 3-persons
65 married couples with children.
43 single-parent households (10 men, 33 women).
96.2% of residents of 45821 zip code speak English at home.
3.8% of residents speak Spanish at home (100% very well).
Foreign born population: 0 (0.0%)
:
0.0%
Whole state:
5.0%
48%German
10%American
7%European
6%Irish
3%Hungarian
1%British
1%Dutch
Facilities with environmental interests located in this zip code:
CECIL WWTP (17228 RD 105 in CECIL, OH)
STATE MASTER (Ohio general info) - PCS-OH0029238, National Pollutant Discharge Elimination System Permit National Pollutant Discharge Elimination System NON-MAJOR (Tracking pollutant discharge elimination systems) - permit Business SIC classification: SEWERAGE SYSTEMS Organizations: CECIL, VILLAGE OF (CONTACT/OWNER)
, VILLAGE OF CECIL (CONTACT/OWNER)
Alternative names: CECIL WASTEWATER WORKS, VILLAGE OF CECIL
BRENTWOOD MHP (ON THE N SIDE OF US RTE 24, 1M in CECIL, OH)
National Pollutant Discharge Elimination System NON-MAJOR (Tracking pollutant discharge elimination systems) - permit Business SIC classification: SEWERAGE SYSTEMS Organizations: SWANTON PROPERTIES LTD. (CONTACT/OWNER)
Housing units lacking complete plumbing facilities: 0.9% Housing units lacking complete kitchen facilities: 0.9%
51.5%Bottled, tank, or LP gas
30.8%Electricity
7.9%Wood
5.4%Fuel oil, kerosene, etc.
4.8%Utility gas
Population in 1990: 1,527.
Place of birth for U.S.-born residents:
This state: 515
Northeast: 10
Midwest: 150
South: 71
West: 2
62% of the 45821 zip code residents lived in the same house 5 years ago. Out of people who lived in different houses, 46% lived in this county. Out of people who lived in different counties, 50% lived in Ohio.
98% of the 45821 zip code residents lived in the same house 1 year ago. Out of people who lived in different houses, 31% moved from this county. Out of people who lived in different houses, 100% moved from different county within same state.
Private vs. public school enrollment:
Students in private schools in grades 1 to 8 (elementary and middle school):
Here:
0.0%
Ohio:
16.0%
Students in private schools in grades 9 to 12 (high school):
Here:
0.0%
Ohio:
13.1%
Students in private undergraduate colleges: 3
Here:
26.6%
Ohio:
22.3%
Occupation by median earnings in the past 12 months ($)
82,176Transportation occupations
76,437Education, training, and library occupations
73,816Construction and extraction occupations
60,374Installation, maintenance, and repair occupations
41,492Production occupations
39,497Material moving occupations
Top industries in this zip code by the number of employees in 2005:
Other Services (except Public Administration): Religious Organizations (5-9 employees: 1 establishment)
Construction: All Other Specialty Trade Contractors (5-9: 1)
Construction: Poured Concrete Foundation and Structure Contractors (1-4: 1)
Wholesale Trade: Grain and Field Bean Merchant Wholesalers (1-4: 1)
Administrative and Support and Waste Management and Remediation Services: Janitorial Services (1-4: 1)
Construction: Site Preparation Contractors (1-4: 1)
Fatal accident statistics in 2014:
Fatal accident count: 1
Vehicles involved in fatal accidents: 2
Fatal accidents caused by drunken drivers: 0
Fatalities: 1
Persons involved in fatal accidents: 4
Pedestrians involved in fatal accidents: 0
Fatal accident statistics in 2013:
Fatal accident count: 4
Vehicles involved in fatal accidents: 7
Fatal accidents caused by drunken drivers: 0
Fatalities: 4
Persons involved in fatal accidents: 10
Pedestrians involved in fatal accidents: 0
2002 - 2018 National Fire Incident Reporting System (NFIRS) incidents
According to the data from the years 2002 - 2018 the average number of fires per year is 14. The highest number of reported fire incidents - 29 took place in 2010, and the least - 3 in 2002. The data has a rising trend.
When looking into fire subcategories, the most incidents belonged to: Structure Fires (53.0%), and Outside Fires (32.6%).
Fire incident types reported to NFIRS in Zip Code 45821


+$769
-$3,706
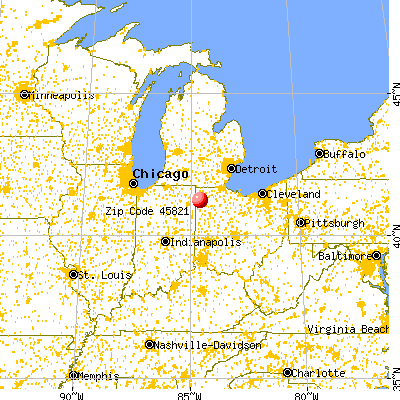
 Nearest zip codes: 43556, 45879, 43536, 45855, 43549, 45813.


 According to the data from the years 2002 - 2018 the average number of fires per year is 14. The highest number of reported fire incidents - 29 took place in 2010, and the least - 3 in 2002. The data has a rising trend.
 When looking into fire subcategories, the most incidents belonged to: Structure Fires (53.0%), and Outside Fires (32.6%).