Estimated zip code population in 2022: 2,613 Zip code population in 2010: 2,274 Zip code population in 2000: 2,269
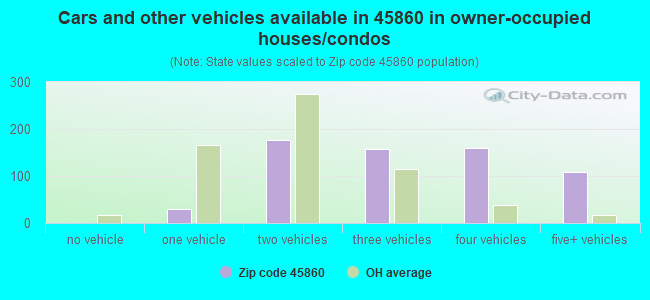
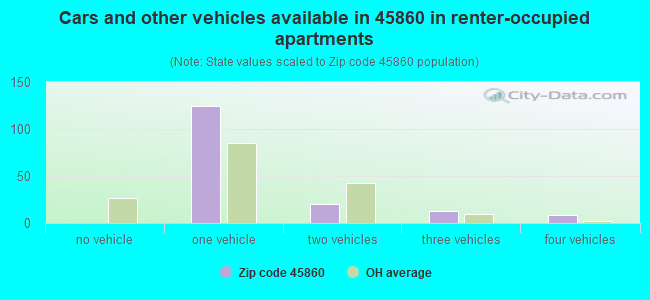
Houses and condos: 799 Renter-occupied apartments: 166
% of renters here:
21%
State:
33%
March 2022 cost of living index in zip code 45860: 83.0 (low, U.S. average is 100)
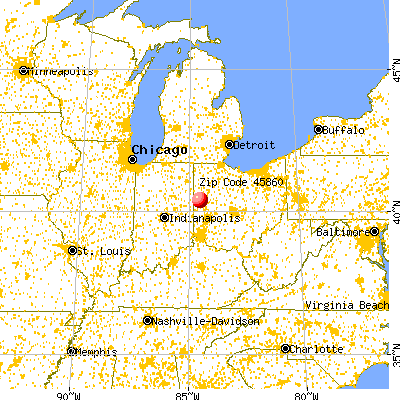
Land area: 35.0 sq. mi. Water area: 0.0 sq. mi.
Population density: 75 people per square mile
(very low).
OSM Map
General Map
Google Map
MSN Map
OSM Map
General Map
Google Map
MSN Map
OSM Map
General Map
Google Map
MSN Map
OSM Map
General Map
Google Map
MSN Map
Please wait while loading the map...
Real estate property taxes paid for housing units in 2022:
This zip code:
1.1% ($3,607)
Ohio:
1.3% ($2,639)
Median real estate property taxes paid for housing units with mortgages in 2022: $3,510 (1.0%) Median real estate property taxes paid for housing units with no mortgage in 2022: $3,818 (1.4%)
Business Search- 14 Million verified businesses
Males: 1,328
(50.8%)
Females: 1,284
(49.2%)
For population 25 years and over in 45860:
High school or higher: 95.0%
Bachelor's degree or higher: 26.3%
Graduate or professional degree: 7.7%
Mean travel time to work (commute): 19.7 minutes
For population 15 years and over in 45860:
Never married: 34.4%
Now married: 64.2%
Separated: 0.0%
Widowed: 0.9%
Divorced: 0.5%
Zip code 45860 compared to state average:
Median household income above state average.
Median house value above state average.
Unemployed percentage significantly below state average.
Black race population percentage significantly below state average.
Renting percentage below state average.
Length of stay since moving in significantly above state average.
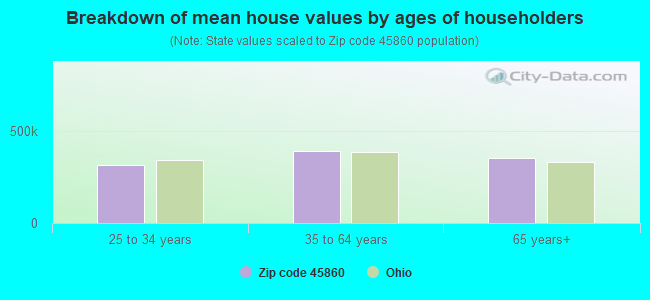
Estimated median house/condo value in 2022: $320,904
45860:
$320,904
Ohio:
$204,100
According to our research of Ohio and other state lists, there was 1 registered sex offender living in 45860 zip code as of May 10, 2024. The ratio of all residents to sex offenders in zip code 45860 is 2,281 to 1. The ratio of registered sex offenders to all residents in this zip code is much lower than the state average.
Median resident age:
This zip code:
37.9 years
Ohio median age:
39.9 years
Average household size:
This zip code:
3.2 people
Ohio:
2.4 people
Averages for the 2020 tax year for zip code 45860, filed in 2021:
Average Adjusted Gross Income (AGI) in 2020: $80,723 (Individual Income Tax Returns)
Here:
$80,723
State:
$67,288
Salary/wage: $60,943 (reported on 87.8% of returns)
Here:
$60,943
State:
$55,628
(% of AGI for various income ranges: 1780.0% for AGIs below $25k, 5546.7% for AGIs $25k-50k, 8943.6% for AGIs $50k-75k, 10385.6% for AGIs $75k-100k, 19108.3% for AGIs $100k-200k)
Taxable interest for individuals: $1,742 (reported on 58.3% of returns)
This zip code:
$1,742
Ohio:
$1,518
(% of AGI for various income ranges: 35.0% for AGIs below $25k, 79.2% for AGIs $25k-50k, 154.5% for AGIs $50k-75k, 142.2% for AGIs $75k-100k, 293.3% for AGIs $100k-200k)
Ordinary dividends: $4,497 (reported on 33.9% of returns)
Here:
$4,497
State:
$7,167
(% of AGI for various income ranges: 47.1% for AGIs below $25k, 75.0% for AGIs $25k-50k, 185.5% for AGIs $50k-75k, 234.4% for AGIs $75k-100k, 385.0% for AGIs $100k-200k)
Net capital gain/loss in AGI: +$11,062 (reported on 33.9% of returns)
Here:
+$11,062
State:
+$18,919
(% of AGI for various income ranges: 80.7% for AGIs below $25k, 175.8% for AGIs $25k-50k, 257.3% for AGIs $50k-75k, 455.6% for AGIs $75k-100k, 1153.3% for AGIs $100k-200k)
Profit/loss from business: +$17,793 (reported on 12.2% of returns)
Here:
+$17,793
State:
+$13,744
(% of AGI for various income ranges: 57.1% for AGIs below $25k, 195.0% for AGIs $25k-50k, 214.5% for AGIs $50k-75k, 304.4% for AGIs $75k-100k, 623.3% for AGIs $100k-200k)
Taxable individual retirement arrangement distribution: $14,625 (reported on 10.4% of returns)
45860:
$14,625
Ohio:
$18,876
(% of AGI for various income ranges: 96.4% for AGIs below $25k, 195.8% for AGIs $25k-50k, 645.5% for AGIs $50k-75k, 562.5% for AGIs $100k-200k)
Total itemized deductions: $26,367 (reported on 2.6% of returns)
Here:
$26,367
State:
$33,869
(% of AGI for various income ranges: 878.9% for AGIs $75k-100k)
Taxes paid: $7,900 (reported on 1.7% of returns)
45860:
$7,900
State:
$7,681
(% of AGI for various income ranges: 175.6% for AGIs $75k-100k)
Earned income credit: $2,100 (reported on 2.6% of returns)
Here:
$2,100
State:
$2,304
(% of AGI for various income ranges: 45.0% for AGIs below $25k)
Percentage of individuals using paid preparers for their 2020 taxes: 97.4%
Here:
97%
State:
94%
(% for various income ranges: 93.3% for AGIs below $25k, 100.0% for AGIs $25k-50k, 100.0% for AGIs $50k-75k, 100.0% for AGIs $75k-100k, 100.0% for AGIs $100k-200k, 85.7% for AGIs over 200k)
Averages for the 2012 tax year for zip code 45860, filed in 2013:
Average Adjusted Gross Income (AGI) in 2012: $56,739 (Individual Income Tax Returns)
Here:
$56,739
State:
$54,926
Salary/wage: $44,875 (reported on 88.1% of returns)
Here:
$44,875
State:
$45,869
(% of AGI for various income ranges: 74.0% for AGIs below $25k, 79.9% for AGIs $25k-50k, 80.4% for AGIs $50k-75k, 74.5% for AGIs $75k-100k, 72.0% for AGIs $100k-200k, 38.5% for AGIs over 200k)
Taxable interest for individuals: $1,241 (reported on 53.2% of returns)
This zip code:
$1,241
Ohio:
$1,297
(% of AGI for various income ranges: 2.5% for AGIs below $25k, 1.6% for AGIs $25k-50k, 1.3% for AGIs $50k-75k, 0.5% for AGIs $75k-100k, 1.1% for AGIs $100k-200k, 1.0% for AGIs over 200k)
Ordinary dividends: $2,790 (reported on 28.4% of returns)
Here:
$2,790
State:
$5,821
(% of AGI for various income ranges: 1.5% for AGIs below $25k, 1.2% for AGIs $25k-50k, 1.6% for AGIs $50k-75k, 1.4% for AGIs $75k-100k, 1.8% for AGIs $100k-200k, 0.8% for AGIs over 200k)
Net capital gain/loss in AGI: +$12,121 (reported on 26.6% of returns)
Here:
+$12,121
State:
+$11,232
(% of AGI for various income ranges: 2.7% for AGIs below $25k, 2.3% for AGIs $25k-50k, 2.1% for AGIs $50k-75k, 6.2% for AGIs $75k-100k, 6.5% for AGIs $100k-200k, 12.1% for AGIs over 200k)
Profit/loss from business: +$10,033 (reported on 11.0% of returns)
Here:
+$10,033
State:
+$12,773
(% of AGI for various income ranges: 4.8% for AGIs below $25k, 2.2% for AGIs $25k-50k, 4.3% for AGIs $50k-75k, 2.4% for AGIs $100k-200k)
Taxable individual retirement arrangement distribution: $8,060 (reported on 9.2% of returns)
45860:
$8,060
Ohio:
$14,511
(% of AGI for various income ranges: 3.7% for AGIs below $25k, 3.0% for AGIs $25k-50k, 2.9% for AGIs $75k-100k)
Total itemized deductions: $16,268 (15% of AGI, reported on 20.2% of returns)
Here:
$16,268
State:
$21,278
Here:
15.2% of AGI
State:
18.8% of AGI
(% of AGI for various income ranges: 4.9% for AGIs $25k-50k, 5.6% for AGIs $50k-75k, 5.8% for AGIs $75k-100k, 12.4% for AGIs $100k-200k)
Charity contributions: $1,839 (reported on 16.5% of returns)
Here:
$1,839
State:
$3,943
(% of AGI for various income ranges: 0.3% for AGIs $25k-50k, 0.4% for AGIs $50k-75k, 0.5% for AGIs $75k-100k, 1.4% for AGIs $100k-200k)
Taxes paid: $7,914 (reported on 20.2% of returns)
45860:
$7,914
State:
$9,568
(% of AGI for various income ranges: 1.4% for AGIs $25k-50k, 2.0% for AGIs $50k-75k, 2.5% for AGIs $75k-100k, 7.6% for AGIs $100k-200k)
Earned income credit: $1,950 (reported on 3.7% of returns)
Here:
$1,950
State:
$2,285
(% of AGI for various income ranges: 1.1% for AGIs below $25k, 0.4% for AGIs $25k-50k)
Percentage of individuals using paid preparers for their 2012 taxes: 78.9%
Here:
79%
State:
51%
(% for various income ranges: 67.6% for AGIs below $25k, 82.8% for AGIs $25k-50k, 83.3% for AGIs $50k-75k, 85.7% for AGIs $75k-100k, 81.8% for AGIs $100k-200k, 100.0% for AGIs over 200k)
Averages for the 2004 tax year for zip code 45860, filed in 2005:
Average Adjusted Gross Income (AGI) in 2004: $40,393 (Individual Income Tax Returns)
Here:
$40,393
State:
$44,480
Salary/wage: $34,309 (reported on 86.2% of returns)
Here:
$34,309
State:
$39,198
(% of AGI for various income ranges: 142.1% for AGIs below $10k, 69.2% for AGIs $10k-25k, 83.1% for AGIs $25k-50k, 78.3% for AGIs $50k-75k, 78.0% for AGIs $75k-100k, 42.8% for AGIs over 100k)
Taxable interest for individuals: $1,298 (reported on 65.5% of returns)
This zip code:
$1,298
Ohio:
$1,532
(% of AGI for various income ranges: 9.3% for AGIs below $10k, 5.0% for AGIs $10k-25k, 2.4% for AGIs $25k-50k, 1.5% for AGIs $50k-75k, 1.8% for AGIs $75k-100k, 1.0% for AGIs over 100k)
Taxable dividends: $1,636 (reported on 31.1% of returns)
Here:
$1,636
State:
$3,496
(% of AGI for various income ranges: 4.6% for AGIs below $10k, 1.5% for AGIs $10k-25k, 0.6% for AGIs $25k-50k, 0.7% for AGIs $50k-75k, 2.4% for AGIs $75k-100k, 1.5% for AGIs over 100k)
Net capital gain/loss: +$5,094 (reported on 27.4% of returns)
Here:
+$5,094
State:
+$8,582
(% of AGI for various income ranges: -0.2% for AGIs below $10k, 4.6% for AGIs $10k-25k, 2.5% for AGIs $25k-50k, 4.1% for AGIs $50k-75k, 1.4% for AGIs $75k-100k, 6.0% for AGIs over 100k)
Profit/loss from business: +$10,345 (reported on 10.8% of returns)
Here:
+$10,345
State:
+$10,813
(% of AGI for various income ranges: 4.7% for AGIs below $10k, 3.1% for AGIs $10k-25k, 1.9% for AGIs $25k-50k, 3.6% for AGIs $50k-75k, 1.4% for AGIs $75k-100k, 4.2% for AGIs over 100k)
Profit/loss from farming: +$4,184 (reported on 12.3% of returns)
Here:
+$4,184
State:
-$3,706
(% of AGI for various income ranges: -11.1% for AGIs below $10k, -4.6% for AGIs $10k-25k, -0.5% for AGIs $25k-50k, 2.5% for AGIs $50k-75k, 6.9% for AGIs $75k-100k)
IRA payment deduction: $3,471 (reported on 3.3% of returns)
45860:
$3,471
Ohio:
$2,794
Self-employed pension: $8,545 (reported on 1.1% of returns)
Here:
$8,545
Ohio:
$13,981
Total itemized deductions: $11,723 (17% of AGI, reported on 26.0% of returns)
Here:
$11,723
State:
$17,503
Here:
17.4% of AGI
State:
20.8% of AGI
(% of AGI for various income ranges: 4.8% for AGIs $10k-25k, 7.7% for AGIs $25k-50k, 7.1% for AGIs $50k-75k, 8.1% for AGIs $75k-100k, 8.9% for AGIs over 100k)
Charity contributions deductions: $1,321 (2% of AGI, reported on 21.8% of returns)
Here:
$1,321
State:
$3,087
Here:
1.8% of AGI
State:
3.4% of AGI
(% of AGI for various income ranges: 0.4% for AGIs $10k-25k, 0.3% for AGIs $25k-50k, 1.1% for AGIs $50k-75k, 0.8% for AGIs $75k-100k, 0.9% for AGIs over 100k)
Total tax: $5,008 (reported on 78.6% of returns)
45860:
$5,008
State:
$6,781
(% of AGI for various income ranges: 3.7% for AGIs below $10k, 6.0% for AGIs $10k-25k, 7.1% for AGIs $25k-50k, 7.4% for AGIs $50k-75k, 9.9% for AGIs $75k-100k, 18.7% for AGIs over 100k)
Earned income credit: $1,419 (reported on 4.2% of returns)
Here:
$1,419
State:
$1,696
Percentage of individuals using paid preparers for their 2004 taxes: 78.1%
Here:
78%
State:
55%
(% for various income ranges: 68.0% for AGIs below $10k, 81.8% for AGIs $10k-25k, 80.0% for AGIs $25k-50k, 78.8% for AGIs $50k-75k, 84.0% for AGIs $75k-100k, 85.7% for AGIs over 100k)
Household received Food Stamps/SNAP in the past 12 months: 0 Household did not receive Food Stamps/SNAP in the past 12 months: 804
Women who had a birth in the past 12 months: 25 (26 now married, 0 unmarried) Women who did not have a birth in the past 12 months: 628 (326 now married, 301 unmarried)
Housing units in zip code 45860 with a mortgage: 337 (26 second mortgage, 27 both second mortgage and home equity loan) Median monthly owner costs for units with a mortgage: $1,826 Median monthly owner costs for units without a mortgage: $674
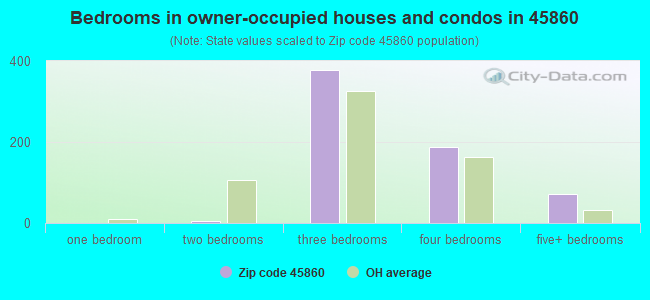
Median number of rooms in houses and condos:
Here:
7.6
State:
6.7
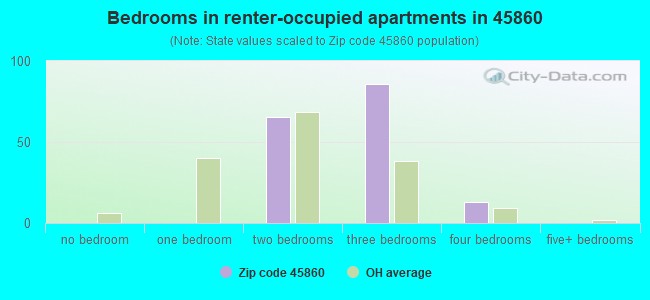
Median number of rooms in apartments:
Here:
4.7
State:
4.4
Notable locations in this zip code not listed on our city pages
Churches in zip code 45860 include: Gruenwald Convent (A), Maria Stein Catholic Church (B), Saint Rose Catholic Church (C), Nativity of the Blessed Virgin Mary Church (D). Display/hide their locations on the map
Cemeteries: Cassella Cemetery (1), Maria Stein Convent Cemetery (2), Saint Johns Catholic Cemetery (3), Saint Rose Catholic Cemetery (4). Display/hide their locations on the map
Size of family households: 173 2-persons, 257 3-persons, 84 4-persons, 78 5-persons, 43 6-persons, 40 7-or-more-persons
Size of nonfamily households: 26 1-person, 94 2-persons
561 married couples with children.
21 single-parent households (21 women).
94.8% of residents of 45860 zip code speak English at home.
4.5% of residents speak Spanish at home (66% not well, 34% not at all).
0.3% of residents speak other Indo-European language at home (100% very well).
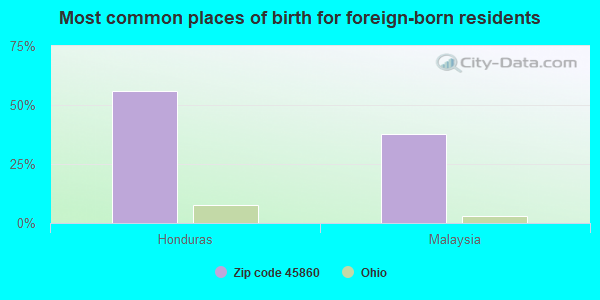
Foreign born population: 186 (7.1%) (4.4% of them are naturalized citizens)
This zip code:
7.1%
Whole state:
5.0%
56%Honduras
38%Malaysia
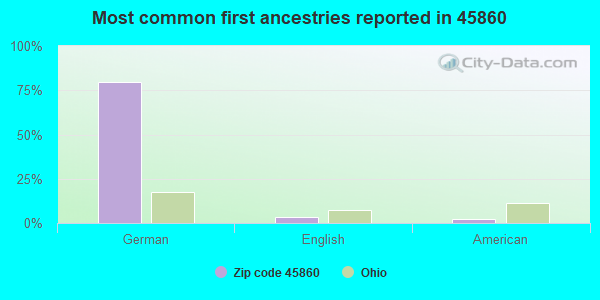
80%German
3%English
2%American
0%French Canadian
Year of entry for the foreign-born population
1262010 or later
652000 to 2009
01990 to 1999
15Before 1990
Facilities with environmental interests located in this zip code:
CHAPEL HILL SUBDIV WWTP (2365 SAINT JOHNS ROAD in MARIA STEIN, OH)
STATE MASTER (Ohio general info) - PCS-OH0079359, National Pollutant Discharge Elimination System Permit National Pollutant Discharge Elimination System NON-MAJOR (Tracking pollutant discharge elimination systems) - permit Business SIC classification: SEWERAGE SYSTEMS Organizations: MERCER CO COMMISSIONERS (CONTACT/OWNER)
, MERCER CO BRD OF COMM (CONTACT/OWNER)
Alternative names: MERCER CO COMMISSIONERS, MERCER CO COMMISSIONERS CHAPEL HILL SUBDIVISION, MERCER COunty COMMISSIONERS CHAPEL HILL SUBDIVISION
BERGMAN TOOL & MACHINE CO (6485 ST RT 119 in MARIA STEIN, OH)
STATE MASTER (Ohio general info) - RCRA-OHR000014563, HAZARDOUS WASTE PROGRAM Small Quantity Generators, between 100 kg and 1000 kg of hazardous waste/month (Resource Conservation and Recovery Act (tracking hazardous waste)) - notification Organizations: TED BERGMAN (CONTACT/OWNER)
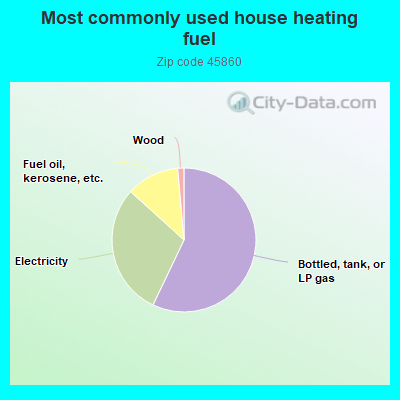
57.2%Bottled, tank, or LP gas
29.7%Electricity
11.9%Fuel oil, kerosene, etc.
1.4%Wood
Population in 1990: 2,284.
Place of birth for U.S.-born residents:
This state: 2,377
Northeast: 10
Midwest: 20
South: 10
73% of the 45860 zip code residents lived in the same house 5 years ago. Out of people who lived in different houses, 72% lived in this county. Out of people who lived in different counties, 50% lived in Ohio.
97% of the 45860 zip code residents lived in the same house 1 year ago. Out of people who lived in different houses, 127% moved from different county within same state.
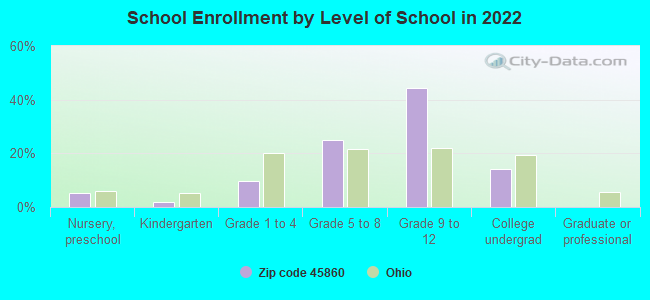
Private vs. public school enrollment:
Students in private schools in grades 1 to 8 (elementary and middle school):
Here:
0.0%
Ohio:
16.0%
Students in private schools in grades 9 to 12 (high school):
Here:
0.0%
Ohio:
13.1%
Students in private undergraduate colleges:
Here:
0.0%
Ohio:
22.3%
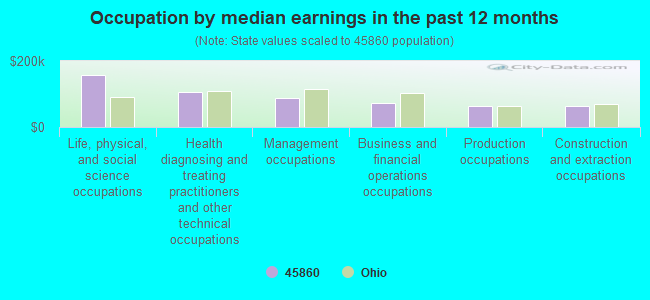
Occupation by median earnings in the past 12 months ($)
158,539Life, physical, and social science occupations
107,291Health diagnosing and treating practitioners and other technical occupations
87,324Management occupations
72,017Business and financial operations occupations
63,577Production occupations
62,482Construction and extraction occupations
Companies with federal contracts located in this zip code:
TEST MEDICAL SYMPTOMS HOME INC (6633 ASHMAN RD in MARIA STEIN, OH; small business)
$1,700 with Army for Physical Properties Testing and Inspection. Signed on 2004-01-29. Completion date: 2004-02-27.
Top industries in this zip code by the number of employees in 2005:
Wholesale Trade: Farm and Garden Machinery and Equipment Merchant Wholesalers (20-49 employees: 1 establishment)
Other Services (except Public Administration): Other Social Advocacy Organizations (20-49: 1)
Accommodation and Food Services: Full-Service Restaurants (20-49: 1)
Finance and Insurance: Insurance Agencies and Brokerages (10-19: 1, 1-4: 4)
Other Services (except Public Administration): Commercial and Industrial Machinery and Equipment (except Automotive and Electronic) Repair and Maintenance (10-19: 1, 5-9: 1)
Construction: Masonry Contractors (5-9: 3)
Other Services (except Public Administration): Civic and Social Organizations (10-19: 1)
Fatal accident statistics in 2012:
Fatal accident count: 1
Vehicles involved in fatal accidents: 2
Fatal accidents caused by drunken drivers: 0
Fatalities: 1
Persons involved in fatal accidents: 2
Pedestrians involved in fatal accidents: 0
Fatal accident statistics in 2011:
Fatal accident count: 1
Vehicles involved in fatal accidents: 2
Fatal accidents caused by drunken drivers: 0
Fatalities: 1
Persons involved in fatal accidents: 5
Pedestrians involved in fatal accidents: 0
2002 - 2018 National Fire Incident Reporting System (NFIRS) incidents
According to the data from the years 2002 - 2018 the average number of fires per year is 14. The highest number of reported fire incidents - 28 took place in 2008, and the least - 6 in 2002. The data has a rising trend.
When looking into fire subcategories, the most incidents belonged to: Outside Fires (44.7%), and Structure Fires (41.9%).
Fire incident types reported to NFIRS in Zip Code 45860


+$4,184
-$3,706
(% of AGI for various income ranges: -11.1% for AGIs below $10k, -4.6% for AGIs $10k-25k, -0.5% for AGIs $25k-50k, 2.5% for AGIs $50k-75k, 6.9% for AGIs $75k-100k) Nearest zip codes: 45826, 45351, 45388, 45350, 45866, 45883.


 According to the data from the years 2002 - 2018 the average number of fires per year is 14. The highest number of reported fire incidents - 28 took place in 2008, and the least - 6 in 2002. The data has a rising trend.
 When looking into fire subcategories, the most incidents belonged to: Outside Fires (44.7%), and Structure Fires (41.9%).