Estimated zip code population in 2022: 1,882 Zip code population in 2010: 1,753 Zip code population in 2000: 1,689
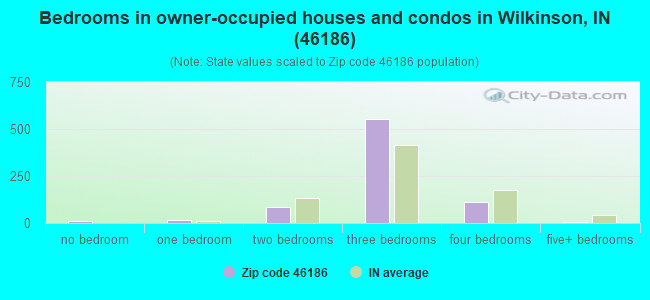
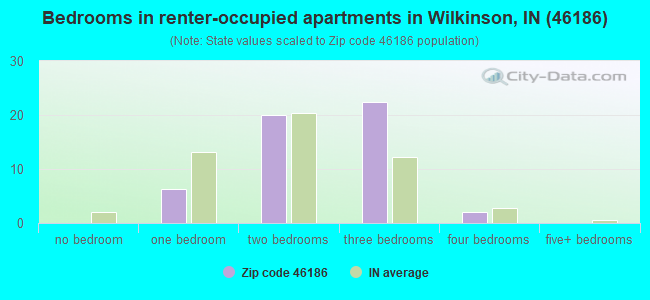
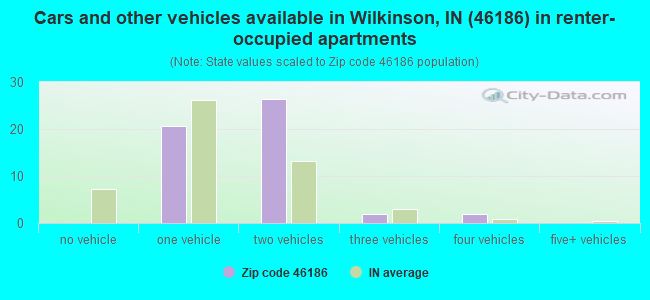
Houses and condos: 866 Renter-occupied apartments: 51
% of renters here:
6%
State:
29%
March 2022 cost of living index in zip code 46186: 86.6 (less than average, U.S. average is 100)
Land area: 28.3 sq. mi. Water area: 0.0 sq. mi.
Population density: 66 people per square mile
(very low).
OSM Map
General Map
Google Map
MSN Map
OSM Map
General Map
Google Map
MSN Map
OSM Map
General Map
Google Map
MSN Map
OSM Map
General Map
Google Map
MSN Map
Please wait while loading the map...
Real estate property taxes paid for housing units in 2022:
This zip code:
0.5% ($1,317)
Indiana:
0.7% ($1,467)
Median real estate property taxes paid for housing units with mortgages in 2022: $1,305 (0.5%) Median real estate property taxes paid for housing units with no mortgage in 2022: $1,449 (0.5%)
Business Search- 14 Million verified businesses
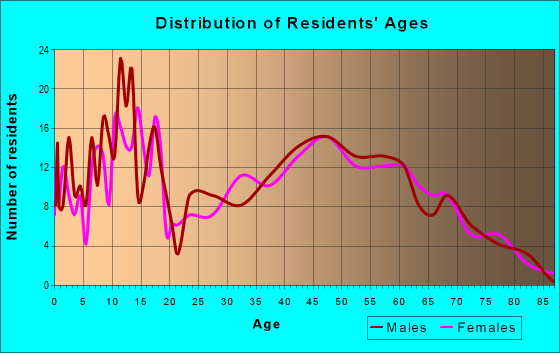
Males: 846
(45.0%)
Females: 1,035
(55.0%)
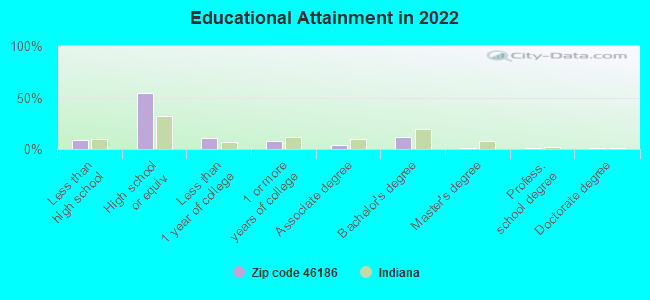
For population 25 years and over in 46186:
High school or higher: 90.4%
Bachelor's degree or higher: 14.8%
Graduate or professional degree: 3.1%
Unemployed: 1.5%
Mean travel time to work (commute): 31.4 minutes
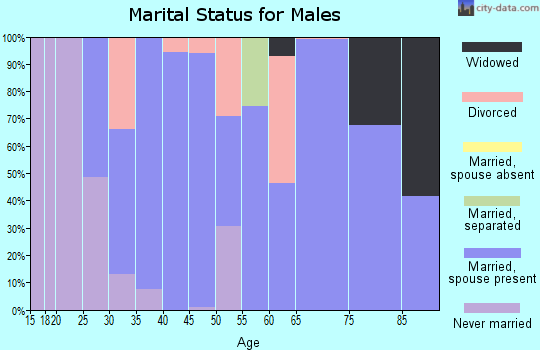
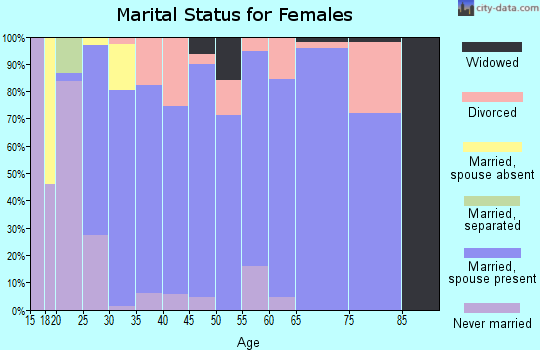
For population 15 years and over in 46186:
Never married: 13.3%
Now married: 72.1%
Separated: 0.5%
Widowed: 9.4%
Divorced: 4.7%
Zip code 46186 compared to state average:
Unemployed percentage below state average.
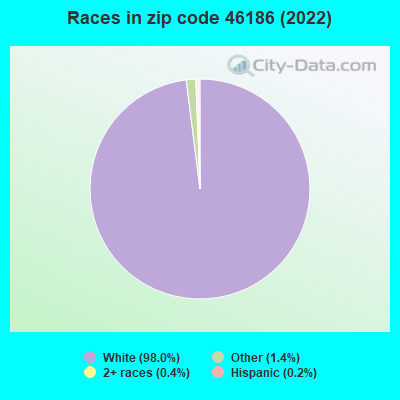
Black race population percentage significantly below state average.
Hispanic race population percentage significantly below state average.
Median age significantly above state average.
Foreign-born population percentage significantly below state average.
Renting percentage significantly below state average.
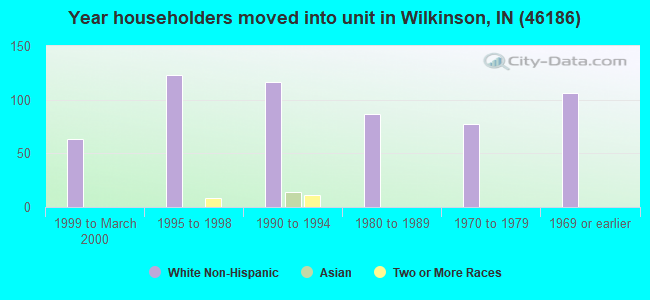
Length of stay since moving in significantly above state average.
Number of college students below state average.
Percentage of population with a bachelor's degree or higher below state average.
Estimated median house/condo value in 2022: $273,720
46186:
$273,720
Indiana:
$208,700
Median resident age:
This zip code:
54.3 years
Indiana median age:
38.2 years
Average household size:
This zip code:
2.3 people
Indiana:
2.4 people
Averages for the 2020 tax year for zip code 46186, filed in 2021:
Average Adjusted Gross Income (AGI) in 2020: $65,683 (Individual Income Tax Returns)
Here:
$65,683
State:
$64,978
Salary/wage: $56,132 (reported on 81.6% of returns)
Here:
$56,132
State:
$55,245
(% of AGI for various income ranges: 1023.0% for AGIs below $25k, 3330.6% for AGIs $25k-50k, 6865.6% for AGIs $50k-75k, 9547.1% for AGIs $75k-100k, 15704.0% for AGIs $100k-200k)
Taxable interest for individuals: $519 (reported on 24.1% of returns)
This zip code:
$519
Indiana:
$1,351
(% of AGI for various income ranges: 9.5% for AGIs below $25k, 17.5% for AGIs $25k-50k, 21.1% for AGIs $50k-75k, 28.6% for AGIs $75k-100k, 23.0% for AGIs $100k-200k)
Ordinary dividends: $2,300 (reported on 14.9% of returns)
Here:
$2,300
State:
$5,827
(% of AGI for various income ranges: 33.5% for AGIs below $25k, 17.5% for AGIs $25k-50k, 104.4% for AGIs $50k-75k, 110.0% for AGIs $100k-200k)
Net capital gain/loss in AGI: +$11,338 (reported on 14.9% of returns)
Here:
+$11,338
State:
+$17,730
(% of AGI for various income ranges: 12.0% for AGIs below $25k, 8.8% for AGIs $25k-50k, 164.4% for AGIs $50k-75k, 1288.0% for AGIs $100k-200k)
Profit/loss from business: +$7,767 (reported on 13.8% of returns)
Here:
+$7,767
State:
+$12,144
(% of AGI for various income ranges: 41.0% for AGIs below $25k, 373.3% for AGIs $50k-75k, 514.0% for AGIs $100k-200k)
Taxable individual retirement arrangement distribution: $12,486 (reported on 8.0% of returns)
46186:
$12,486
Indiana:
$18,302
(% of AGI for various income ranges: 52.5% for AGIs below $25k, 224.4% for AGIs $25k-50k, 585.7% for AGIs $75k-100k)
Total itemized deductions: $27,850 (reported on 4.6% of returns)
Here:
$27,850
State:
$35,601
(% of AGI for various income ranges: 1114.0% for AGIs $100k-200k)
Charity contributions: $12,467 (reported on 3.4% of returns)
Here:
$12,467
State:
$15,596
(% of AGI for various income ranges: 374.0% for AGIs $100k-200k)
Taxes paid: $6,175 (reported on 4.6% of returns)
46186:
$6,175
State:
$7,542
(% of AGI for various income ranges: 247.0% for AGIs $100k-200k)
Earned income credit: $1,700 (reported on 9.2% of returns)
Here:
$1,700
State:
$2,298
(% of AGI for various income ranges: 31.5% for AGIs below $25k, 45.6% for AGIs $25k-50k)
Percentage of individuals using paid preparers for their 2020 taxes: 93.1%
Here:
93%
State:
94%
(% for various income ranges: 92.3% for AGIs below $25k, 90.0% for AGIs $25k-50k, 92.3% for AGIs $50k-75k, 100.0% for AGIs $75k-100k, 93.3% for AGIs $100k-200k, 100.0% for AGIs over 200k)
Averages for the 2012 tax year for zip code 46186, filed in 2013:
Average Adjusted Gross Income (AGI) in 2012: $56,819 (Individual Income Tax Returns)
Here:
$56,819
State:
$52,932
Salary/wage: $46,482 (reported on 85.9% of returns)
Here:
$46,482
State:
$45,173
(% of AGI for various income ranges: 67.4% for AGIs below $25k, 74.8% for AGIs $25k-50k, 79.2% for AGIs $50k-75k, 78.6% for AGIs $75k-100k, 60.1% for AGIs $100k-200k)
Taxable interest for individuals: $1,183 (reported on 29.5% of returns)
This zip code:
$1,183
Indiana:
$1,311
(% of AGI for various income ranges: 0.7% for AGIs below $25k, 1.0% for AGIs $25k-50k, 0.2% for AGIs $50k-75k, 0.3% for AGIs $75k-100k, 0.8% for AGIs $100k-200k)
Ordinary dividends: $6,900 (reported on 14.1% of returns)
Here:
$6,900
State:
$4,690
(% of AGI for various income ranges: 0.7% for AGIs below $25k, 0.7% for AGIs $25k-50k, 0.7% for AGIs $50k-75k, 3.7% for AGIs $100k-200k)
Net capital gain/loss in AGI: +$11,471 (reported on 9.0% of returns)
Here:
+$11,471
State:
+$10,406
(% of AGI for various income ranges: 0.7% for AGIs $50k-75k, 4.4% for AGIs $100k-200k)
Profit/loss from business: +$5,225 (reported on 15.4% of returns)
Here:
+$5,225
State:
+$11,105
(% of AGI for various income ranges: 6.2% for AGIs below $25k, 2.8% for AGIs $25k-50k, 2.6% for AGIs $50k-75k, 0.1% for AGIs $75k-100k)
Taxable individual retirement arrangement distribution: $11,238 (reported on 10.3% of returns)
46186:
$11,238
Indiana:
$13,841
Total itemized deductions: $19,783 (22% of AGI, reported on 30.8% of returns)
Here:
$19,783
State:
$20,913
Here:
22.3% of AGI
State:
18.2% of AGI
(% of AGI for various income ranges: 12.3% for AGIs below $25k, 8.5% for AGIs $25k-50k, 8.2% for AGIs $50k-75k, 10.5% for AGIs $75k-100k, 12.8% for AGIs $100k-200k)
Charity contributions: $3,289 (reported on 23.1% of returns)
Here:
$3,289
State:
$4,697
(% of AGI for various income ranges: 1.6% for AGIs $25k-50k, 0.8% for AGIs $50k-75k, 1.7% for AGIs $75k-100k, 1.5% for AGIs $100k-200k)
Taxes paid: $8,052 (reported on 29.5% of returns)
46186:
$8,052
State:
$7,456
(% of AGI for various income ranges: 2.2% for AGIs below $25k, 2.1% for AGIs $25k-50k, 2.4% for AGIs $50k-75k, 3.0% for AGIs $75k-100k, 6.9% for AGIs $100k-200k)
Earned income credit: $1,855 (reported on 14.1% of returns)
Here:
$1,855
State:
$2,265
(% of AGI for various income ranges: 4.8% for AGIs below $25k, 0.7% for AGIs $25k-50k)
Percentage of individuals using paid preparers for their 2012 taxes: 60.3%
Here:
60%
State:
53%
(% for various income ranges: 56.0% for AGIs below $25k, 60.0% for AGIs $25k-50k, 57.1% for AGIs $50k-75k, 60.0% for AGIs $75k-100k, 77.8% for AGIs $100k-200k)
Averages for the 2004 tax year for zip code 46186, filed in 2005:
Average Adjusted Gross Income (AGI) in 2004: $48,937 (Individual Income Tax Returns)
Here:
$48,937
State:
$44,790
Salary/wage: $42,473 (reported on 89.8% of returns)
Here:
$42,473
State:
$39,615
(% of AGI for various income ranges: 80.2% for AGIs below $10k, 66.9% for AGIs $10k-25k, 77.8% for AGIs $25k-50k, 85.6% for AGIs $50k-75k, 85.9% for AGIs $75k-100k, 67.7% for AGIs over 100k)
Taxable interest for individuals: $923 (reported on 47.1% of returns)
This zip code:
$923
Indiana:
$1,535
(% of AGI for various income ranges: 5.1% for AGIs below $10k, 2.4% for AGIs $10k-25k, 1.4% for AGIs $25k-50k, 0.9% for AGIs $50k-75k, 0.3% for AGIs $75k-100k, 0.4% for AGIs over 100k)
Taxable dividends: $735 (reported on 22.5% of returns)
Here:
$735
State:
$2,998
(% of AGI for various income ranges: 0.5% for AGIs below $10k, 0.9% for AGIs $10k-25k, 0.5% for AGIs $25k-50k, 0.4% for AGIs $50k-75k, 0.2% for AGIs $75k-100k, 0.1% for AGIs over 100k)
Net capital gain/loss: +$1,152 (reported on 13.0% of returns)
Here:
+$1,152
State:
+$8,619
(% of AGI for various income ranges: -2.4% for AGIs below $10k, -0.0% for AGIs $10k-25k, -0.0% for AGIs $25k-50k, 0.0% for AGIs $50k-75k, 0.9% for AGIs $75k-100k, 0.6% for AGIs over 100k)
Profit/loss from business: +$4,492 (reported on 15.7% of returns)
Here:
+$4,492
State:
+$10,071
(% of AGI for various income ranges: -1.4% for AGIs below $10k, 1.4% for AGIs $10k-25k, 2.3% for AGIs $25k-50k, 1.8% for AGIs $50k-75k, 1.7% for AGIs $75k-100k, 0.4% for AGIs over 100k)
Total itemized deductions: $15,104 (18% of AGI, reported on 34.7% of returns)
Here:
$15,104
State:
$17,065
Here:
18.1% of AGI
State:
19.5% of AGI
(% of AGI for various income ranges: 7.5% for AGIs $10k-25k, 8.1% for AGIs $25k-50k, 12.7% for AGIs $50k-75k, 11.6% for AGIs $75k-100k, 11.1% for AGIs over 100k)
Charity contributions deductions: $2,311 (3% of AGI, reported on 27.2% of returns)
Here:
$2,311
State:
$3,550
Here:
2.6% of AGI
State:
3.8% of AGI
(% of AGI for various income ranges: 1.3% for AGIs $25k-50k, 1.3% for AGIs $50k-75k, 1.4% for AGIs $75k-100k, 1.5% for AGIs over 100k)
Total tax: $6,638 (reported on 82.7% of returns)
46186:
$6,638
State:
$6,914
(% of AGI for various income ranges: 2.1% for AGIs below $10k, 4.6% for AGIs $10k-25k, 7.2% for AGIs $25k-50k, 8.4% for AGIs $50k-75k, 10.5% for AGIs $75k-100k, 19.2% for AGIs over 100k)
Earned income credit: $1,531 (reported on 8.0% of returns)
Here:
$1,531
State:
$1,685
Percentage of individuals using paid preparers for their 2004 taxes: 63.4%
Here:
63%
State:
59%
(% for various income ranges: 52.2% for AGIs below $10k, 63.0% for AGIs $10k-25k, 67.0% for AGIs $25k-50k, 67.4% for AGIs $50k-75k, 62.4% for AGIs $75k-100k, 67.2% for AGIs over 100k)
Household received Food Stamps/SNAP in the past 12 months: 4 Household did not receive Food Stamps/SNAP in the past 12 months: 818
Women who had a birth in the past 12 months: 59 (56 now married, 6 unmarried) Women who did not have a birth in the past 12 months: 251 (161 now married, 90 unmarried)
Housing units in zip code 46186 with a mortgage: 487 (18 second mortgage, 19 both second mortgage and home equity loan) Houses without a mortgage: 37
Median monthly owner costs for units with a mortgage: $1,413 Median monthly owner costs for units without a mortgage: $596
Residents with income below the poverty level in 2022:
This zip code:
9.3%
Whole state:
12.6%
Residents with income below 50% of the poverty level in 2022:
This zip code:
6.2%
Whole state:
6.3%
Median number of rooms in houses and condos:
Here:
6.3
State:
6.6
Median number of rooms in apartments:
Here:
6.5
State:
4.3
Notable locations in this zip code not listed on our city pages
Size of family households: 379 2-persons, 77 3-persons, 54 4-persons, 23 5-persons, 6 6-persons, 12 7-or-more-persons
Size of nonfamily households: 262 1-person, 11 2-persons
286 married couples with children.
23 single-parent households (22 men, 1 women).
99.4% of residents of 46186 zip code speak English at home.
0.2% of residents speak Spanish at home (100% well).
0.9% of residents speak other Indo-European language at home (100% very well).
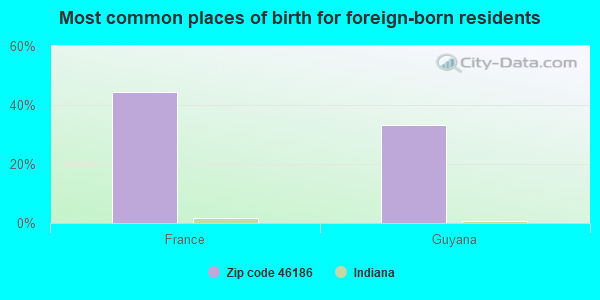
Foreign born population: 9 (0.5%) (45.7% of them are naturalized citizens)
This zip code:
0.5%
Whole state:
6.1%
44%France
33%Guyana
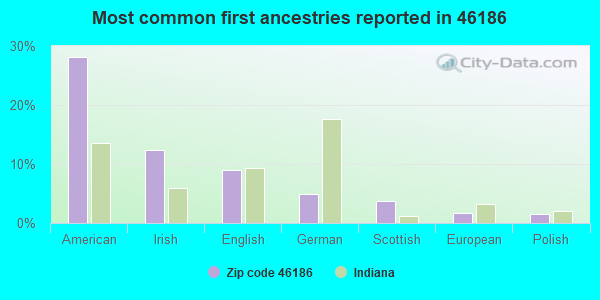
28%American
12%Irish
9%English
5%German
4%Scottish
2%European
2%Polish
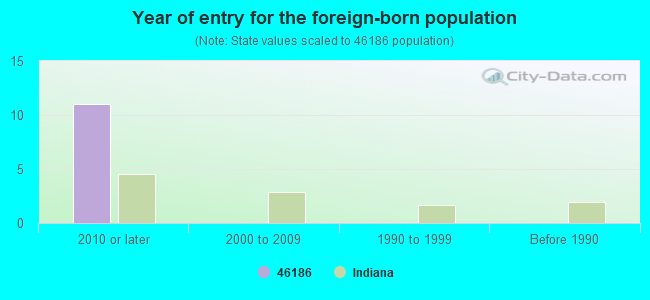
Year of entry for the foreign-born population
112010 or later
02000 to 2009
01990 to 1999
0Before 1990
Facilities with environmental interests located in this zip code:
AG ONE COOP (6250 E SR 234 in WILKINSON, IN)
STATE MASTER (Indiana facility tracking) - CRTK-8990, EPCRA COMPLIANCE ACTIVITY (Tracking inspections of insecticide, fungicide, and rodenticide, and toxic substances)
Housing units lacking complete plumbing facilities: 0.4% Housing units lacking complete kitchen facilities: 0.9%
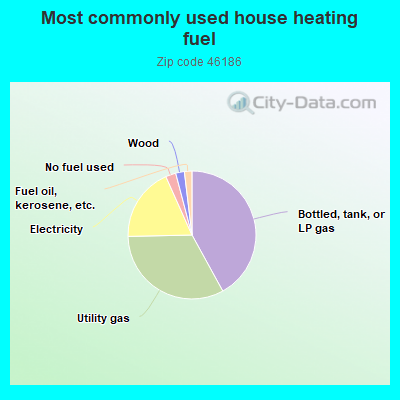
42.1%Bottled, tank, or LP gas
32.7%Utility gas
18.7%Electricity
2.6%No fuel used
2.2%Wood
1.9%Fuel oil, kerosene, etc.
Population in 1990: 2,567.
Place of birth for U.S.-born residents:
This state: 1,317
Northeast: 63
Midwest: 91
South: 374
West: 4
70% of the 46186 zip code residents lived in the same house 5 years ago. Out of people who lived in different houses, 61% lived in this county. Out of people who lived in different counties, 50% lived in Indiana.
96% of the 46186 zip code residents lived in the same house 1 year ago. Out of people who lived in different houses, 61% moved from this county. Out of people who lived in different houses, 47% moved from different county within same state. Out of people who lived in different houses, 2% moved from different state.
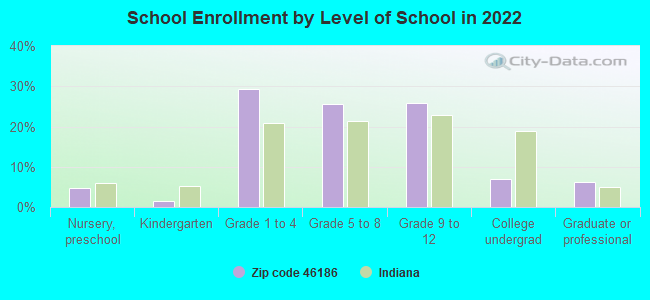
Private vs. public school enrollment:
Students in private schools in grades 1 to 8 (elementary and middle school): 48
Here:
33.2%
Indiana:
14.9%
Students in private schools in grades 9 to 12 (high school):
Here:
1.4%
Indiana:
11.4%
Students in private undergraduate colleges: 3
Here:
20.8%
Indiana:
22.3%
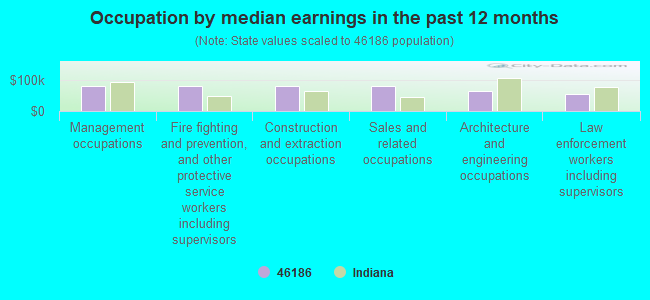
Occupation by median earnings in the past 12 months ($)
82,378Management occupations
80,732Fire fighting and prevention, and other protective service workers including supervisors
80,501Construction and extraction occupations
80,151Sales and related occupations
64,304Architecture and engineering occupations
54,873Law enforcement workers including supervisors
Top industries in this zip code by the number of employees in 2005:
Other Services (except Public Administration): Religious Organizations (10-19 employees: 1 establishment, 1-4 employees: 1 establishment)
Construction: Electrical Contractors (10-19: 1)
Other Services (except Public Administration): Funeral Homes and Funeral Services (10-19: 1)
Wholesale Trade: Farm and Garden Machinery and Equipment Merchant Wholesalers (5-9: 1)
Construction: Site Preparation Contractors (5-9: 1)
Other Services (except Public Administration): Cemeteries and Crematories (1-4: 1)
Administrative and Support and Waste Management and Remediation Services: Credit Bureaus (1-4: 1)
Finance and Insurance: Insurance Agencies and Brokerages (1-4: 1)
Fatal accident statistics in 2010:
Fatal accident count: 2
Vehicles involved in fatal accidents: 2
Fatal accidents caused by drunken drivers: 0
Fatalities: 2
Persons involved in fatal accidents: 2
Pedestrians involved in fatal accidents: 0
Home Mortgage Disclosure Act Aggregated Statistics For Year 2009 (Based on 2 partial tracts)
A) FHA, FSA/RHS & VA Home Purchase Loans
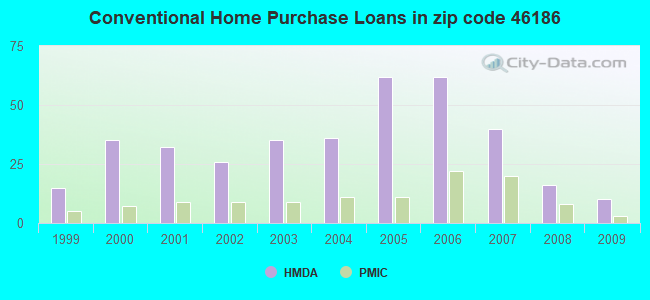
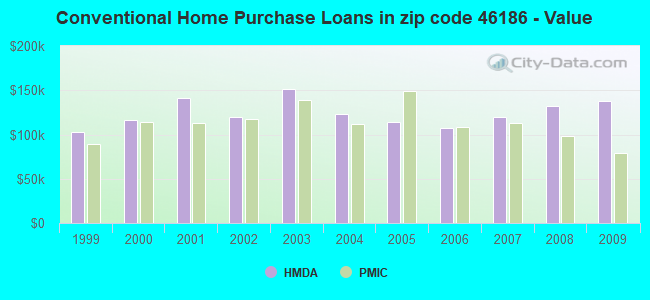
B) Conventional Home Purchase Loans
C) Refinancings
D) Home Improvement Loans
F) Non-occupant Loans on < 5 Family Dwellings (A B C & D)
G) Loans On Manufactured Home Dwelling (A B C & D)
Number
Average Value
Number
Average Value
Number
Average Value
Number
Average Value
Number
Average Value
Number
Average Value
LOANS ORIGINATED
8
$99,871
10
$137,516
63
$139,185
4
$51,588
4
$48,910
4
$62,118
APPLICATIONS APPROVED, NOT ACCEPTED
1
$74,970
1
$151,370
15
$103,435
0
$0
2
$63,905
0
$0
APPLICATIONS DENIED
4
$83,718
6
$129,710
42
$143,225
4
$31,238
0
$0
1
$114,240
APPLICATIONS WITHDRAWN
1
$165,650
1
$74,970
21
$152,796
1
$21,420
1
$25,700
1
$80,680
FILES CLOSED FOR INCOMPLETENESS
0
$0
1
$86,390
3
$155,890
0
$0
0
$0
0
$0
Aggregated Statistics For Year 2008 (Based on 2 partial tracts)
A) FHA, FSA/RHS & VA Home Purchase Loans
B) Conventional Home Purchase Loans
C) Refinancings
D) Home Improvement Loans
F) Non-occupant Loans on < 5 Family Dwellings (A B C & D)
G) Loans On Manufactured Home Dwelling (A B C & D)
Number
Average Value
Number
Average Value
Number
Average Value
Number
Average Value
Number
Average Value
Number
Average Value
LOANS ORIGINATED
4
$111,740
16
$132,134
41
$134,128
9
$88,774
5
$82,252
3
$91,393
APPLICATIONS APPROVED, NOT ACCEPTED
0
$0
3
$97,343
6
$118,523
2
$50,335
1
$115,670
1
$43,550
APPLICATIONS DENIED
4
$97,460
7
$189,414
41
$142,696
7
$25,091
3
$59,977
4
$92,820
APPLICATIONS WITHDRAWN
1
$52,840
4
$139,945
19
$142,048
2
$67,115
2
$76,040
1
$92,820
FILES CLOSED FOR INCOMPLETENESS
1
$91,390
2
$119,240
1
$128,520
0
$0
0
$0
1
$86,390
Aggregated Statistics For Year 2007 (Based on 2 partial tracts)
A) FHA, FSA/RHS & VA Home Purchase Loans
B) Conventional Home Purchase Loans
C) Refinancings
D) Home Improvement Loans
F) Non-occupant Loans on < 5 Family Dwellings (A B C & D)
G) Loans On Manufactured Home Dwelling (A B C & D)
Number
Average Value
Number
Average Value
Number
Average Value
Number
Average Value
Number
Average Value
Number
Average Value
LOANS ORIGINATED
2
$121,380
40
$119,416
57
$129,522
9
$72,511
14
$71,655
1
$79,250
APPLICATIONS APPROVED, NOT ACCEPTED
0
$0
6
$118,523
14
$146,421
4
$175,645
1
$152,800
0
$0
APPLICATIONS DENIED
0
$0
7
$213,791
51
$120,218
6
$25,347
1
$110,670
3
$98,533
APPLICATIONS WITHDRAWN
1
$52,840
6
$209,083
23
$119,890
2
$172,075
3
$78,063
1
$42,840
FILES CLOSED FOR INCOMPLETENESS
0
$0
1
$22,130
6
$202,182
0
$0
0
$0
0
$0
Aggregated Statistics For Year 2006 (Based on 2 partial tracts)
A) FHA, FSA/RHS & VA Home Purchase Loans
B) Conventional Home Purchase Loans
C) Refinancings
D) Home Improvement Loans
F) Non-occupant Loans on < 5 Family Dwellings (A B C & D)
G) Loans On Manufactured Home Dwelling (A B C & D)
Number
Average Value
Number
Average Value
Number
Average Value
Number
Average Value
Number
Average Value
Number
Average Value
LOANS ORIGINATED
26
$139,450
62
$107,296
76
$96,897
14
$45,747
6
$64,973
4
$107,635
APPLICATIONS APPROVED, NOT ACCEPTED
0
$0
6
$131,613
13
$85,021
1
$21,420
1
$77,830
0
$0
APPLICATIONS DENIED
1
$116,380
19
$104,921
52
$156,229
13
$62,228
1
$17,850
5
$76,398
APPLICATIONS WITHDRAWN
0
$0
2
$170,290
15
$128,853
1
$21,420
1
$54,260
0
$0
FILES CLOSED FOR INCOMPLETENESS
1
$177,070
1
$34,270
9
$149,306
1
$76,400
0
$0
1
$119,240
Aggregated Statistics For Year 2005 (Based on 2 partial tracts)
A) FHA, FSA/RHS & VA Home Purchase Loans
B) Conventional Home Purchase Loans
C) Refinancings
D) Home Improvement Loans
F) Non-occupant Loans on < 5 Family Dwellings (A B C & D)
G) Loans On Manufactured Home Dwelling (A B C & D)
Number
Average Value
Number
Average Value
Number
Average Value
Number
Average Value
Number
Average Value
Number
Average Value
LOANS ORIGINATED
10
$120,737
62
$114,286
87
$115,627
16
$92,776
4
$69,615
4
$48,195
APPLICATIONS APPROVED, NOT ACCEPTED
1
$47,840
11
$88,016
16
$115,043
1
$58,550
0
$0
0
$0
APPLICATIONS DENIED
1
$54,980
16
$72,337
70
$117,963
6
$31,058
3
$53,313
6
$98,175
APPLICATIONS WITHDRAWN
0
$0
1
$237,050
31
$131,814
4
$178,322
1
$43,550
1
$65,690
FILES CLOSED FOR INCOMPLETENESS
1
$60,690
4
$83,002
13
$125,609
1
$371,280
0
$0
1
$34,270
Aggregated Statistics For Year 2004 (Based on 2 partial tracts)
A) FHA, FSA/RHS & VA Home Purchase Loans
B) Conventional Home Purchase Loans
C) Refinancings
D) Home Improvement Loans
F) Non-occupant Loans on < 5 Family Dwellings (A B C & D)
G) Loans On Manufactured Home Dwelling (A B C & D)
Number
Average Value
Number
Average Value
Number
Average Value
Number
Average Value
Number
Average Value
Number
Average Value
LOANS ORIGINATED
9
$89,647
36
$123,502
114
$115,944
14
$32,130
5
$83,680
4
$74,612
APPLICATIONS APPROVED, NOT ACCEPTED
3
$96,153
4
$150,655
15
$114,954
0
$0
0
$0
1
$77,830
APPLICATIONS DENIED
1
$88,540
10
$81,182
50
$112,712
9
$44,744
1
$385,560
0
$0
APPLICATIONS WITHDRAWN
1
$120,670
1
$27,850
38
$123,391
1
$7,140
1
$62,830
1
$73,540
FILES CLOSED FOR INCOMPLETENESS
0
$0
1
$189,210
11
$150,784
0
$0
0
$0
0
$0
Aggregated Statistics For Year 2003 (Based on 2 partial tracts)
A) FHA, FSA/RHS & VA Home Purchase Loans
B) Conventional Home Purchase Loans
C) Refinancings
D) Home Improvement Loans
F) Non-occupant Loans on < 5 Family Dwellings (A B C & D)
Number
Average Value
Number
Average Value
Number
Average Value
Number
Average Value
Number
Average Value
LOANS ORIGINATED
9
$123,681
35
$151,021
201
$114,432
8
$28,739
5
$51,266
APPLICATIONS APPROVED, NOT ACCEPTED
0
$0
6
$109,242
25
$93,248
1
$17,140
1
$24,990
APPLICATIONS DENIED
1
$118,520
7
$99,960
66
$112,552
4
$9,995
0
$0
APPLICATIONS WITHDRAWN
1
$152,080
4
$101,210
31
$115,023
2
$53,905
1
$69,970
FILES CLOSED FOR INCOMPLETENESS
1
$94,960
1
$221,340
11
$140,658
0
$0
0
$0
Aggregated Statistics For Year 2002 (Based on 2 partial tracts)
A) FHA, FSA/RHS & VA Home Purchase Loans
B) Conventional Home Purchase Loans
C) Refinancings
D) Home Improvement Loans
F) Non-occupant Loans on < 5 Family Dwellings (A B C & D)
Number
Average Value
Number
Average Value
Number
Average Value
Number
Average Value
Number
Average Value
LOANS ORIGINATED
13
$110,999
26
$120,117
149
$99,553
6
$15,470
4
$56,585
APPLICATIONS APPROVED, NOT ACCEPTED
1
$69,970
6
$76,517
20
$84,680
1
$67,830
0
$0
APPLICATIONS DENIED
1
$88,540
7
$112,609
54
$103,001
6
$35,105
1
$42,840
APPLICATIONS WITHDRAWN
1
$99,960
1
$264,180
24
$84,728
0
$0
1
$84,250
FILES CLOSED FOR INCOMPLETENESS
0
$0
1
$88,540
14
$88,332
0
$0
0
$0
Aggregated Statistics For Year 2001 (Based on 2 partial tracts)
A) FHA, FSA/RHS & VA Home Purchase Loans
B) Conventional Home Purchase Loans
C) Refinancings
D) Home Improvement Loans
F) Non-occupant Loans on < 5 Family Dwellings (A B C & D)
Number
Average Value
Number
Average Value
Number
Average Value
Number
Average Value
Number
Average Value
LOANS ORIGINATED
9
$120,349
32
$141,618
104
$91,509
16
$22,759
6
$68,068
APPLICATIONS APPROVED, NOT ACCEPTED
0
$0
2
$250,615
16
$81,753
0
$0
0
$0
APPLICATIONS DENIED
1
$84,250
11
$92,106
54
$84,794
14
$14,535
1
$64,970
APPLICATIONS WITHDRAWN
1
$187,780
4
$88,892
33
$97,558
2
$14,995
1
$128,520
FILES CLOSED FOR INCOMPLETENESS
0
$0
0
$0
4
$89,608
1
$13,570
0
$0
Aggregated Statistics For Year 2000 (Based on 2 partial tracts)
A) FHA, FSA/RHS & VA Home Purchase Loans
B) Conventional Home Purchase Loans
C) Refinancings
D) Home Improvement Loans
F) Non-occupant Loans on < 5 Family Dwellings (A B C & D)
Number
Average Value
Number
Average Value
Number
Average Value
Number
Average Value
Number
Average Value
LOANS ORIGINATED
11
$91,457
35
$116,402
51
$60,158
13
$16,587
3
$69,257
APPLICATIONS APPROVED, NOT ACCEPTED
1
$40,700
4
$60,690
12
$91,273
5
$17,992
0
$0
APPLICATIONS DENIED
2
$86,035
13
$41,082
41
$73,594
12
$19,338
1
$45,700
APPLICATIONS WITHDRAWN
1
$37,840
1
$276,320
6
$80,087
0
$0
1
$59,980
FILES CLOSED FOR INCOMPLETENESS
0
$0
1
$94,960
6
$94,367
0
$0
0
$0
Aggregated Statistics For Year 1999 (Based on 1 partial tract)
A) FHA, FSA/RHS & VA Home Purchase Loans
B) Conventional Home Purchase Loans
C) Refinancings
D) Home Improvement Loans
F) Non-occupant Loans on < 5 Family Dwellings (A B C & D)
Detailed PMIC statistics for the following Tracts:4101.00
2002 - 2017 National Fire Incident Reporting System (NFIRS) incidents
According to the data from the years 2002 - 2017 the average number of fire incidents per year is 9. The highest number of reported fire incidents - 40 took place in 2009, and the least - 1 in 2003. The data has a constant trend.
When looking into fire subcategories, the most reports belonged to: Structure Fires (44.9%), and Outside Fires (35.5%).
Fire incident types reported to NFIRS in Zip Code 46186
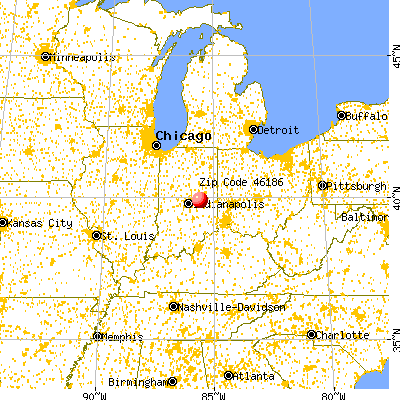


 Nearest zip codes: 46117, 46056, 47384, 47351, 46064, 46148.


 According to the data from the years 2002 - 2017 the average number of fire incidents per year is 9. The highest number of reported fire incidents - 40 took place in 2009, and the least - 1 in 2003. The data has a constant trend.
 When looking into fire subcategories, the most reports belonged to: Structure Fires (44.9%), and Outside Fires (35.5%).