Estimated zip code population in 2022: 1,211 Zip code population in 2010: 1,200 Zip code population in 2000: 799
Houses and condos: 552 Renter-occupied apartments: 17
% of renters here:
3%
State:
29%
March 2022 cost of living index in zip code 47456: 85.5 (less than average, U.S. average is 100)
Land area: 26.3 sq. mi. Water area: 0.2 sq. mi.
Population density: 46 people per square mile
(very low).
OSM Map
General Map
Google Map
MSN Map
OSM Map
General Map
Google Map
MSN Map
OSM Map
General Map
Google Map
MSN Map
OSM Map
General Map
Google Map
MSN Map
Please wait while loading the map...
Real estate property taxes paid for housing units in 2022:
This zip code:
0.6% ($1,195)
Indiana:
0.7% ($1,467)
Median real estate property taxes paid for housing units with mortgages in 2022: $1,293 (0.6%) Median real estate property taxes paid for housing units with no mortgage in 2022: $1,051 (0.6%)
Business Search- 14 Million verified businesses
Males: 615
(50.8%)
Females: 595
(49.2%)
For population 25 years and over in 47456:
High school or higher: 86.0%
Bachelor's degree or higher: 9.3%
Graduate or professional degree: 2.9%
Unemployed: 1.3%
Mean travel time to work (commute): 47.9 minutes
For population 15 years and over in 47456:
Never married: 21.1%
Now married: 54.5%
Separated: 2.1%
Widowed: 2.1%
Divorced: 20.2%
Zip code 47456 compared to state average:
Unemployed percentage below state average.
Black race population percentage significantly below state average.
Hispanic race population percentage significantly below state average.
Median age above state average.
Foreign-born population percentage significantly below state average.
Renting percentage significantly below state average.
Length of stay since moving in significantly above state average.
Number of college students significantly below state average.
Percentage of population with a bachelor's degree or higher significantly below state average.
Estimated median house/condo value in 2022: $198,356
47456:
$198,356
Indiana:
$208,700
According to our research of Indiana and other state lists, there was 1 registered sex offender living in 47456 zip code as of May 29, 2024. The ratio of all residents to sex offenders in zip code 47456 is 1,383 to 1. The ratio of registered sex offenders to all residents in this zip code is much lower than the state average.
Median resident age:
This zip code:
45.8 years
Indiana median age:
38.2 years
Average household size:
This zip code:
2.2 people
Indiana:
2.4 people
Averages for the 2020 tax year for zip code 47456, filed in 2021:
Average Adjusted Gross Income (AGI) in 2020: $57,847 (Individual Income Tax Returns)
Here:
$57,847
State:
$64,978
Salary/wage: $53,208 (reported on 83.1% of returns)
Here:
$53,208
State:
$55,245
(% of AGI for various income ranges: 915.8% for AGIs below $25k, 3695.0% for AGIs $25k-50k, 7475.0% for AGIs $50k-75k, 10050.0% for AGIs $75k-100k, 15755.7% for AGIs $100k-200k)
Taxable interest for individuals: $475 (reported on 27.1% of returns)
This zip code:
$475
Indiana:
$1,351
(% of AGI for various income ranges: 5.8% for AGIs below $25k, 9.2% for AGIs $25k-50k, 18.3% for AGIs $50k-75k, 34.0% for AGIs $75k-100k, 42.9% for AGIs $100k-200k)
Ordinary dividends: $2,786 (reported on 11.9% of returns)
Here:
$2,786
State:
$5,827
(% of AGI for various income ranges: 21.7% for AGIs $25k-50k, 241.4% for AGIs $100k-200k)
Net capital gain/loss in AGI: +$3,317 (reported on 10.2% of returns)
Here:
+$3,317
State:
+$17,730
(% of AGI for various income ranges: 171.7% for AGIs $50k-75k, 137.1% for AGIs $100k-200k)
Profit/loss from business: +$7,586 (reported on 11.9% of returns)
Here:
+$7,586
State:
+$12,144
(% of AGI for various income ranges: 249.2% for AGIs below $25k, 187.5% for AGIs $25k-50k, 14.0% for AGIs $75k-100k)
Taxable individual retirement arrangement distribution: $11,150 (reported on 3.4% of returns)
47456:
$11,150
Indiana:
$18,302
(% of AGI for various income ranges: 185.8% for AGIs $25k-50k)
Total itemized deductions: $25,400 (reported on 3.4% of returns)
Here:
$25,400
State:
$35,601
(% of AGI for various income ranges: 423.3% for AGIs $25k-50k)
Taxes paid: $8,600 (reported on 3.4% of returns)
47456:
$8,600
State:
$7,542
(% of AGI for various income ranges: 143.3% for AGIs $25k-50k)
Earned income credit: $2,100 (reported on 13.6% of returns)
Here:
$2,100
State:
$2,298
(% of AGI for various income ranges: 88.3% for AGIs below $25k, 51.7% for AGIs $25k-50k)
Percentage of individuals using paid preparers for their 2020 taxes: 96.6%
Here:
97%
State:
94%
(% for various income ranges: 94.4% for AGIs below $25k, 93.3% for AGIs $25k-50k, 100.0% for AGIs $50k-75k, 100.0% for AGIs $75k-100k, 100.0% for AGIs $100k-200k)
Averages for the 2012 tax year for zip code 47456, filed in 2013:
Average Adjusted Gross Income (AGI) in 2012: $42,167 (Individual Income Tax Returns)
Here:
$42,167
State:
$52,932
Salary/wage: $38,606 (reported on 81.0% of returns)
Here:
$38,606
State:
$45,173
(% of AGI for various income ranges: 69.3% for AGIs below $25k, 74.8% for AGIs $25k-50k, 73.6% for AGIs $50k-75k, 75.4% for AGIs $75k-100k, 75.5% for AGIs $100k-200k)
Taxable interest for individuals: $714 (reported on 24.1% of returns)
This zip code:
$714
Indiana:
$1,311
(% of AGI for various income ranges: 1.9% for AGIs below $25k, 0.2% for AGIs $25k-50k, 0.2% for AGIs $50k-75k, 0.4% for AGIs $75k-100k)
Ordinary dividends: $1,440 (reported on 8.6% of returns)
Here:
$1,440
State:
$4,690
Net capital gain/loss in AGI: +$3,250 (reported on 6.9% of returns)
Here:
+$3,250
State:
+$10,406
Profit/loss from business: +$5,471 (reported on 12.1% of returns)
Here:
+$5,471
State:
+$11,105
(% of AGI for various income ranges: 3.4% for AGIs below $25k, 4.4% for AGIs $25k-50k, 1.3% for AGIs $50k-75k)
Taxable individual retirement arrangement distribution: $9,120 (reported on 8.6% of returns)
47456:
$9,120
Indiana:
$13,841
Total itemized deductions: $16,508 (21% of AGI, reported on 22.4% of returns)
Here:
$16,508
State:
$20,913
Here:
21.1% of AGI
State:
18.2% of AGI
(% of AGI for various income ranges: 11.6% for AGIs below $25k, 9.2% for AGIs $50k-75k, 12.0% for AGIs $75k-100k, 11.5% for AGIs $100k-200k)
Charity contributions: $2,067 (reported on 15.5% of returns)
Here:
$2,067
State:
$4,697
(% of AGI for various income ranges: 0.9% for AGIs $25k-50k, 1.0% for AGIs $75k-100k, 1.5% for AGIs $100k-200k)
Taxes paid: $5,754 (reported on 22.4% of returns)
47456:
$5,754
State:
$7,456
(% of AGI for various income ranges: 3.2% for AGIs below $25k, 2.3% for AGIs $50k-75k, 4.3% for AGIs $75k-100k, 5.1% for AGIs $100k-200k)
Earned income credit: $2,318 (reported on 19.0% of returns)
Here:
$2,318
State:
$2,265
(% of AGI for various income ranges: 7.4% for AGIs below $25k, 1.1% for AGIs $25k-50k)
Percentage of individuals using paid preparers for their 2012 taxes: 58.6%
Here:
59%
State:
53%
(% for various income ranges: 58.3% for AGIs below $25k, 57.1% for AGIs $25k-50k, 55.6% for AGIs $50k-75k, 66.7% for AGIs $75k-100k, 60.0% for AGIs $100k-200k)
Averages for the 2004 tax year for zip code 47456, filed in 2005:
Average Adjusted Gross Income (AGI) in 2004: $37,627 (Individual Income Tax Returns)
Here:
$37,627
State:
$44,790
Salary/wage: $35,703 (reported on 86.9% of returns)
Here:
$35,703
State:
$39,615
(% of AGI for various income ranges: 113.6% for AGIs below $10k, 71.6% for AGIs $10k-25k, 81.3% for AGIs $25k-50k, 86.0% for AGIs $50k-75k, 94.3% for AGIs $75k-100k, 67.6% for AGIs over 100k)
Taxable interest for individuals: $1,027 (reported on 34.2% of returns)
This zip code:
$1,027
Indiana:
$1,535
(% of AGI for various income ranges: 5.9% for AGIs below $10k, 2.1% for AGIs $10k-25k, 1.1% for AGIs $25k-50k, 0.8% for AGIs $50k-75k, 0.4% for AGIs $75k-100k, 0.1% for AGIs over 100k)
Taxable dividends: $627 (reported on 12.2% of returns)
Here:
$627
State:
$2,998
(% of AGI for various income ranges: 4.2% for AGIs below $10k, 0.2% for AGIs $25k-50k, 0.1% for AGIs $50k-75k, 0.3% for AGIs $75k-100k)
Net capital gain/loss: +$1,720 (reported on 9.1% of returns)
Here:
+$1,720
State:
+$8,619
Profit/loss from business: +$3,424 (reported on 12.0% of returns)
Here:
+$3,424
State:
+$10,071
(% of AGI for various income ranges: 13.1% for AGIs below $10k, 5.8% for AGIs $10k-25k, 0.7% for AGIs $25k-50k, 0.3% for AGIs $50k-75k)
Total itemized deductions: $15,658 (24% of AGI, reported on 29.3% of returns)
Here:
$15,658
State:
$17,065
Here:
23.6% of AGI
State:
19.5% of AGI
(% of AGI for various income ranges: 10.5% for AGIs $10k-25k, 9.3% for AGIs $25k-50k, 14.9% for AGIs $50k-75k, 13.1% for AGIs $75k-100k, 13.6% for AGIs over 100k)
Charity contributions deductions: $2,143 (3% of AGI, reported on 20.4% of returns)
Here:
$2,143
State:
$3,550
Here:
3.3% of AGI
State:
3.8% of AGI
(% of AGI for various income ranges: 3.9% for AGIs below $10k, 0.9% for AGIs $25k-50k, 1.6% for AGIs $50k-75k, 0.8% for AGIs $75k-100k, 1.4% for AGIs over 100k)
Total tax: $4,215 (reported on 72.7% of returns)
47456:
$4,215
State:
$6,914
(% of AGI for various income ranges: 2.2% for AGIs below $10k, 4.0% for AGIs $10k-25k, 5.8% for AGIs $25k-50k, 8.6% for AGIs $50k-75k, 10.3% for AGIs $75k-100k, 12.0% for AGIs over 100k)
Earned income credit: $1,263 (reported on 17.3% of returns)
Here:
$1,263
State:
$1,685
Percentage of individuals using paid preparers for their 2004 taxes: 58.9%
Here:
59%
State:
59%
(% for various income ranges: 49.3% for AGIs below $10k, 56.5% for AGIs $10k-25k, 65.6% for AGIs $25k-50k, 63.5% for AGIs $50k-75k, 88.1% for AGIs $75k-100k)
Household received Food Stamps/SNAP in the past 12 months: 40 Household did not receive Food Stamps/SNAP in the past 12 months: 505
Women who had a birth in the past 12 months: 25 (0 now married, 21 unmarried) Women who did not have a birth in the past 12 months: 236 (130 now married, 106 unmarried)
Housing units in zip code 47456 with a mortgage: 299 (40 second mortgage, 26 both second mortgage and home equity loan) Median monthly owner costs for units with a mortgage: $1,331 Median monthly owner costs for units without a mortgage: $426
Residents with income below the poverty level in 2022:
This zip code:
12.2%
Whole state:
12.6%
Residents with income below 50% of the poverty level in 2022:
This zip code:
4.8%
Whole state:
6.3%
Median number of rooms in houses and condos:
Here:
6.6
State:
6.6
Median number of rooms in apartments:
Here:
5.0
State:
4.3
Notable locations in this zip code not listed on our city pages
Size of family households: 199 2-persons, 77 3-persons, 58 4-persons, 15 5-persons, 5 6-persons
Size of nonfamily households: 141 1-person, 48 2-persons
132 married couples with children.
45 single-parent households (10 men, 35 women).
99.5% of residents of 47456 zip code speak English at home.
Foreign born population: 0 (0.0%)
:
0.0%
Whole state:
6.1%
23%German
21%English
15%Irish
14%American
5%Norwegian
3%Italian
Facilities with environmental interests located in this zip code:
MIDLAND CO OP OF QUINCY (2151 QUINCY RD in QUINCY, IN)
STATE MASTER (Indiana facility tracking) - CRTK-8099, EPCRA COMPLIANCE ACTIVITY (Tracking inspections of insecticide, fungicide, and rodenticide, and toxic substances) (Resource Conservation and Recovery Act (tracking hazardous waste)) Alternative names: BORDEN CHEMICAL SMITH DOUGLAS DIV, QUAD COUNTY FARM SUPPLY
Housing units lacking complete plumbing facilities: 2.0% Housing units lacking complete kitchen facilities: 2.1%
36.7%Electricity
33.5%Bottled, tank, or LP gas
25.7%Wood
4.5%Utility gas
Population in 1990: 2,959.
Place of birth for U.S.-born residents:
This state: 903
Northeast: 22
Midwest: 120
South: 91
West: 67
57% of the 47456 zip code residents lived in the same house 5 years ago. Out of people who lived in different houses, 34% lived in this county. Out of people who lived in different counties, 50% lived in Indiana.
91% of the 47456 zip code residents lived in the same house 1 year ago. Out of people who lived in different houses, 6% moved from this county. Out of people who lived in different houses, 44% moved from different county within same state. Out of people who lived in different houses, 53% moved from different state.
Private vs. public school enrollment:
Students in private schools in grades 1 to 8 (elementary and middle school): 15
Here:
25.2%
Indiana:
14.9%
Students in private schools in grades 9 to 12 (high school):
Here:
0.0%
Indiana:
11.4%
Occupation by median earnings in the past 12 months ($)
108,523Transportation occupations
81,092Installation, maintenance, and repair occupations
65,065Sales and related occupations
50,566Management occupations
49,069Office and administrative support occupations
47,758Construction and extraction occupations
Top industries in this zip code by the number of employees in 2005:
Other Services (except Public Administration): General Automotive Repair (10-19 employees: 1 establishment)
Construction: Site Preparation Contractors (10-19: 1)
Construction: Masonry Contractors (10-19: 1)
Administrative and Support and Waste Management and Remediation Services: Landscaping Services (1-4: 1)
2002 - 2018 National Fire Incident Reporting System (NFIRS) incidents
According to the data from the years 2002 - 2018 the average number of fire incidents per year is 7. The highest number of reported fire incidents - 17 took place in 2010, and the least - 1 in 2015. The data has an increasing trend.
When looking into fire subcategories, the most reports belonged to: Structure Fires (43.4%), and Outside Fires (35.4%).
Fire incident types reported to NFIRS in Zip Code 47456

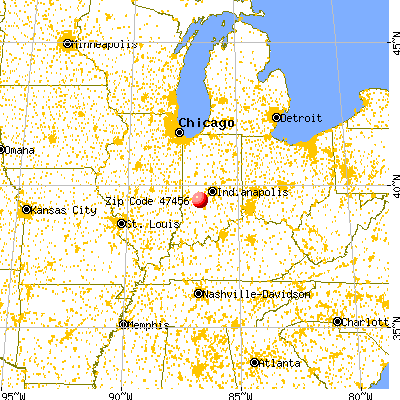


 Nearest zip codes: 46125, 46120, 46166, 47433, 46180, 47464.


 According to the data from the years 2002 - 2018 the average number of fire incidents per year is 7. The highest number of reported fire incidents - 17 took place in 2010, and the least - 1 in 2015. The data has an increasing trend.
 When looking into fire subcategories, the most reports belonged to: Structure Fires (43.4%), and Outside Fires (35.4%).