Estimated zip code population in 2022: 1,317 Zip code population in 2010: 1,432 Zip code population in 2000: 1,377
Houses and condos: 629 Renter-occupied apartments: 130
% of renters here:
24%
State:
29%
March 2022 cost of living index in zip code 47557: 86.2 (less than average, U.S. average is 100)
Land area: 54.6 sq. mi. Water area: 1.1 sq. mi.
Population density: 24 people per square mile
(very low).
OSM Map
General Map
Google Map
MSN Map
OSM Map
General Map
Google Map
MSN Map
OSM Map
General Map
Google Map
MSN Map
OSM Map
General Map
Google Map
MSN Map
Please wait while loading the map...
Real estate property taxes paid for housing units in 2022:
This zip code:
0.5% ($734)
Indiana:
0.7% ($1,467)
Median real estate property taxes paid for housing units with mortgages in 2022: $792 (0.5%) Median real estate property taxes paid for housing units with no mortgage in 2022: $701 (0.5%)
Business Search- 14 Million verified businesses
Males: 618
(47.0%)
Females: 698
(53.0%)
For population 25 years and over in 47557:
High school or higher: 91.4%
Bachelor's degree or higher: 10.3%
Graduate or professional degree: 2.3%
Mean travel time to work (commute): 24.7 minutes
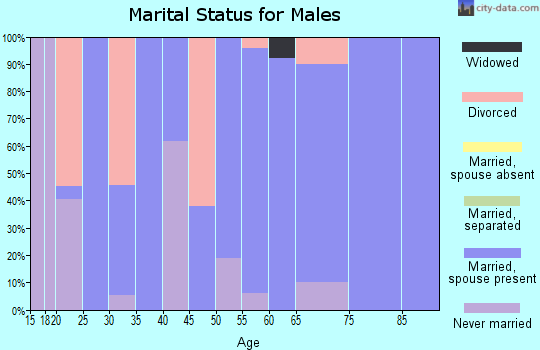
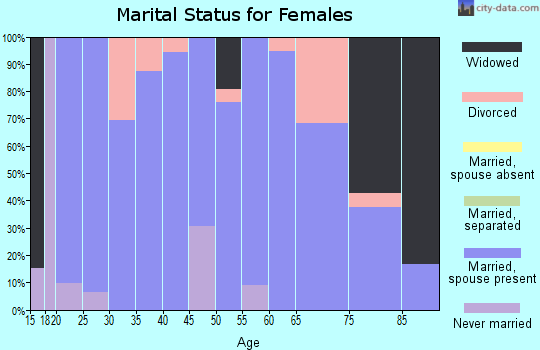
For population 15 years and over in 47557:
Never married: 16.2%
Now married: 63.2%
Separated: 0.8%
Widowed: 7.3%
Divorced: 12.5%
Zip code 47557 compared to state average:
Unemployed percentage significantly below state average.
Black race population percentage significantly below state average.
Hispanic race population percentage significantly below state average.
Foreign-born population percentage significantly below state average.
Length of stay since moving in significantly above state average.
Number of college students below state average.
Percentage of population with a bachelor's degree or higher significantly below state average.
Estimated median house/condo value in 2022: $159,594
47557:
$159,594
Indiana:
$208,700
Median resident age:
This zip code:
37.6 years
Indiana median age:
38.2 years
Average household size:
This zip code:
2.4 people
Indiana:
2.4 people
Averages for the 2020 tax year for zip code 47557, filed in 2021:
Average Adjusted Gross Income (AGI) in 2020: $63,737 (Individual Income Tax Returns)
Here:
$63,737
State:
$64,978
Salary/wage: $53,965 (reported on 82.5% of returns)
Here:
$53,965
State:
$55,245
(% of AGI for various income ranges: 969.3% for AGIs below $25k, 3620.0% for AGIs $25k-50k, 6997.1% for AGIs $50k-75k, 8375.0% for AGIs $75k-100k, 18285.7% for AGIs $100k-200k)
Taxable interest for individuals: $360 (reported on 31.7% of returns)
This zip code:
$360
Indiana:
$1,351
(% of AGI for various income ranges: 2.9% for AGIs below $25k, 24.5% for AGIs $25k-50k, 24.3% for AGIs $50k-75k, 18.3% for AGIs $75k-100k, 18.6% for AGIs $100k-200k)
Ordinary dividends: $2,760 (reported on 15.9% of returns)
Here:
$2,760
State:
$5,827
(% of AGI for various income ranges: 49.3% for AGIs below $25k, 145.7% for AGIs $50k-75k, 150.0% for AGIs $100k-200k)
Net capital gain/loss in AGI: +$15,060 (reported on 15.9% of returns)
Here:
+$15,060
State:
+$17,730
(% of AGI for various income ranges: 22.9% for AGIs below $25k, 82.9% for AGIs $50k-75k, 2022.9% for AGIs $100k-200k)
Profit/loss from business: +$16,886 (reported on 11.1% of returns)
Here:
+$16,886
State:
+$12,144
(% of AGI for various income ranges: 500.9% for AGIs $25k-50k, 1051.7% for AGIs $75k-100k)
Taxable individual retirement arrangement distribution: $13,914 (reported on 11.1% of returns)
47557:
$13,914
Indiana:
$18,302
(% of AGI for various income ranges: 345.5% for AGIs $25k-50k, 990.0% for AGIs $75k-100k)
Earned income credit: $1,900 (reported on 14.3% of returns)
Here:
$1,900
State:
$2,298
(% of AGI for various income ranges: 74.3% for AGIs below $25k, 60.9% for AGIs $25k-50k)
Percentage of individuals using paid preparers for their 2020 taxes: 96.8%
Here:
97%
State:
94%
(% for various income ranges: 94.4% for AGIs below $25k, 100.0% for AGIs $25k-50k, 100.0% for AGIs $50k-75k, 100.0% for AGIs $75k-100k, 91.7% for AGIs $100k-200k)
Averages for the 2012 tax year for zip code 47557, filed in 2013:
Average Adjusted Gross Income (AGI) in 2012: $55,985 (Individual Income Tax Returns)
Here:
$55,985
State:
$52,932
Salary/wage: $51,945 (reported on 81.7% of returns)
Here:
$51,945
State:
$45,173
(% of AGI for various income ranges: 69.3% for AGIs below $25k, 78.0% for AGIs $25k-50k, 81.4% for AGIs $50k-75k, 81.6% for AGIs $75k-100k, 69.9% for AGIs $100k-200k)
Taxable interest for individuals: $800 (reported on 31.7% of returns)
This zip code:
$800
Indiana:
$1,311
(% of AGI for various income ranges: 0.9% for AGIs below $25k, 0.6% for AGIs $25k-50k, 0.3% for AGIs $50k-75k, 0.2% for AGIs $75k-100k, 0.5% for AGIs $100k-200k)
Ordinary dividends: $1,610 (reported on 16.7% of returns)
Here:
$1,610
State:
$4,690
(% of AGI for various income ranges: 2.2% for AGIs below $25k, 0.5% for AGIs $50k-75k, 0.6% for AGIs $100k-200k)
Net capital gain/loss in AGI: +$4,689 (reported on 15.0% of returns)
Here:
+$4,689
State:
+$10,406
(% of AGI for various income ranges: 0.2% for AGIs $50k-75k, 3.3% for AGIs $100k-200k)
Profit/loss from business: +$5,130 (reported on 16.7% of returns)
Here:
+$5,130
State:
+$11,105
(% of AGI for various income ranges: 6.8% for AGIs below $25k, 4.4% for AGIs $25k-50k, 1.9% for AGIs $75k-100k)
Taxable individual retirement arrangement distribution: $6,133 (reported on 10.0% of returns)
47557:
$6,133
Indiana:
$13,841
Total itemized deductions: $19,955 (17% of AGI, reported on 18.3% of returns)
Here:
$19,955
State:
$20,913
Here:
17.2% of AGI
State:
18.2% of AGI
(% of AGI for various income ranges: 10.1% for AGIs below $25k, 5.1% for AGIs $50k-75k, 6.2% for AGIs $75k-100k, 9.4% for AGIs $100k-200k)
Charity contributions: $5,488 (reported on 13.3% of returns)
Here:
$5,488
State:
$4,697
Taxes paid: $7,091 (reported on 18.3% of returns)
47557:
$7,091
State:
$7,456
(% of AGI for various income ranges: 2.1% for AGIs below $25k, 1.2% for AGIs $50k-75k, 1.6% for AGIs $75k-100k, 4.3% for AGIs $100k-200k)
Earned income credit: $2,125 (reported on 13.3% of returns)
Here:
$2,125
State:
$2,265
(% of AGI for various income ranges: 5.2% for AGIs below $25k, 1.0% for AGIs $25k-50k)
Percentage of individuals using paid preparers for their 2012 taxes: 66.7%
Here:
67%
State:
53%
(% for various income ranges: 55.0% for AGIs below $25k, 71.4% for AGIs $25k-50k, 80.0% for AGIs $50k-75k, 62.5% for AGIs $75k-100k, 75.0% for AGIs $100k-200k)
Averages for the 2004 tax year for zip code 47557, filed in 2005:
Average Adjusted Gross Income (AGI) in 2004: $36,569 (Individual Income Tax Returns)
Here:
$36,569
State:
$44,790
Salary/wage: $34,855 (reported on 84.4% of returns)
Here:
$34,855
State:
$39,615
(% of AGI for various income ranges: 203.9% for AGIs below $10k, 71.2% for AGIs $10k-25k, 77.8% for AGIs $25k-50k, 88.0% for AGIs $50k-75k, 81.4% for AGIs $75k-100k, 60.5% for AGIs over 100k)
Taxable interest for individuals: $1,431 (reported on 44.6% of returns)
This zip code:
$1,431
Indiana:
$1,535
(% of AGI for various income ranges: 20.2% for AGIs below $10k, 3.9% for AGIs $10k-25k, 2.4% for AGIs $25k-50k, 0.3% for AGIs $50k-75k, 1.9% for AGIs $75k-100k, 0.3% for AGIs over 100k)
Taxable dividends: $1,172 (reported on 20.8% of returns)
Here:
$1,172
State:
$2,998
(% of AGI for various income ranges: 2.8% for AGIs below $10k, 1.3% for AGIs $10k-25k, 0.7% for AGIs $25k-50k, 0.8% for AGIs $50k-75k, 0.2% for AGIs $75k-100k, 0.4% for AGIs over 100k)
Net capital gain/loss: +$1,130 (reported on 16.3% of returns)
Here:
+$1,130
State:
+$8,619
(% of AGI for various income ranges: -0.4% for AGIs $10k-25k, 0.0% for AGIs $25k-50k, 0.4% for AGIs $50k-75k, 1.9% for AGIs $75k-100k, 0.3% for AGIs over 100k)
Profit/loss from business: +$6,080 (reported on 14.3% of returns)
Here:
+$6,080
State:
+$10,071
(% of AGI for various income ranges: 6.0% for AGIs below $10k, 4.8% for AGIs $10k-25k, 5.2% for AGIs $25k-50k, -0.2% for AGIs $50k-75k, 2.8% for AGIs $75k-100k)
Total itemized deductions: $15,139 (22% of AGI, reported on 17.6% of returns)
Here:
$15,139
State:
$17,065
Here:
22.3% of AGI
State:
19.5% of AGI
(% of AGI for various income ranges: 8.9% for AGIs $10k-25k, 4.3% for AGIs $25k-50k, 8.3% for AGIs $50k-75k, 7.3% for AGIs $75k-100k, 10.1% for AGIs over 100k)
Charity contributions deductions: $3,360 (5% of AGI, reported on 14.0% of returns)
Here:
$3,360
State:
$3,550
Here:
4.7% of AGI
State:
3.8% of AGI
(% of AGI for various income ranges: 1.0% for AGIs $25k-50k, 1.9% for AGIs $50k-75k, 0.6% for AGIs $75k-100k, 2.7% for AGIs over 100k)
Total tax: $4,547 (reported on 72.5% of returns)
47557:
$4,547
State:
$6,914
(% of AGI for various income ranges: 5.0% for AGIs below $10k, 3.7% for AGIs $10k-25k, 7.8% for AGIs $25k-50k, 7.9% for AGIs $50k-75k, 11.1% for AGIs $75k-100k, 15.9% for AGIs over 100k)
Earned income credit: $1,618 (reported on 16.6% of returns)
Here:
$1,618
State:
$1,685
Percentage of individuals using paid preparers for their 2004 taxes: 70.2%
Here:
70%
State:
59%
(% for various income ranges: 65.2% for AGIs below $10k, 63.6% for AGIs $10k-25k, 76.0% for AGIs $25k-50k, 70.2% for AGIs $50k-75k, 75.5% for AGIs $75k-100k, 94.7% for AGIs over 100k)
Household received Food Stamps/SNAP in the past 12 months: 83 Household did not receive Food Stamps/SNAP in the past 12 months: 467
Women who had a birth in the past 12 months: 26 (9 now married, 15 unmarried) Women who did not have a birth in the past 12 months: 245 (171 now married, 74 unmarried)
Housing units in zip code 47557 with a mortgage: 196 (23 second mortgage, 24 both second mortgage and home equity loan) Houses without a mortgage: 19
Median monthly owner costs for units with a mortgage: $1,050 Median monthly owner costs for units without a mortgage: $421
Residents with income below the poverty level in 2022:
This zip code:
22.2%
Whole state:
12.6%
Residents with income below 50% of the poverty level in 2022:
This zip code:
21.3%
Whole state:
6.3%
Median number of rooms in houses and condos:
Here:
6.1
State:
6.6
Median number of rooms in apartments:
Here:
4.6
State:
4.3
Notable locations in this zip code not listed on our city pages
Size of family households: 180 2-persons, 29 3-persons, 114 4-persons, 25 5-persons, 12 6-persons, 3 7-or-more-persons
Size of nonfamily households: 170 1-person, 8 2-persons, 1 3-persons
267 married couples with children.
52 single-parent households (6 men, 46 women).
98.4% of residents of 47557 zip code speak English at home.
0.7% of residents speak other Indo-European language at home (100% well).
Foreign born population: 0 (0.0%)
:
0.0%
Whole state:
6.1%
50%German
17%English
13%American
5%Irish
2%Swedish
1%European
1%French
Facilities with environmental interests located in this zip code:
ARCHER DANIELS MIDLAND (SR 241 & US 61 in MONROE CITY, IN)
AIR MAJOR (AIRS/AFS) STATE MASTER (Indiana facility tracking) - ACES-OP-08300013, AIR PROGRAM Business SIC classification: GRAIN AND FIELD BEANS
MONROE CITY FEED MILL (SR 61 & SR 241 in MONROE CITY, IN)
STATE MASTER (Indiana facility tracking) - UST-5832, UNDERGROUND STORAGE TANK PROGRAM, CRTK-8568, EPCRA COMPLIANCE ACTIVITY (Tracking inspections of insecticide, fungicide, and rodenticide, and toxic substances) Alternative names: MONROE COUNTY FEED MILL
BB MINING INC PRIDE MINE (10471 S SR 61 in MONROE CITY, IN)
STATE MASTER (Indiana facility tracking) National Pollutant Discharge Elimination System NON-MAJOR (Tracking pollutant discharge elimination systems) - permit TRI REPORTER (Tracking of toxic chemicals releasing facilities) Business SIC classification: BITUMINOUS COAL AND LIGNITE SURFACE MINING; BITUMINOUS COAL UNDERGROUND MINING Organizations: TIM KERR (CONTACT/OPERATOR)
Alternative names: B B MINING INC., BB MINING, INC., PRIDE MINE S-321
MONROE CITY WWTP (SR 61 & CR 1000 in MONROE CITY, IN)
STATE MASTER (Indiana facility tracking) National Pollutant Discharge Elimination System NON-MAJOR (Tracking pollutant discharge elimination systems) - permit Business SIC classification: SEWERAGE SYSTEMS Organizations: BRAD LOVELESS 15105 EXP 63004 (CONTACT/OPERATOR)
, MONROE CITY TOWN COUNCIL (CONTACT/OWNER)
Alternative names: MONROE CITY MUNICIPAL STP
B B MINING, INC. (C.R. 1250 SOUTH AND HIGHWAY 61 in MONROE CITY, IN)
AIR MINOR (AIRS/AFS) STATE MASTER (Indiana facility tracking) Business SIC classification: MEAT PACKING PLANTS
D&D CYLINDERHEAD MACHINE (RR 1 BOX 156 D in MONROE CITY, IN)
STATE MASTER (Indiana facility tracking) Conditionally Exempt Small Quantity Generators, less than 100 kg/month of hazardous waste (Resource Conservation and Recovery Act (tracking hazardous waste)) - notification Organizations: RICHARD DEARING (CONTACT/OWNER)
Housing units lacking complete plumbing facilities: 1.1% Housing units lacking complete kitchen facilities: 2.7%
60.3%Utility gas
19.3%Electricity
17.5%Bottled, tank, or LP gas
2.1%Wood
1.3%Fuel oil, kerosene, etc.
Population in 1990: 1,915.
Place of birth for U.S.-born residents:
This state: 1,044
Northeast: 3
Midwest: 121
South: 108
West: 29
70% of the 47557 zip code residents lived in the same house 5 years ago. Out of people who lived in different houses, 80% lived in this county. Out of people who lived in different counties, 50% lived in Indiana.
93% of the 47557 zip code residents lived in the same house 1 year ago. Out of people who lived in different houses, 66% moved from this county. Out of people who lived in different houses, 33% moved from different county within same state. Out of people who lived in different houses, 3% moved from different state.
Private vs. public school enrollment:
Students in private schools in grades 1 to 8 (elementary and middle school):
Here:
0.0%
Indiana:
14.9%
Students in private schools in grades 9 to 12 (high school):
Here:
0.0%
Indiana:
11.4%
Students in private undergraduate colleges:
Here:
2.9%
Indiana:
22.3%
Occupation by median earnings in the past 12 months ($)
75,021Management occupations
72,702Education, training, and library occupations
68,621Installation, maintenance, and repair occupations
58,682Law enforcement workers including supervisors
52,801Production occupations
50,750Construction and extraction occupations
Top industries in this zip code by the number of employees in 2005:
Health Care and Social Assistance: Offices of Physicians (except Mental Health Specialists) (10-19: 1)
Mining: Bituminous Coal and Lignite Surface Mining (10-19: 1)
Construction: Plumbing, Heating, and Air-Conditioning Contractors (5-9: 1)
Wholesale Trade: Grain and Field Bean Merchant Wholesalers (5-9: 1)
Other Services (except Public Administration): Religious Organizations (5-9: 1)
Construction: Electrical Contractors (5-9: 1)
People in group quarters in 2000:
3 people in homes for the mentally retarded
Fatal accident statistics in 2014:
Fatal accident count: 1
Vehicles involved in fatal accidents: 1
Fatal accidents caused by drunken drivers: 1
Fatalities: 1
Persons involved in fatal accidents: 1
Pedestrians involved in fatal accidents: 0
Fatal accident statistics in 2012:
Fatal accident count: 1
Vehicles involved in fatal accidents: 1
Fatal accidents caused by drunken drivers: 0
Fatalities: 1
Persons involved in fatal accidents: 1
Pedestrians involved in fatal accidents: 0
2003 - 2018 National Fire Incident Reporting System (NFIRS) incidents
Based on the data from the years 2003 - 2018 the average number of fires per year is 15. The highest number of fire incidents - 32 took place in 2010, and the least - 2 in 2014. The data has a decreasing trend.
When looking into fire subcategories, the most reports belonged to: Outside Fires (46.1%), and Structure Fires (38.7%).
Fire incident types reported to NFIRS in Zip Code 47557


 Nearest zip codes: 47597, 47567, 47591, 47640, 47501, 47512.


 Based on the data from the years 2003 - 2018 the average number of fires per year is 15. The highest number of fire incidents - 32 took place in 2010, and the least - 2 in 2014. The data has a decreasing trend.
 When looking into fire subcategories, the most reports belonged to: Outside Fires (46.1%), and Structure Fires (38.7%).