Estimated zip code population in 2022: 1,507 Zip code population in 2010: 1,352 Zip code population in 2000: 1,418
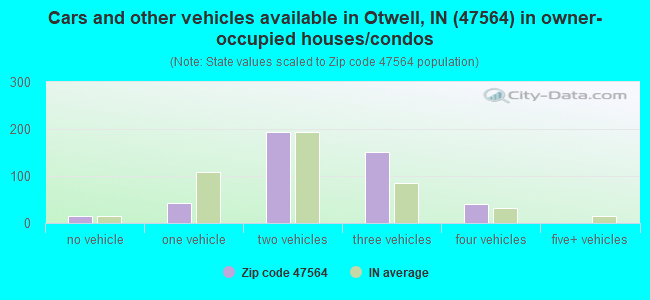
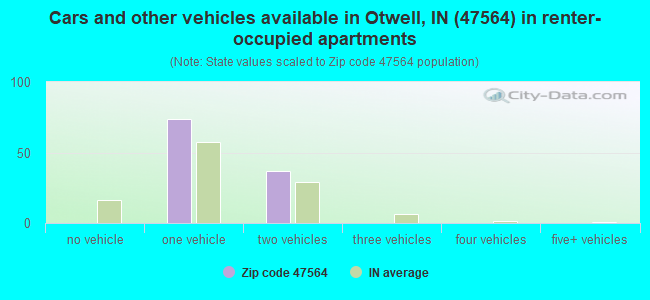
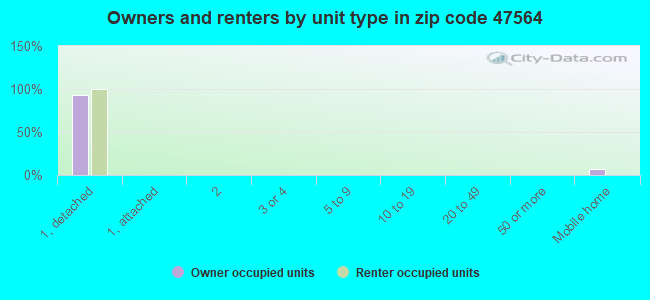
Houses and condos: 600 Renter-occupied apartments: 110
% of renters here:
20%
State:
29%
March 2022 cost of living index in zip code 47564: 86.1 (less than average, U.S. average is 100)
Land area: 36.8 sq. mi. Water area: 0.5 sq. mi.
Population density: 41 people per square mile
(very low).
OSM Map
General Map
Google Map
MSN Map
OSM Map
General Map
Google Map
MSN Map
OSM Map
General Map
Google Map
MSN Map
OSM Map
General Map
Google Map
MSN Map
Please wait while loading the map...
Real estate property taxes paid for housing units in 2022:
This zip code:
0.8% ($1,260)
Indiana:
0.7% ($1,467)
Median real estate property taxes paid for housing units with mortgages in 2022: $1,436 (0.7%) Median real estate property taxes paid for housing units with no mortgage in 2022: $683 (0.5%)
Business Search- 14 Million verified businesses
Males: 828
(54.9%)
Females: 679
(45.1%)
For population 25 years and over in 47564:
High school or higher: 73.3%
Bachelor's degree or higher: 8.3%
Graduate or professional degree: 2.2%
Unemployed: 5.2%
Mean travel time to work (commute): 19.1 minutes
For population 15 years and over in 47564:
Never married: 16.1%
Now married: 74.0%
Separated: 0.0%
Widowed: 4.5%
Divorced: 5.4%
Zip code 47564 compared to state average:
Black race population percentage significantly below state average.
Hispanic race population percentage significantly below state average.
Median age below state average.
Foreign-born population percentage significantly below state average.
Length of stay since moving in significantly above state average.
Number of college students significantly below state average.
Percentage of population with a bachelor's degree or higher significantly below state average.
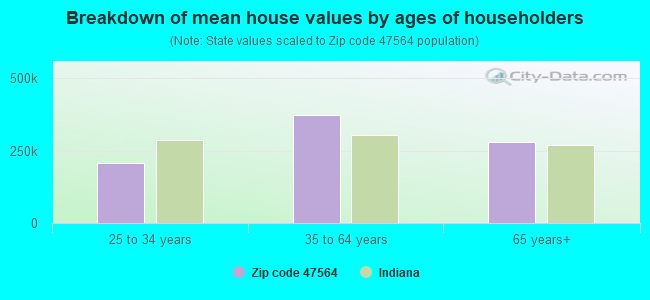
Estimated median house/condo value in 2022: $163,118
47564:
$163,118
Indiana:
$208,700
According to our research of Indiana and other state lists, there were 3 registered sex offenders living in 47564 zip code as of June 19, 2024. The ratio of all residents to sex offenders in zip code 47564 is 551 to 1. The ratio of registered sex offenders to all residents in this zip code is near the state average.
Median resident age:
This zip code:
31.2 years
Indiana median age:
38.2 years
Average household size:
This zip code:
2.7 people
Indiana:
2.4 people
Averages for the 2020 tax year for zip code 47564, filed in 2021:
Average Adjusted Gross Income (AGI) in 2020: $59,931 (Individual Income Tax Returns)
Here:
$59,931
State:
$64,978
Salary/wage: $50,205 (reported on 85.9% of returns)
Here:
$50,205
State:
$55,245
(% of AGI for various income ranges: 1095.5% for AGIs below $25k, 3786.9% for AGIs $25k-50k, 6111.1% for AGIs $50k-75k, 9192.0% for AGIs $75k-100k, 16270.0% for AGIs $100k-200k)
Taxable interest for individuals: $825 (reported on 31.2% of returns)
This zip code:
$825
Indiana:
$1,351
(% of AGI for various income ranges: 40.9% for AGIs below $25k, 6.9% for AGIs $25k-50k, 22.2% for AGIs $50k-75k, 26.0% for AGIs $75k-100k, 111.4% for AGIs $100k-200k)
Ordinary dividends: $3,964 (reported on 21.9% of returns)
Here:
$3,964
State:
$5,827
(% of AGI for various income ranges: 36.4% for AGIs below $25k, 54.4% for AGIs $50k-75k, 398.0% for AGIs $75k-100k, 381.4% for AGIs $100k-200k)
Net capital gain/loss in AGI: +$4,933 (reported on 18.8% of returns)
Here:
+$4,933
State:
+$17,730
(% of AGI for various income ranges: 36.2% for AGIs $25k-50k, 72.0% for AGIs $75k-100k, 727.1% for AGIs $100k-200k)
Profit/loss from business: +$6,138 (reported on 12.5% of returns)
Here:
+$6,138
State:
+$12,144
(% of AGI for various income ranges: 179.2% for AGIs $25k-50k, 368.6% for AGIs $100k-200k)
Taxable individual retirement arrangement distribution: $11,300 (reported on 9.4% of returns)
47564:
$11,300
Indiana:
$18,302
(% of AGI for various income ranges: 156.4% for AGIs below $25k, 562.2% for AGIs $50k-75k)
Earned income credit: $2,075 (reported on 12.5% of returns)
Here:
$2,075
State:
$2,298
(% of AGI for various income ranges: 73.6% for AGIs below $25k, 65.4% for AGIs $25k-50k)
Percentage of individuals using paid preparers for their 2020 taxes: 95.3%
Here:
95%
State:
94%
(% for various income ranges: 100.0% for AGIs below $25k, 93.8% for AGIs $25k-50k, 90.9% for AGIs $50k-75k, 87.5% for AGIs $75k-100k, 100.0% for AGIs $100k-200k)
Averages for the 2012 tax year for zip code 47564, filed in 2013:
Average Adjusted Gross Income (AGI) in 2012: $50,630 (Individual Income Tax Returns)
Here:
$50,630
State:
$52,932
Salary/wage: $43,587 (reported on 84.1% of returns)
Here:
$43,587
State:
$45,173
(% of AGI for various income ranges: 72.1% for AGIs below $25k, 81.5% for AGIs $25k-50k, 74.8% for AGIs $50k-75k, 80.2% for AGIs $75k-100k, 61.3% for AGIs $100k-200k)
Taxable interest for individuals: $1,081 (reported on 33.3% of returns)
This zip code:
$1,081
Indiana:
$1,311
(% of AGI for various income ranges: 2.1% for AGIs below $25k, 0.4% for AGIs $25k-50k, 1.2% for AGIs $50k-75k, 0.3% for AGIs $75k-100k, 0.5% for AGIs $100k-200k)
Ordinary dividends: $1,907 (reported on 23.8% of returns)
Here:
$1,907
State:
$4,690
(% of AGI for various income ranges: 1.1% for AGIs below $25k, 0.5% for AGIs $25k-50k, 1.1% for AGIs $50k-75k, 0.7% for AGIs $75k-100k, 1.0% for AGIs $100k-200k)
Net capital gain/loss in AGI: +$5,656 (reported on 14.3% of returns)
Here:
+$5,656
State:
+$10,406
(% of AGI for various income ranges: 0.6% for AGIs below $25k, 3.3% for AGIs $50k-75k, 2.6% for AGIs $100k-200k)
Profit/loss from business: +$5,071 (reported on 11.1% of returns)
Here:
+$5,071
State:
+$11,105
(% of AGI for various income ranges: 4.8% for AGIs below $25k, 2.9% for AGIs $50k-75k, 0.5% for AGIs $75k-100k)
Taxable individual retirement arrangement distribution: $7,171 (reported on 11.1% of returns)
47564:
$7,171
Indiana:
$13,841
Total itemized deductions: $19,017 (20% of AGI, reported on 19.0% of returns)
Here:
$19,017
State:
$20,913
Here:
20.0% of AGI
State:
18.2% of AGI
(% of AGI for various income ranges: 12.7% for AGIs below $25k, 9.8% for AGIs $50k-75k, 5.9% for AGIs $75k-100k, 8.5% for AGIs $100k-200k)
Charity contributions: $2,829 (reported on 11.1% of returns)
Here:
$2,829
State:
$4,697
Taxes paid: $5,683 (reported on 19.0% of returns)
47564:
$5,683
State:
$7,456
(% of AGI for various income ranges: 2.0% for AGIs below $25k, 2.2% for AGIs $50k-75k, 1.9% for AGIs $75k-100k, 3.4% for AGIs $100k-200k)
Earned income credit: $1,950 (reported on 15.9% of returns)
Here:
$1,950
State:
$2,265
(% of AGI for various income ranges: 5.5% for AGIs below $25k, 0.9% for AGIs $25k-50k)
Percentage of individuals using paid preparers for their 2012 taxes: 74.6%
Here:
75%
State:
53%
(% for various income ranges: 72.7% for AGIs below $25k, 73.3% for AGIs $25k-50k, 81.8% for AGIs $50k-75k, 62.5% for AGIs $75k-100k, 85.7% for AGIs $100k-200k)
Averages for the 2004 tax year for zip code 47564, filed in 2005:
Average Adjusted Gross Income (AGI) in 2004: $37,301 (Individual Income Tax Returns)
Here:
$37,301
State:
$44,790
Salary/wage: $35,564 (reported on 83.3% of returns)
Here:
$35,564
State:
$39,615
(% of AGI for various income ranges: 66.1% for AGIs below $10k, 73.2% for AGIs $10k-25k, 81.7% for AGIs $25k-50k, 82.2% for AGIs $50k-75k, 90.0% for AGIs $75k-100k, 62.4% for AGIs over 100k)
Taxable interest for individuals: $1,544 (reported on 50.2% of returns)
This zip code:
$1,544
Indiana:
$1,535
(% of AGI for various income ranges: 8.4% for AGIs below $10k, 5.2% for AGIs $10k-25k, 2.8% for AGIs $25k-50k, 0.8% for AGIs $50k-75k, 0.2% for AGIs $75k-100k, 2.2% for AGIs over 100k)
Taxable dividends: $865 (reported on 25.1% of returns)
Here:
$865
State:
$2,998
(% of AGI for various income ranges: 4.4% for AGIs below $10k, 0.6% for AGIs $10k-25k, 0.6% for AGIs $25k-50k, 0.6% for AGIs $50k-75k, 0.2% for AGIs $75k-100k, 0.3% for AGIs over 100k)
Net capital gain/loss: +$4,321 (reported on 16.4% of returns)
Here:
+$4,321
State:
+$8,619
(% of AGI for various income ranges: 0.3% for AGIs below $10k, 0.2% for AGIs $10k-25k, 1.7% for AGIs $25k-50k, 1.8% for AGIs $50k-75k, 0.1% for AGIs $75k-100k, 6.4% for AGIs over 100k)
Profit/loss from business: +$5,600 (reported on 12.5% of returns)
Here:
+$5,600
State:
+$10,071
(% of AGI for various income ranges: 7.9% for AGIs below $10k, 5.2% for AGIs $10k-25k, 2.5% for AGIs $25k-50k, 1.6% for AGIs $50k-75k, 0.3% for AGIs $75k-100k)
Total itemized deductions: $13,548 (20% of AGI, reported on 18.5% of returns)
Here:
$13,548
State:
$17,065
Here:
20.4% of AGI
State:
19.5% of AGI
(% of AGI for various income ranges: 9.4% for AGIs $10k-25k, 4.4% for AGIs $25k-50k, 6.1% for AGIs $50k-75k, 7.6% for AGIs $75k-100k, 10.4% for AGIs over 100k)
Charity contributions deductions: $2,000 (3% of AGI, reported on 11.3% of returns)
Here:
$2,000
State:
$3,550
Here:
2.9% of AGI
State:
3.8% of AGI
(% of AGI for various income ranges: 0.5% for AGIs $25k-50k, 0.6% for AGIs $50k-75k, 0.6% for AGIs $75k-100k, 1.5% for AGIs over 100k)
Total tax: $4,331 (reported on 76.4% of returns)
47564:
$4,331
State:
$6,914
(% of AGI for various income ranges: 2.1% for AGIs below $10k, 3.9% for AGIs $10k-25k, 6.9% for AGIs $25k-50k, 8.9% for AGIs $50k-75k, 10.3% for AGIs $75k-100k, 14.9% for AGIs over 100k)
Earned income credit: $1,616 (reported on 12.6% of returns)
Here:
$1,616
State:
$1,685
Percentage of individuals using paid preparers for their 2004 taxes: 73.6%
Here:
74%
State:
59%
(% for various income ranges: 65.4% for AGIs below $10k, 74.3% for AGIs $10k-25k, 78.2% for AGIs $25k-50k, 73.3% for AGIs $50k-75k, 78.7% for AGIs $75k-100k, 72.4% for AGIs over 100k)
Churches in zip code 47564 include: Iva Union Church (A), Lemmon Church (B), New Lebanon Church (C), Saint Johns Church (D), Traylor Union Church (E), Vincent Church (F). Display/hide their locations on the map
Cemeteries: Independent Order of Odd Fellows Cemetery (1), Logan Cemetery (2), Chapel Cemetery (3), Case Cemetery (4). Display/hide their locations on the map
Size of family households: 183 2-persons, 109 3-persons, 78 4-persons, 48 5-persons, 11 6-persons
Size of nonfamily households: 104 1-person, 21 2-persons
445 married couples with children.
41 single-parent households (41 men).
97.1% of residents of 47564 zip code speak English at home.
2.3% of residents speak Spanish at home (100% very well).
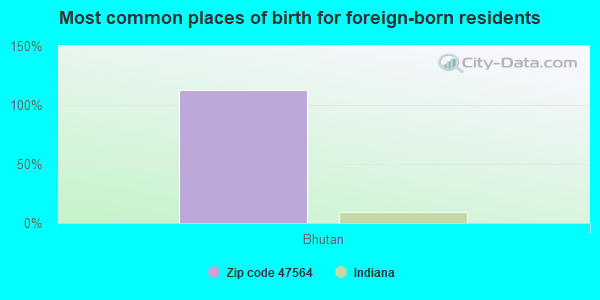
Foreign born population: 8 (0.6%) (0.0% of them are naturalized citizens)
:
0.6%
Whole state:
6.1%
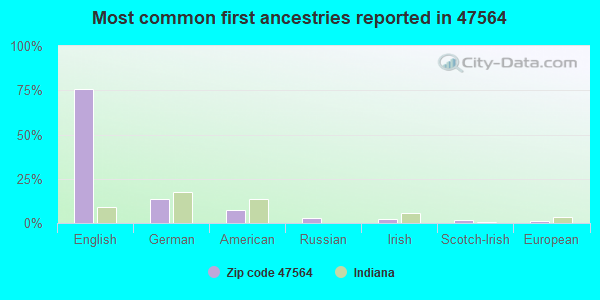
112%Bhutan
76%English
14%German
7%American
3%Russian
2%Irish
1%Scotch-Irish
1%European
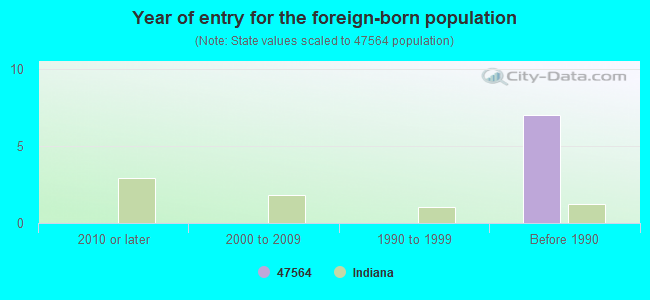
Year of entry for the foreign-born population
02010 or later
02000 to 2009
01990 to 1999
7Before 1990
Facilities with environmental interests located in this zip code:
OTWELL ELEMENTARY SCHOOL (1869 N SR 257 in OTWELL, IN)
(Geographic Names Information System) (National Center for Education Statistics) - STATE ID-6759 Organizations: PIKE COUNTY SCHOOL CORP (SCHOOL DISTRICT)
OTWELL WWTP (2055 N SR 257 in OTWELL, IN)
STATE MASTER (Indiana facility tracking) National Pollutant Discharge Elimination System NON-MAJOR (Tracking pollutant discharge elimination systems) - permit COMMUNITY WATER SYSTEM (SDWIS) Business SIC classification: WATER SUPPLY Organizations: KEITH BREIDENBAUGH (CONTACT/OPERATOR)
, OTWELL WATER CORP (CONTACT/OWNER)
Alternative names: OTWELL WATER CORPORATION, OTWELL WATER DEPARTMENT, OTWELL WATER TREATMENT PLANT, WATER TREATMENT PLANT JEFFERSO
Housing units lacking complete plumbing facilities: 10.5% Housing units lacking complete kitchen facilities: 2.4%
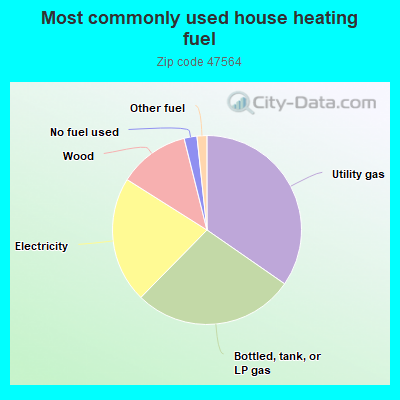
34.8%Utility gas
27.8%Bottled, tank, or LP gas
21.7%Electricity
12.2%Wood
2.2%No fuel used
1.7%Other fuel
Population in 1990: 912. Population change in the 1990s: +506 (+55.5%).
Place of birth for U.S.-born residents:
This state: 1,003
Northeast: 45
Midwest: 217
South: 190
West: 31
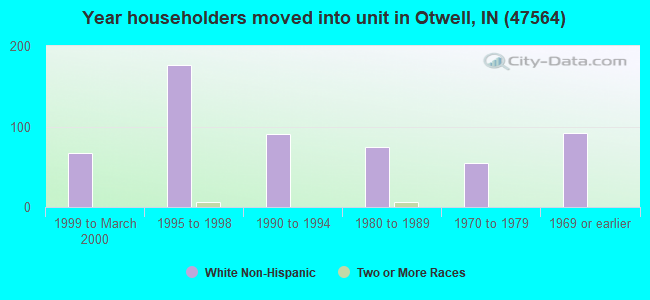
63% of the 47564 zip code residents lived in the same house 5 years ago. Out of people who lived in different houses, 38% lived in this county. Out of people who lived in different counties, 50% lived in Indiana.
98% of the 47564 zip code residents lived in the same house 1 year ago. Out of people who lived in different houses, 122% moved from this county.
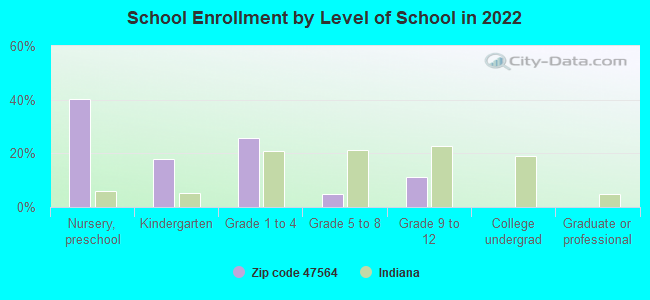
Private vs. public school enrollment:
Students in private schools in grades 1 to 8 (elementary and middle school): 42
Here:
36.3%
Indiana:
14.9%
Students in private schools in grades 9 to 12 (high school):
Here:
0.0%
Indiana:
11.4%
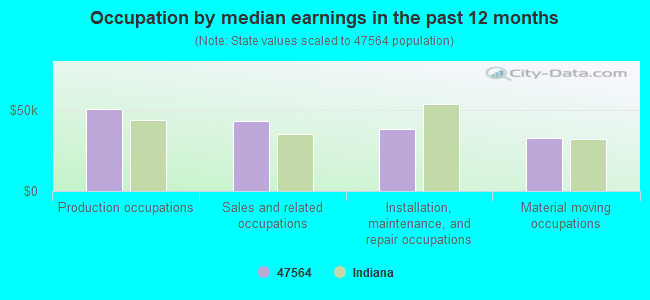
Occupation by median earnings in the past 12 months ($)
50,404Production occupations
42,806Sales and related occupations
38,371Installation, maintenance, and repair occupations
32,487Material moving occupations
Top industries in this zip code by the number of employees in 2005:
Wholesale Trade: Farm and Garden Machinery and Equipment Merchant Wholesalers (20-49 employees: 1 establishment)
Real Estate and Rental and Leasing: Truck, Utility Trailer, and RV (Recreational Vehicle) Rental and Leasing (10-19: 1)
Finance and Insurance: Commercial Banking (5-9: 1)
Construction: Highway, Street, and Bridge Construction (5-9: 1)
Other Services (except Public Administration): Religious Organizations (1-4: 2)
2002 - 2018 National Fire Incident Reporting System (NFIRS) incidents
Based on the data from the years 2002 - 2018 the average number of fires per year is 8. The highest number of fire incidents - 20 took place in 2010, and the least - 0 in 2016. The data has a decreasing trend.
When looking into fire subcategories, the most reports belonged to: Outside Fires (45.5%), and Structure Fires (34.3%).
Fire incident types reported to NFIRS in Zip Code 47564

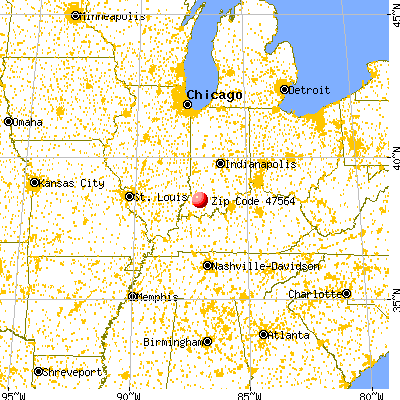


 Nearest zip codes: 47590, 47598, 47519, 47558, 47546, 47501.


 Based on the data from the years 2002 - 2018 the average number of fires per year is 8. The highest number of fire incidents - 20 took place in 2010, and the least - 0 in 2016. The data has a decreasing trend.
 When looking into fire subcategories, the most reports belonged to: Outside Fires (45.5%), and Structure Fires (34.3%).